Wyckoff Unleashed Official Online Course
-
Wyckoff Pure – 1931 Course
Foreword – 1M1 Quiz -
The Basic Law Of Supply And Demand – 2M1 Quiz
-
Judging The Market By Its Own Action – 3M1 Quiz
-
Forms Of Charts – 4M1 Quiz
-
Buying and Selling Waves – 5M1 Quiz
-
Chart Records – 6M1 Quiz
-
Determining The Trend Of The Market By The Daily Vertical Chart – 7M1 Quiz
-
Comparing Strength And Weakness Group Charts – 8M1 Quiz
-
Individual Chart Studies – 9M, 10M, 11M, 12M, 13M1 Quiz
-
An Introduction to Figure Chart Counting
-
Market Technique – 14M1 Quiz
-
Significance Of Trend Lines – 15M1 Quiz
-
Individual Chart Studies – 16M, 17M1 Quiz
-
Selecting The Best Stocks – 18M1 Quiz
-
How To Determine The Position Of An Individual Stock – 19M1 Quiz
-
Buying And Selling Tests – 20M1 Quiz
-
Refinements – 21M1 Quiz
-
The Wave Chart – 22M1 Quiz
-
Stop Orders – 23M1 Quiz
-
General Instructions – 24M1 Quiz
-
Market Philosophy – 25M1 Quiz
-
Audio Lecture SeriesPhilosophy And History – Lecture 11 Quiz
-
Trends – Lecture 21 Quiz
-
Accumulation – Lecture 31 Quiz
-
Climaxes And Secondary Tests – Lecture 41 Quiz
-
Springs And Shakeouts – Lecture 51 Quiz
-
Jump Across The Creek – Lecture 61 Quiz
-
Upthrust After Distribution – Lecture 71 Quiz
-
Counts & The Count Guide – Lecture 81 Quiz
-
Speculating – Taking A Position – Lecture 91 Quiz
-
Wyckoff Wave And The Optimism-Pessimism Index (OP) – Lecture 101 Quiz
-
Step-By-Step Accumulation – Lecture 111 Quiz
-
Step-By-Step Distribution – Lecture 121 Quiz
-
The Force Index – Lecture 131 Quiz
-
The Technometer – Lecture 141 Quiz
-
Bringing It All TogetherUse Our Wyckoff Proprietary Indicators At TradingView To Put What You Have Learned To Work.
-
Final ExamWYCKOFF UNLEASHED FINAL EXAM – Part A “Wyckoff Principles and Techniques”1 Quiz
-
WYCKOFF UNLEASHED FINAL EXAM – Part B “Utilizing The Five Step Wyckoff Method”1 Quiz
-
WYCKOFF UNLEASHED FINAL EXAM – Part C “The Wyckoff Wave and Optimism-Pessimism Index, Force Index, and Technometer”1 Quiz
-
WYCKOFF UNLEASHED FINAL EXAM – Part D “Marking Up Charts”1 Quiz
-
MOVING FORWARDPractice Trading
-
Conclusion
-
GLOSSARY
Wyckoff Wave And The Optimism-Pessimism Index (OP) – Lecture 10 Quiz
Todd Butterfield April 10, 2022
Quiz Summary
0 of 11 Questions completed
Questions:
Information
You have already completed the quiz before. Hence you can not start it again.
Quiz is loading…
You must sign in or sign up to start the quiz.
You must first complete the following:
Results
Results
0 of 11 Questions answered correctly
Your time:
Time has elapsed
You have reached 0 of 0 point(s), (0)
Earned Point(s): 0 of 0, (0)
0 Essay(s) Pending (Possible Point(s): 0)
Categories
- Not categorized 0%
- 1
- 2
- 3
- 4
- 5
- 6
- 7
- 8
- 9
- 10
- 11
- Current
- Review
- Answered
- Correct
- Incorrect
-
Question 1 of 11
1. Question
A divergence is when the Wyckoff Wave and the Optimism-Pessimism Index move in the same direction, but do not move at the same rate or speed.
CorrectIncorrect -
Question 2 of 11
2. Question
The Wyckoff Wave is for price, what the Optimism-Pessimism is for volume.
CorrectIncorrect -
Question 3 of 11
3. Question
The intraday chart allows the student to drill down and study the very smallest waves that build into the large and major moves.
CorrectIncorrect -
Question 4 of 11
4. Question
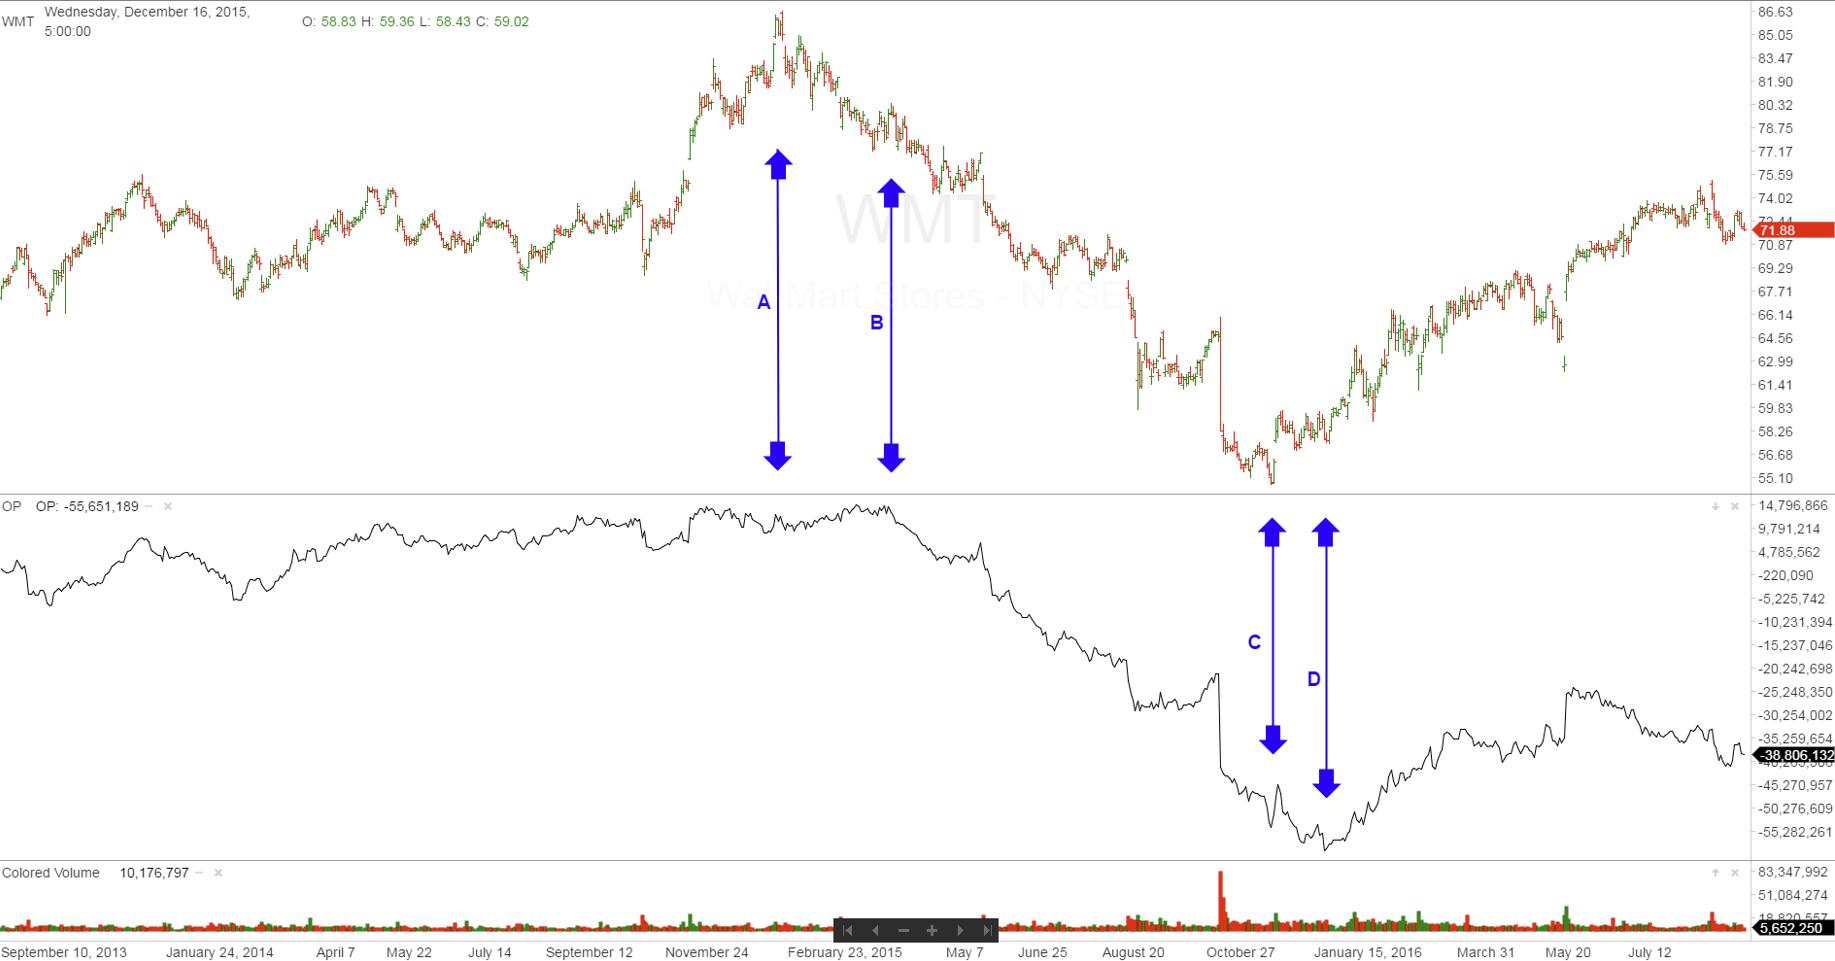
On the chart of WalMart, the OP rallied to a new high at point B, while the price did not. What is this an example of.
 CorrectIncorrect
 -
Question 5 of 11
5. Question
On the chart of Walmart, at point D the OP Index had went to a new low compared to point C, while the price did not. What does this signify.
 CorrectIncorrect
 -
Question 6 of 11
6. Question
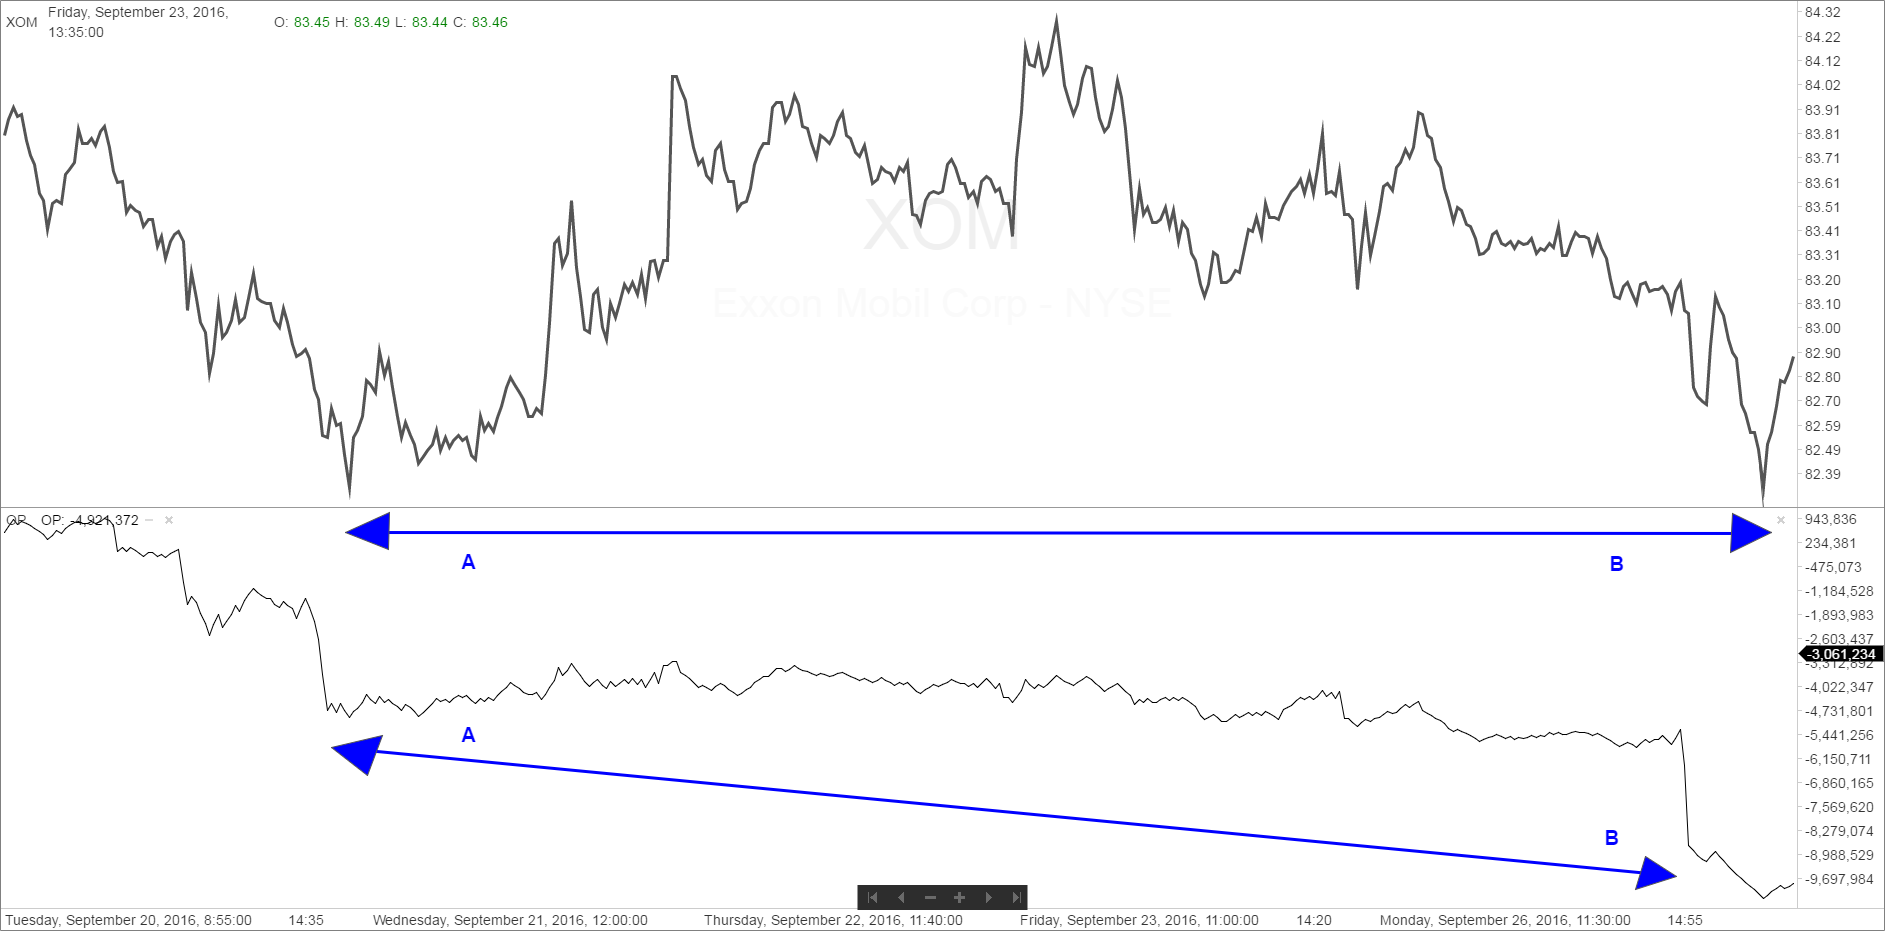
This is a chart of Exxon Mobil 2016. The chart shows the OP going to a new low at B, while the price only goes to a minor new low. This is called what.
 CorrectIncorrect
 -
Question 7 of 11
7. Question
This would be an indication to carefully analyze this stock for a possible buy or sell in your opinion.
 CorrectIncorrect
 -
Question 8 of 11
8. Question
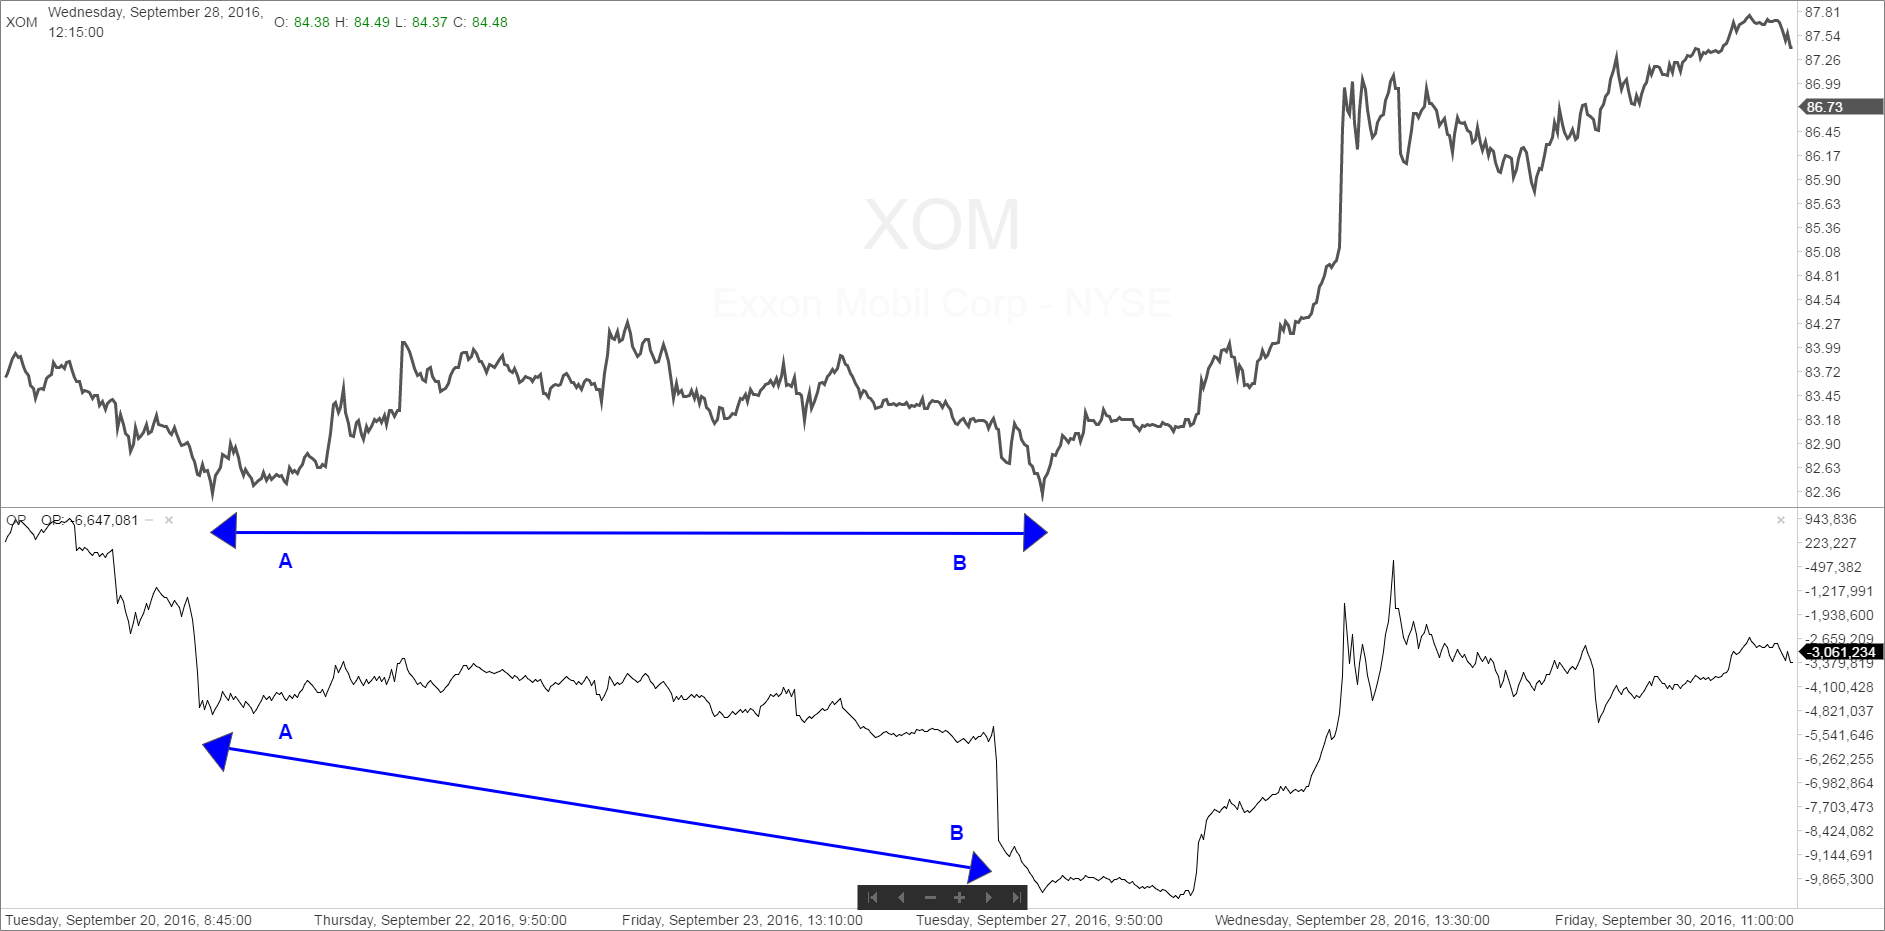
As you can see the stock catapulted higher after this Inharmonious Action, as well as having a Divergence the next day when then OP went to another new low while the price held much higher. At the top of the chart Exxon Mobil has touched almost $88. What is now showing at this level in the relationship between the stock and its OP Index?
 CorrectIncorrect
 -
Question 9 of 11
9. Question
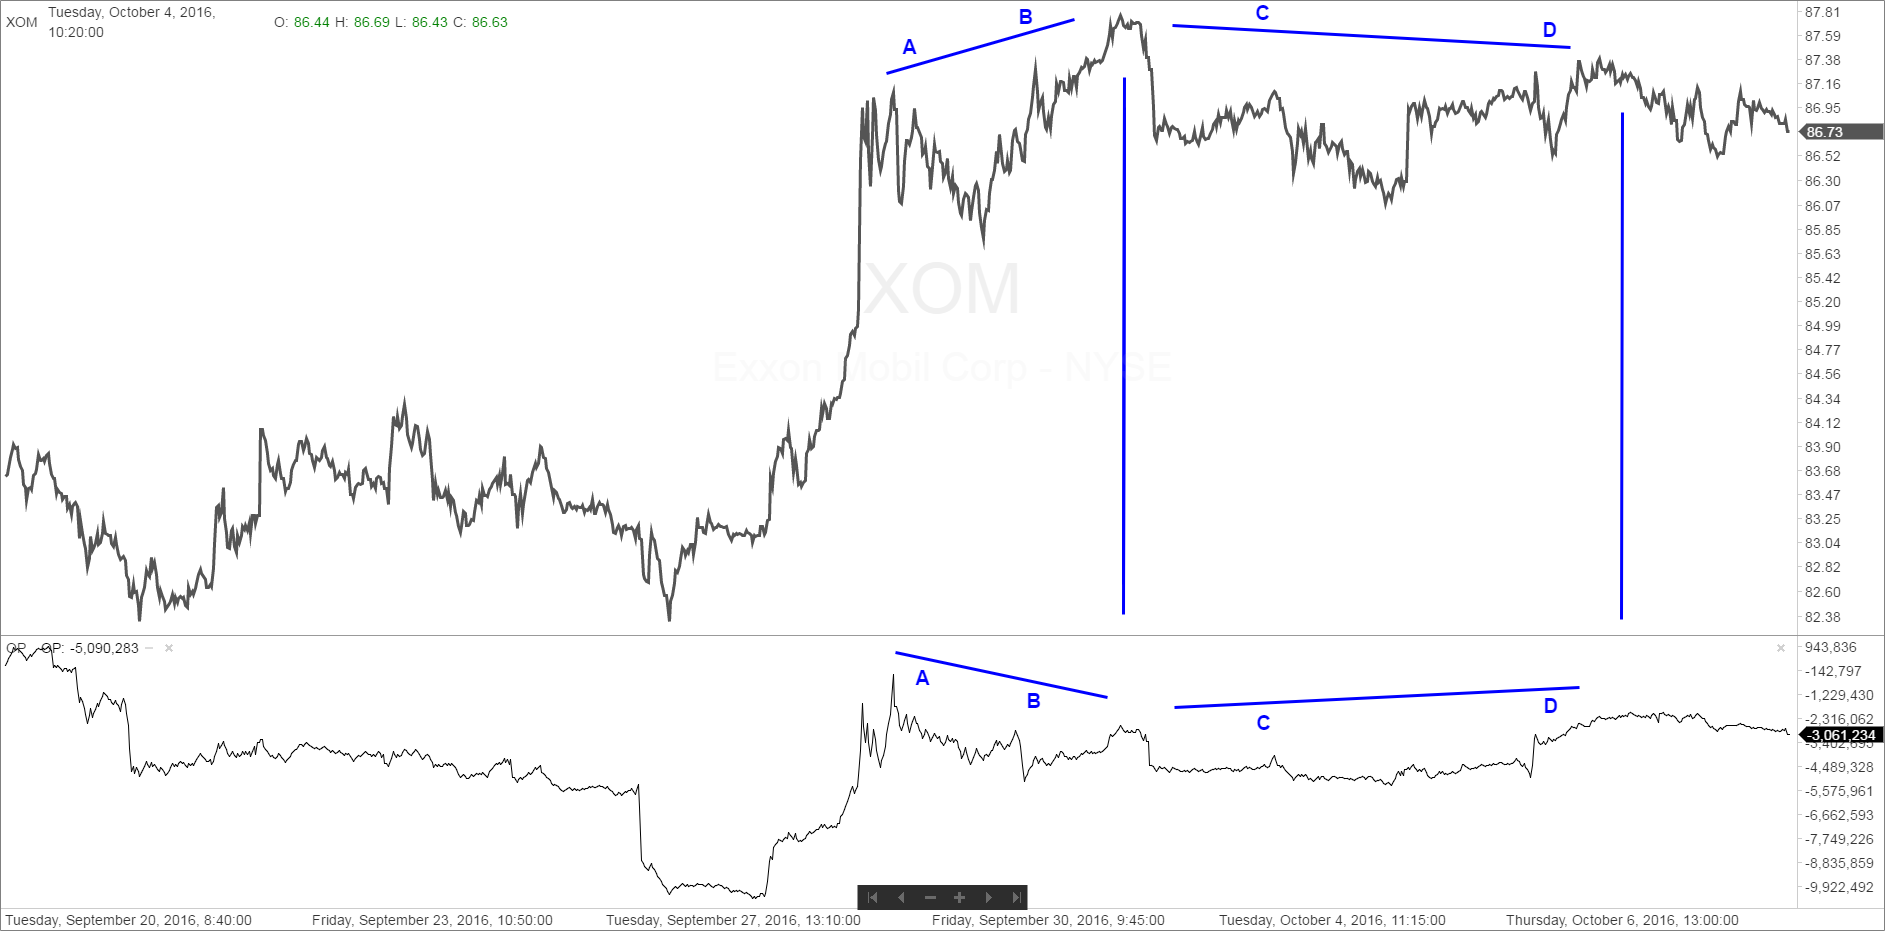
Continuing with the intraday chart of Exxon Mobil, what is the action designated at A-B.
 CorrectIncorrect
 -
Question 10 of 11
10. Question
What is the action between C-D
 CorrectIncorrect
 -
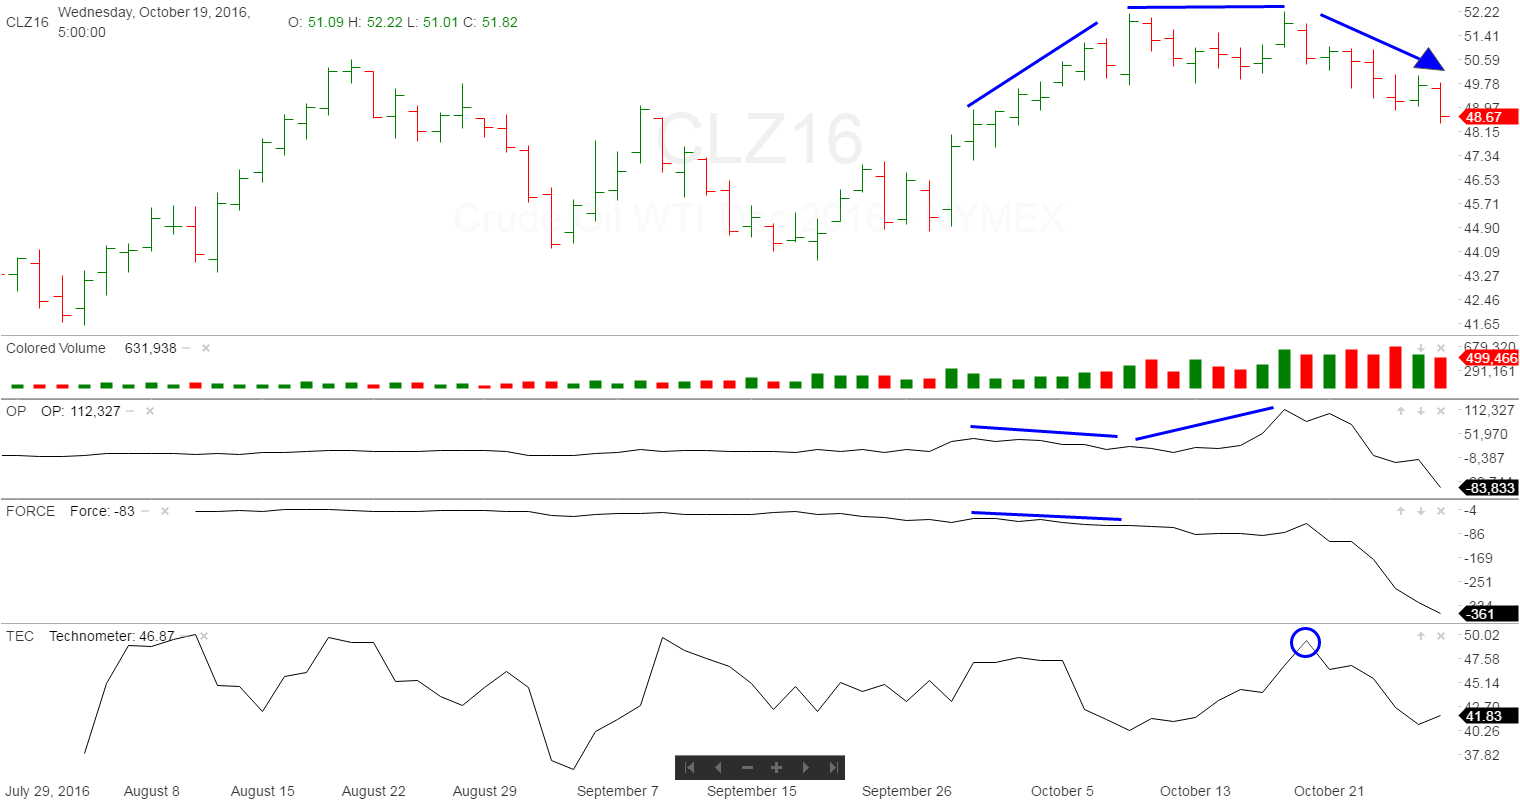
Question 11 of 11
11. Question
What does this Crude Oil futures contract chart show.
 CorrectIncorrect

