Comparing Strength And Weakness Group Charts – 8M

Todd Butterfield June 10, 2022
 Loading…


IMPORTANT POINTS
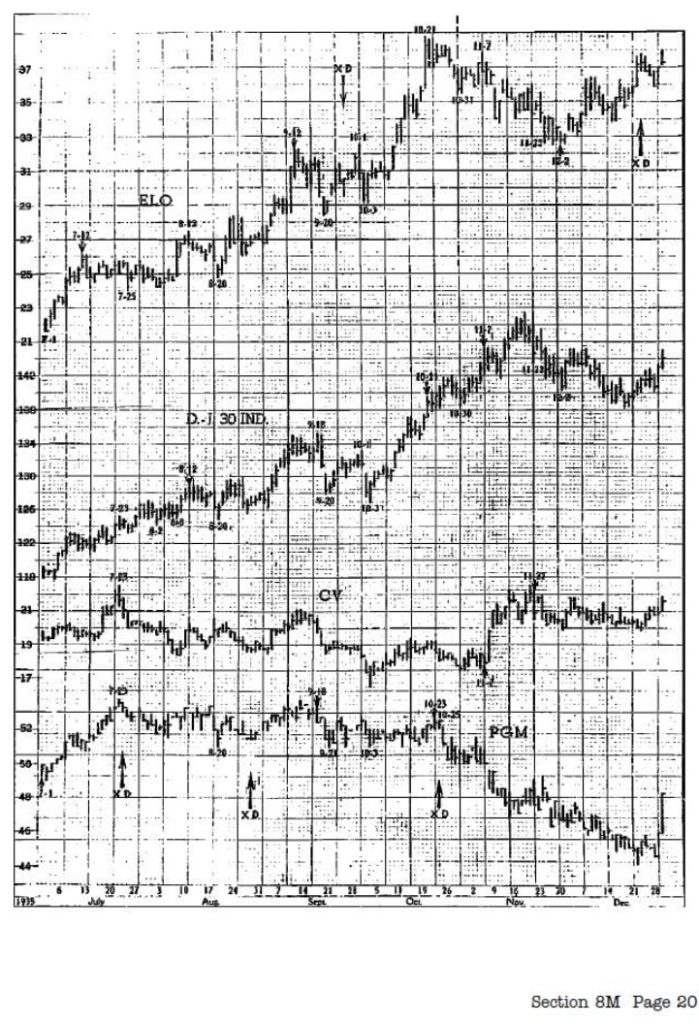
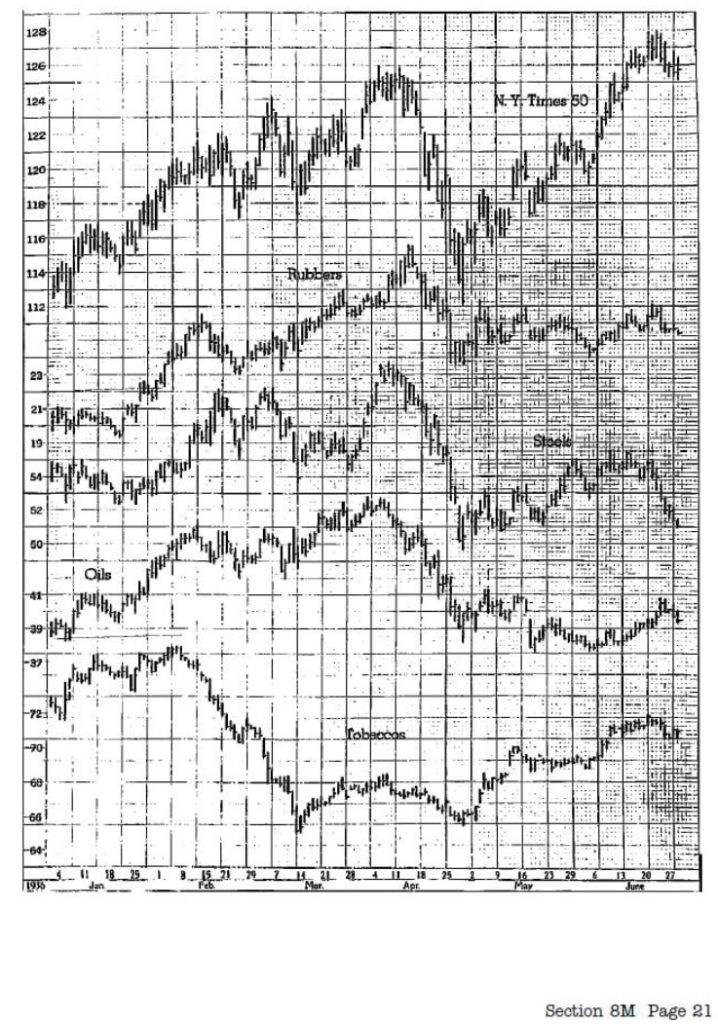
1. After examining the position and trend of the market, examine the position and trend of various groups.
2. An excellent indication of the future trend of a stock is its comparative strength in a weak market – and its comparative weakness in a strong market.
3. Figure charts frequently indicate the probable objective of a large operator’s campaign.
4. Strong support in a stock in a weak market indicates that the buying is better than the selling.
5. All stocks do not move in harmony with the market trend. Exhausted demand may be indicated:
a. by sluggish response to hypodermics
b. when stocks fall on the continued process of rotation
c. when the rotation shifts from leaders to secondary issues
d. when representative stocks fail to follow the strength of a few issues.
6. Seek out stocks in the strongest position when buying – and at the weakest position when selling short.
7. Judge the progress of stocks and compare strengths and weaknesses directly from your charts.
8. Two common errors are:
a. failure to wait for a stock to act correctly before making a commitment
b. a habit of optimistic stubbornness which causes one to be wedded to his commitment.
9. Comparative strength and weakness studies can aid in:
a. selecting the best stocks
b. detecting turning points
c. determining the completion of preparation.