
 Loading…


IMPORTANT POINTS
1. Most principal moves in the market are caused by large interests.
2. Charts are graphic representations of stock transactions.
3. Charts have great value in determining the position and probable future trend of the market or an individual stock.
4. To study charts, look for the motives behind the action which the chart portrays.
5. Wyckoff SMI recommends three types of charts: Vertical Line Charts, Figure Charts, and Intra-Day Wave Charts.
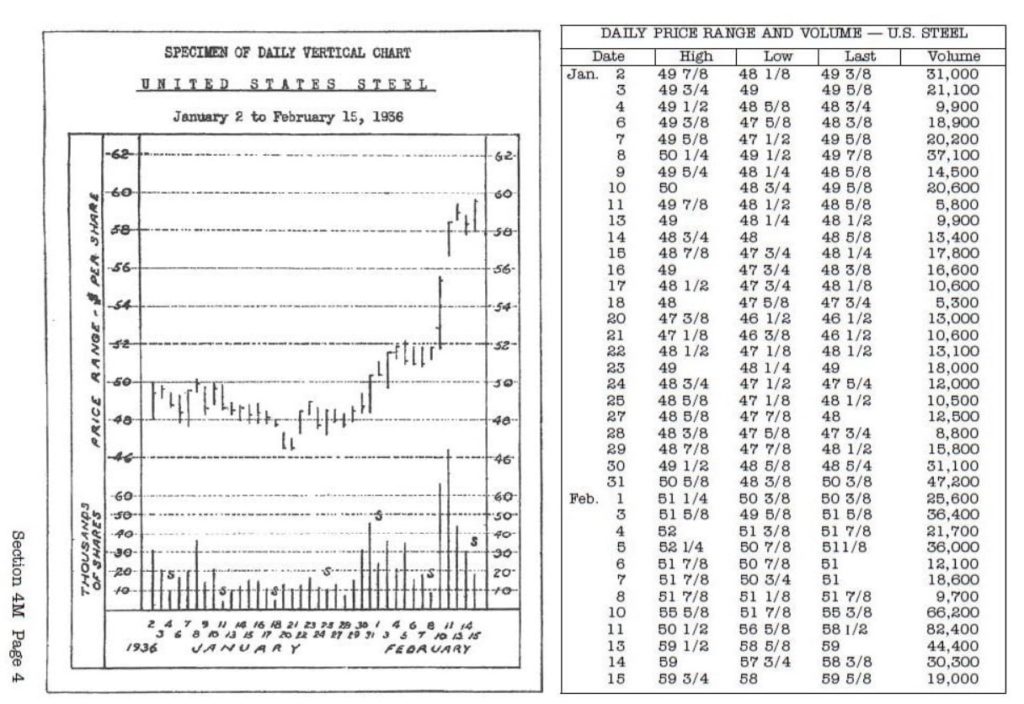
6. Vertical line charts show the high, low, and closing prices as well as the volume.
7. Volume and price movement provide the greatest aid in:
a. determining the direction of coming moves.
b. deciding when to buy or sell.
c. knowing when a stock is on the ‘springboard.’
d. knowing when a move is culminating.
8. On figure charts, a person is able to detect accumulation and distribution from the general formations.
9. Horizontal formations on the figure chart indicate the probable direction and approximate number of points a stock should move.
10. Horizontal formations on figure charts are of value in determining:
a. how far a stock should move.
b. when it meets opposition.
c. the trend.
d. when a stock is on the ‘springboard.’
11. Figure Charts only take into account whole number fluctuations.
a. A 3-point figure chart disregards all reversals less than three whole digits.
b. A 5-point figure chart-disregards all reversals less than 5 full digits.
12. The 1-pt. figure chart indicates immediate objectives; whereas the 3-pt. figure chart is used as a guide to the general trend.
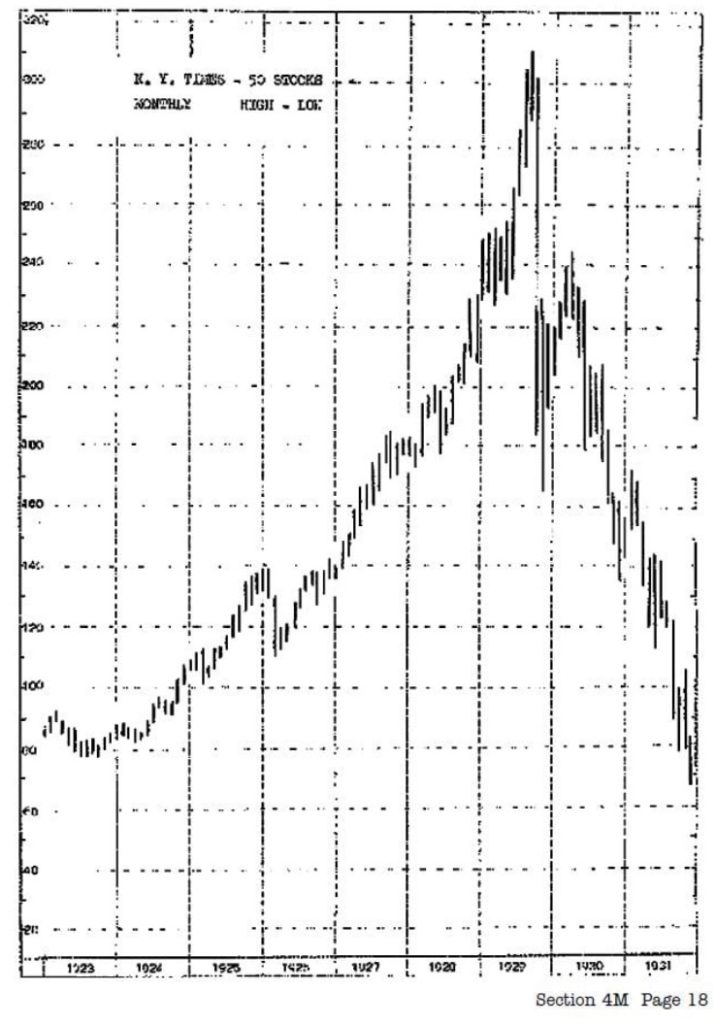
13. The purpose of trend charts (Vertical Line Chart of composite indexes) is to enable you to keep in harmony with the trend.
14. The trend is the line of least resistance; it is the most important fact to know about the market or a stock.
15. A bull market (an upward move) begins at the bottom of a panic or depression.
16. A bear market (a downward move) begins at the peak of a boom.
17. Generally, stocks move more uniformly in declining markets than they do in advancing markets.
18. Vertical Line Charts are essential for the proper timing of commitments and detecting minor turning points.
19. In deciding when to act, the Intra-Day Wave Chart is the best guide.
20. The Intra Day Wave Chart gives a graphic representation of the day’s tape action.
21. Group charts are trend charts of’the various groups of industries.
22. The Position Sheet is an adequate substitute for group charts.