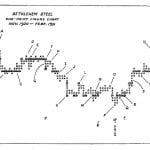
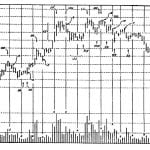
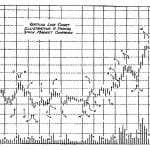
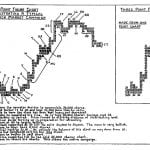
Individual Chart Studies – 9M, 10M, 11M, 12M, 13M

Todd Butterfield April 19, 2022
 Loading…
IMPORTANT POINTS
1. It requires a higher degree of skill and more experience to trade against the trend of the market than to trade in harmony with the market.
2. It is important to study price movement and volume behavior.
3. The Composite Man carefully plans, executes and. concludes his campaigns.
4. A ‘broad market’ is created by the Composite Man advertising his stock on the ticker tape.
5. The buying and selling associated with accumulation is generally accomplished in a trading range.
6. When a stock comes to dead center, it is probably preparing for an immediate sharp move.
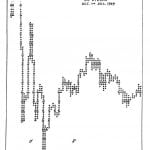
7. Horizontal formations on the figure chart often show levels of support and accumulation after a down move and distribution after an up move.
8. Counting the number of times a stock is supported at a particular point (on the figure chart) indicates the possible number of points that stock may move.
9. By taking a position close to the danger point, you limit your risk to a minimum.
10. Chart indications may imply that a stock is going a possible distance in a certain direction – but only so long as its future behavior continues to conform to the original indications.
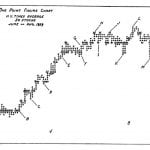
11. Rising supports often indicate accumulation.
12. Large volume at the top of a mark-up is a possible indication of distribution.
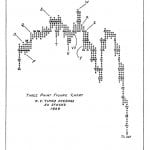
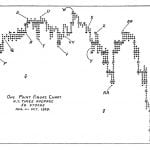
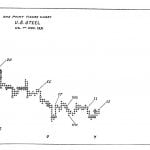
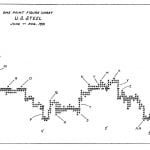
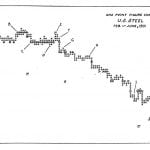
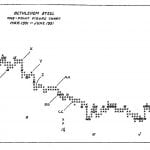
13. Three-point figure chart indications may be compared to the one-point figure chart to see if they confirm each other.
14. Price fluctuations are determined by the unbalancing of the forces of supply and demand.
15. The Securities and Exchange Commission (SEC) was established in 1934 to regulate the securities industry .
16. A normal correction following a decline is a rally of one-half the distance of the decline.
17. A shake-out may be recognized by a dip below a previous support – followed by a quick rally to or above that support.
18. The flattening out in a narrow range of an advance is an indication of pressure and a possible change of direction.
19. Hypodermics can be seen as a sharp bulge which is not sustained and reacts quickly – losing all that was gained.
20. A terminal thrust is the reverse of a terminal shake-out.
21. The three-point figure chart should be considered in connection with other contemporary technical indications.
22. Lowering supports on a figure chart indicate weakness.
23. Distribution can be facilitated by attracting buyers through an elevation in the price of a stock.
24. By pyramiding on a substantial decline, profits can be greatly increased.
25. Over-running downside objectives and failure to fulfill indicated rally objectives are bearish symptoms.
26. In a trading range, the rallies and reactions following an apex should be analyzed to determine the probable direction of the next move.
27. Further advances in an upswing may be indicated by small supply and indications of strong support demonstrated by the brief duration of reactions.
28. A rally without a base (on the figure chart) may be caused by short coverings.
29. Lower tops on successive rallies is a bearish indication.
30. In a trading range, once the stock reaches an apex, we may expect an important move in whichever direction the stock breaks.
31. Some symptoms characteristic of distribution are:
a. wide amplitude in swings and their erratic nature
b. the frequent application of hypodermics
c. violent reactions or relapses.
32. Figure charts will indicate the probable objective and possibly the direction of a move.