
To draw an analogy from physics, we could say that when a Cryptocurrency is being accumulated, it is storing up a force of demand which, when later released, provides the momentum for the ensuing upward movement. When the force of this accumulative demand is released, it gives the price movement momentum that it tends to hold until it is turned off its course by weakening of the original force or by a new force sufficient to compel a change of trend. An indication that the force of demand may be dying out on a rise or encountering a superior force of supply is given when the price movement displays a tendency to flatten out or arch over.


Conversely, in a zone of distribution, a force of supply is being stored and will eventually overpower the weakening force of demand, driving the price downward until the force of supply is exhausted or demand is revitalized sufficiently to bring about a state of comparative equilibrium (trading range). Thus, a downward movement also acquires a certain momentum which it tends to hold until it is turned off its course by the original force of supply weakening or by a new force sufficient to compel a change of trend. An indication that the force of supply may be dying out on a decline or encountering a superior force of demand is given when the price movement shows a tendency to level off or round upward.
The stride (i.e., the momentum) of an upward movement is reflected in the angular upward climb of the daily vertical bars on the vertical line charts. The pace of a downward movement is reflected by their angular downward pitch. The eye may not always see the pitch of these angular swings clearly because of the confusing effect of minor irregularities of the price movement as recorded on charts. Therefore, it is helpful to employ trend lines for this purpose. Examination of the accompanying charts will illustrate how the angle of ascent or descent of prices may often be visualized more clearly by drawing straight lines through the successive tops or bottoms of the price path established during the minor, intermediate, and major moves.
Occasionally, the momentum produced by the forces of supply and demand will become so plainly marked as to develop a well-defined zone of activity. That is, the alternating buying and selling waves form a price path or channel whose upper and lower limits are easily identified by a series of tops and bottoms confined within parallel, or nearly parallel, lines.
As explained in the preceding paragraphs, the parallel sets of lines drawn on the chart are called trend lines. These trend lines serve to define the stride of the price movement, thereby directing our attention either to possibilities of an approaching change of trend or to an actual reversal. For instance, when it appears that a movement is beginning to level out in the vicinity of an established trend line, such action may be regarded as a warning to search for other possible indications of an impending change of pace or a change of trend. Similarly, the intersection of an established trend line by the price path of a Cryptocurrency may be one of the symptoms of an actual reversal of trend.
To summarize:
- The threatened violation of a trend line often (but by no means always) signifies that the force of demand or supply which was formerly in effect is now becoming exhausted. This may either mean that the price movement is merely changing its rate of progress, or it may mean that the trend is definitely in danger of being reversed. A decision either way must depend upon the other factors which are pertinent to a complete diagnosis.
- The actual violation of a trend line often (but by no means invariably) signifies that the previously effective force of supply or demand has been overcome by a new force which is causing a new trend to develop. However, as before, we must look to the other accompanying symptoms before deciding whether this one indication alone (i.e., the violation of a trend line) may be accepted as true or false.
These instructions should be thoroughly understood because, unless you are careful, you may find you have a tendency to exaggerate the importance of trend lines and an inclination to employ them in a purely mechanical way.
It is bad practice to buy a Cryptocurrency simply because it has penetrated an established supply line or broken out of an extended congestion area; or to sell it merely because it has violated a line of support or broken through the bottom of a trading zone. Do not forget: the breaking of a trend line, by itself, is neither a conclusive nor an all-inclusive symptom. The significant thing is HOW the line is broken; the conditions under which the change of stride occurs. The behavior preceding such an indication must also be taken fully into account.
In short, the quality of the buying or the selling at and around the point of penetration determines whether the violation of an established stride may be regarded as evidence of a further movement in the direction of the breakthrough, or whether it means only temporary change. This admonition applies equally to the violation of former tops and bottoms and old levels of resistance and support.
After a Cryptocurrency has moved some distance in a given direction, it may encounter sufficient resistance to that particular movement to cause it to modify its pace or to rest. During the resting spell (lateral movement or trading range), the force that was originally operative may be renewed or even greatly strengthened with the result that the next move will be resumed with greater momentum than before.
For instance, in the case of an advance, the angle of ascent may be slight for a time and then become pitched more sharply upward as the original force of demand is renewed by fresh buying from the sponsors of the move and the public, and perhaps by expanding enthusiasm of bullishly inclined traders and investors. Or, a rapid advance may be followed by further gains at a slower tempo. Under these conditions it becomes necessary for us to relocate our trend lines to conform with the newly established stride. This is an example of why one cannot accept the mere breaking of a trend line at its face value —it is imperative for you to study contemporary technical manifestations in order to determine whether a conclusive indication is being given by the violation of the trend line alone.
You must also be careful to avoid drawing trend lines indiscriminately, especially on every minor move. The correct handling of trend lines calls for good judgment. With bad judgment, the use of trend lines will produce confusion and introduce fallacies into your reasoning.
The reason why you must be especially careful about trying to apply trend lines to minor moves is this: every congestion area (horizontal formation) which develops on your charts cannot arbitrarily be regarded as either a zone of accumulation or distribution. Many of these formations may be nothing more than trading ranges which might be extended indefinitely. They may represent zones of comparative equilibrium; areas in which only small forces are at work (small rallies and reactions) and tend to neutralize each other. Bear in mind that a decisive price movement cannot be expected to occur until there is evidence that the forces of supply or demand have been accumulated to the point of becoming unbalanced enough to generate a sustained swing. Therefore, take care to analyze the behavior of a Cryptocurrency while it is forming these congestion areas to make sure that such formations actually do signify accumulation or distribution.
With the above mentioned controlling and modifying influences in mind, you will find an intelligent use of trend lines is frequently helpful in judging the points at which you may expect the price to be supported on reactions, to meet resistance on rallies, and to approach a critical position in its travel from one level to another. They will also help you to foresee possibilities of an impending change of trend before it actually takes place.
Therefore, as average prices, or prices of Cryptocurrencies, approach or touch these lines, we are given a strong hint to search for additional clues of a turning point. Special opportunities are frequently afforded the alert trader for buying or covering near a support line or an oversold position line; or for selling out or going short near a supply line or an overbought position line.
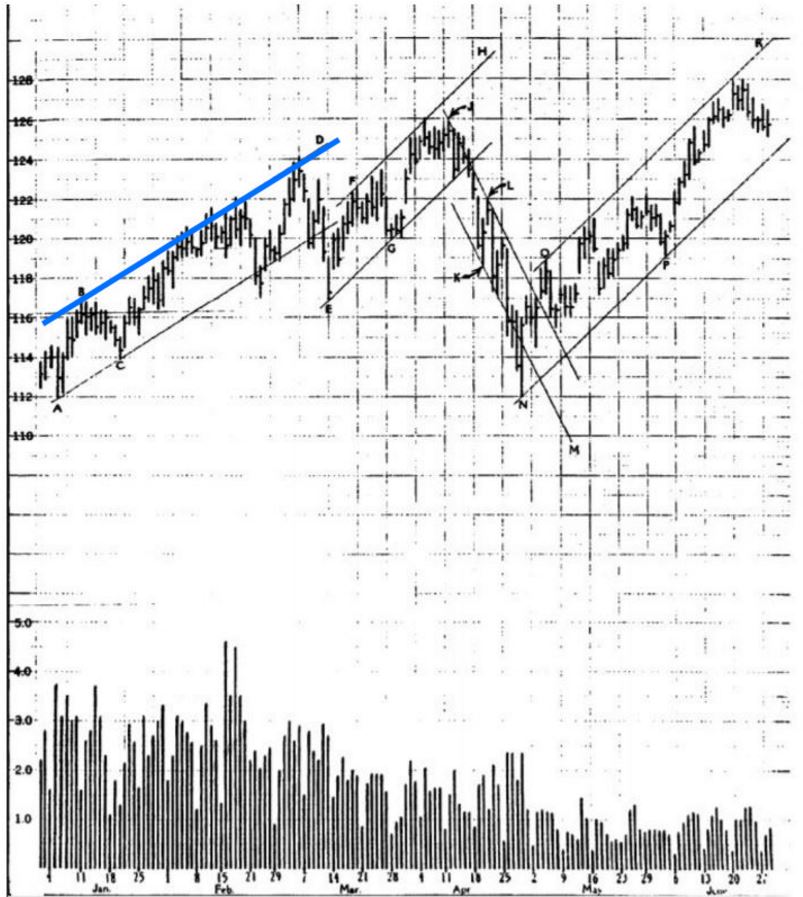
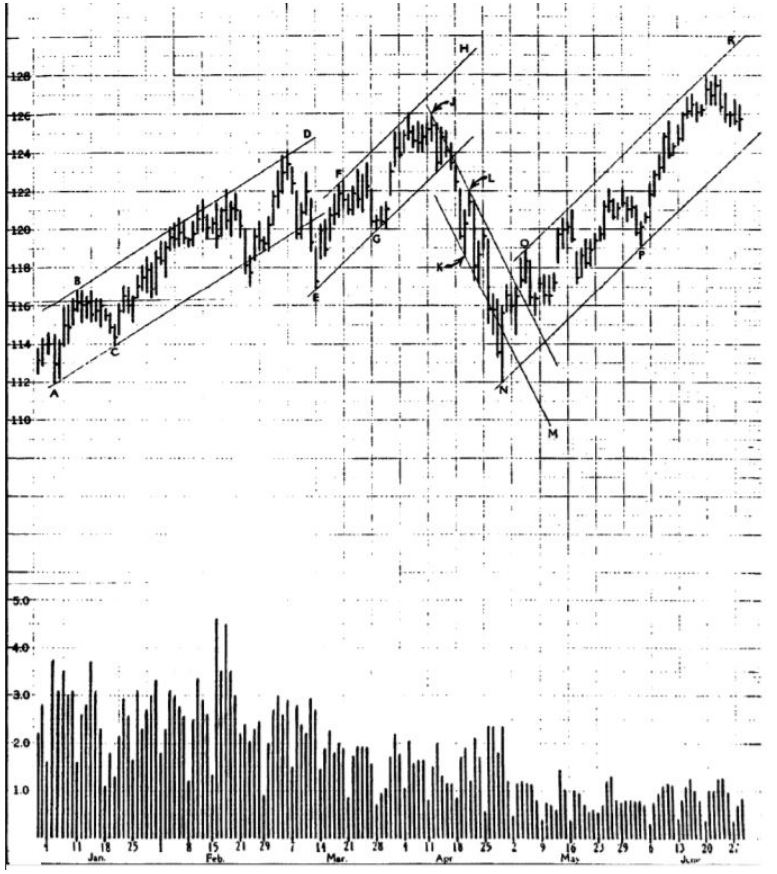
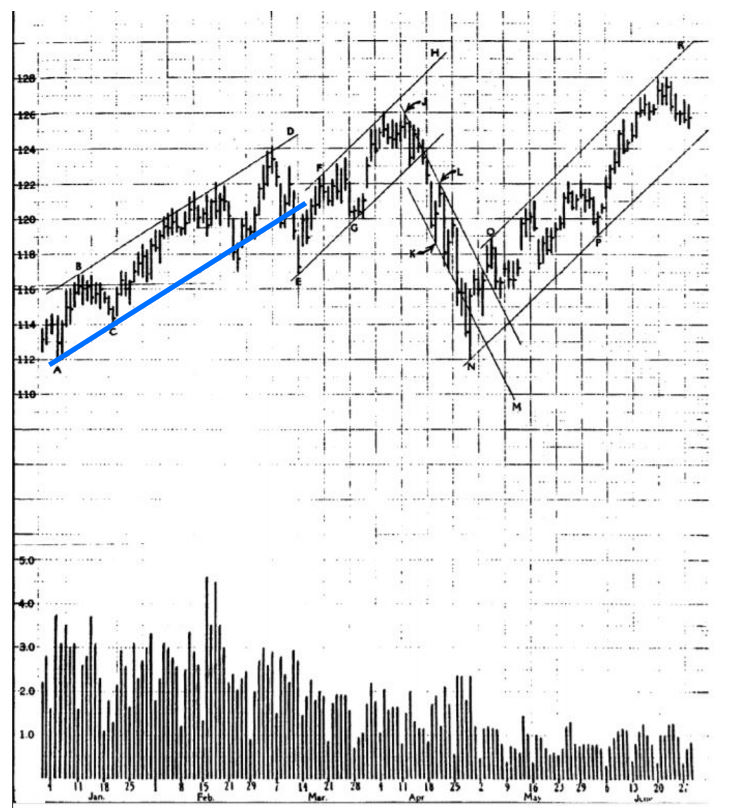
A support line is that which identifies the angle of advance of a bull swing by passing through two successive points of support (the low points of two successive reactions). Example: Lines A-C, E-G and N-P in Chart 10.2.
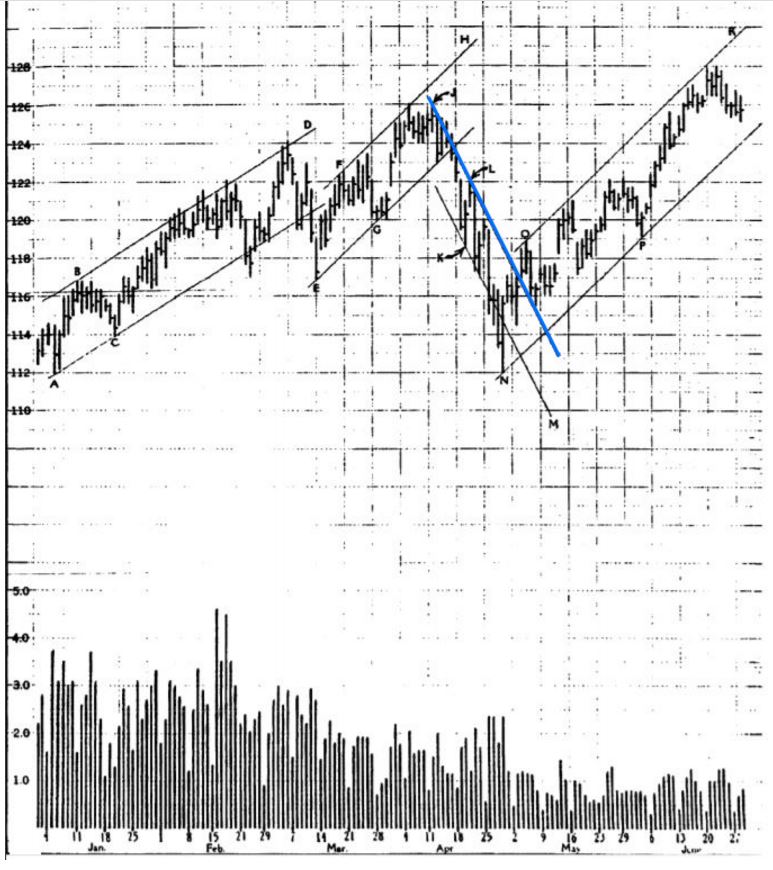
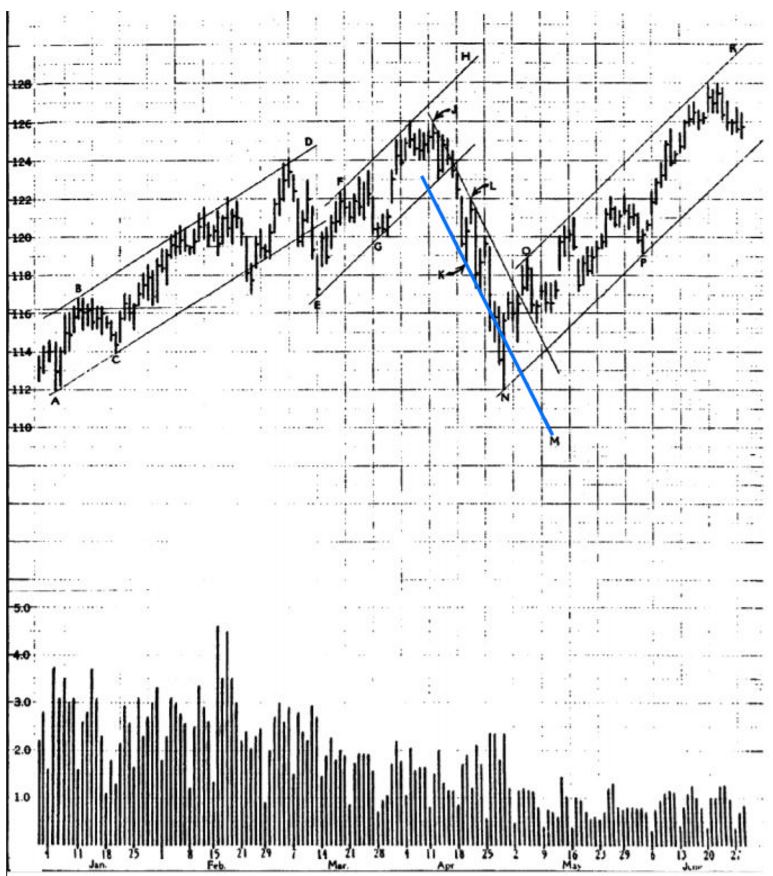
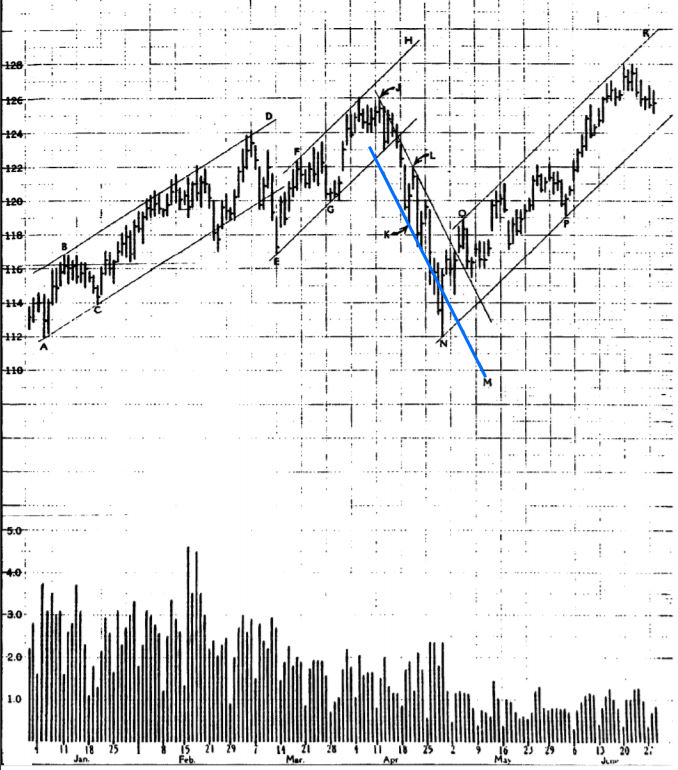
A supply line is that which identifies the angle of decline of a bear swing by passing through two successive points of resistance (top of rallies). Example: Line J-L in Chart 10.3.

An oversold position line is one that is drawn parallel to a supply line and passes through the first point of support (reaction low) which intervenes between two successive rally tops in a down trend. Example: Line K-M, Chart 10.4. Note that K is the first point of support intervening between the two successive tops, J and L.
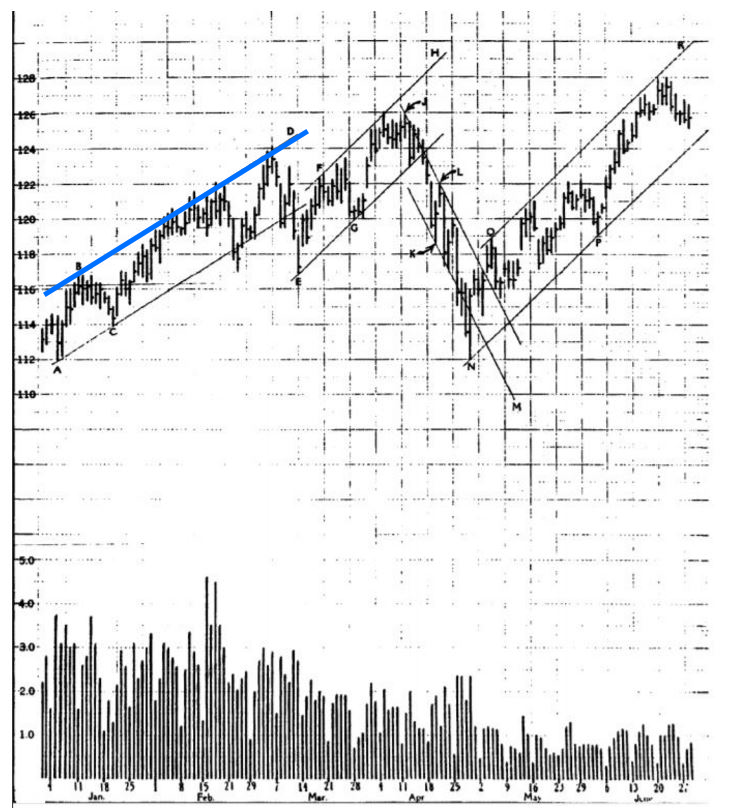
An overbought position line one that is drawn parallel to a support line and passes through the first point of resistance (rally top) intervening between two successive points of support in on up trend. Example: Lines B-D, F-H, and O-R, Chart 10.5.
The following will illustrate further how to establish trend lines in a logical manner and how to use them in a practical way.
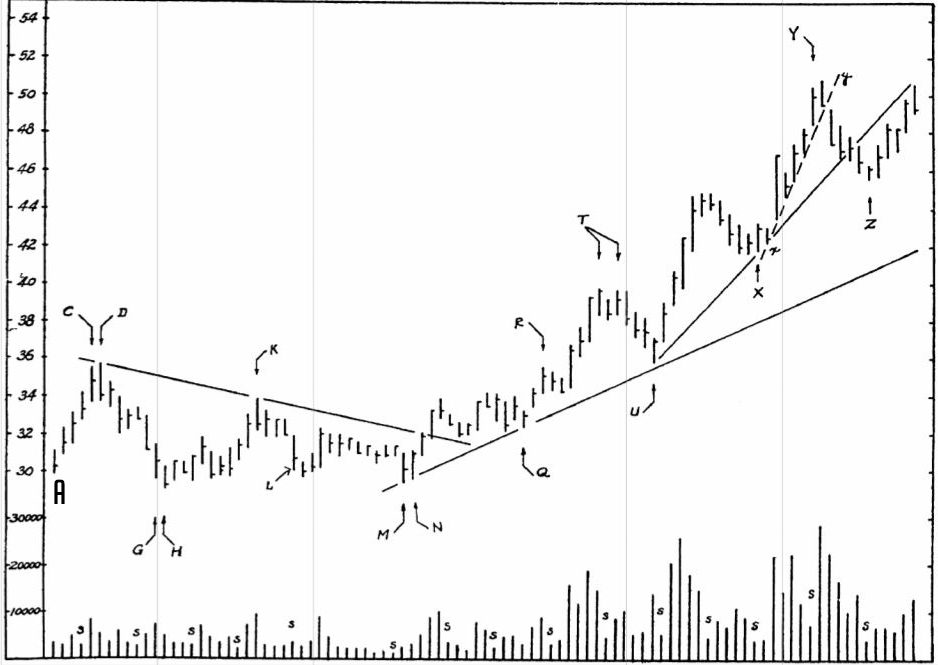
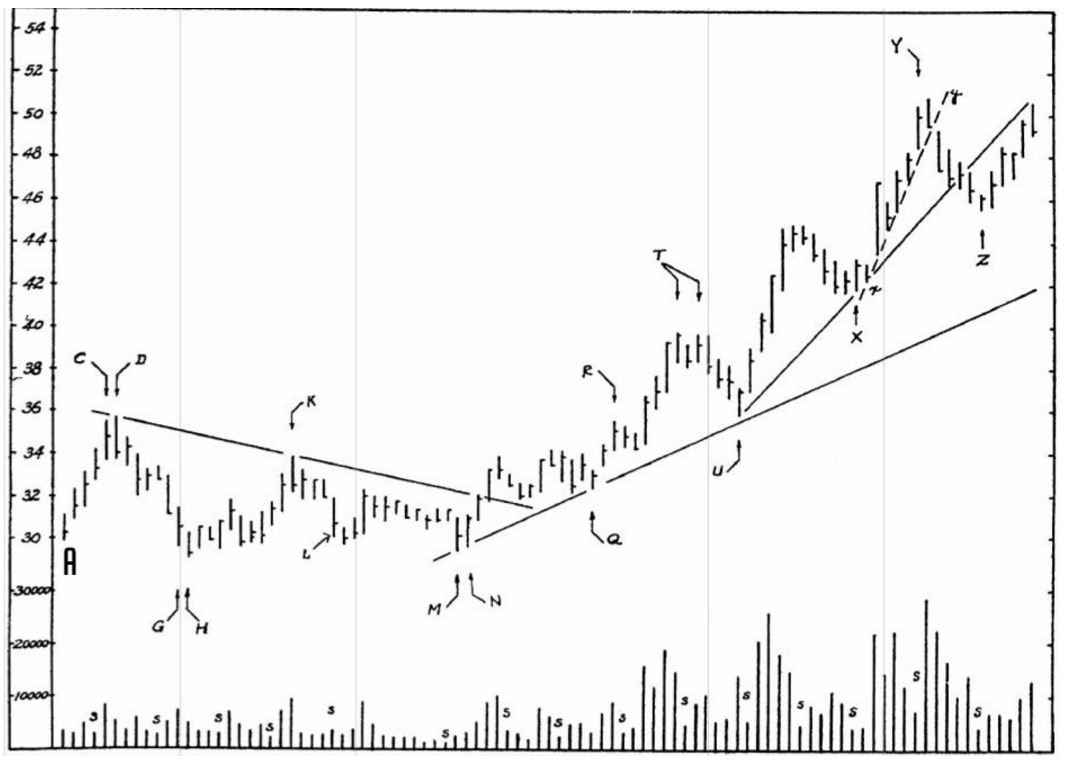
Looking at Chart 10.6, it is evident that after the reaction to point G, there are two well-defined rally tops, the first at 35 5/8 (point D) and the second at 33 7/8 (point K). Accordingly, if we draw a straight line through the extreme tops of these two rallies the moment the second high point K is distinguishable — which would be when the price has reacted to 30 1/8, near point L — we find that the extension of this supply line to the right helps to define the approximate limits of subsequent rallies until the price develops sufficient sideways movement (out to point M) to indicate an impending change of stride.
Therefore, when we see a lateral movement beginning at point L and stretching out to the right at point M, we are able to decide in advance that any material rally developing out of this sideways movement would have the effect of pushing the price up through our previously established down trend supply line D-K. Such a break-through would imply a change of stride of some importance since the Cryptocurrency has been hovering dangerously close to a critical support level (around the 30-level) and now has reached a position from which it must soon show ability to rally, otherwise it will be vulnerable to a bearish attack. If, however, it is able to rise through the supply line with some degree of power, (i.e., either with increasing volume or by a material gain in price, or both), we shall have a fairly conclusive indication that the force of demand generated in the range of 30-35 (points A to M) is finally being released and that a worthwhile upward move is probably beginning.
It is important to note that we are able to anticipate just such a break-through before its actual occurrence and to take a long position before the advance begins because our study of the Cryptocurrencies behavior in the formation of points A to M has already led us to conclude that it was in preparation for a substantial rise. The sharp shrinkage in volume on the last dip to the supporting level at 30 (point M), plus the quick rebound to 31 1/4 (point N) tells us that the available supply now has been largely exhausted and the operator has succeeded in creating a set of conditions which are ripe for springing the force of the demand that has been steadily accumulating.
The advance to point R enables us to establish the trend support line M-Q which represents the angle, or rate of acceleration, of the first phase of the bull campaign in this Cryptocurrency. Extending this line to the right, we find that after the rise is temporarily accelerated by a sharp run-up to 40 (point T), the price recedes for three days toward this line of support in what we conclude is a normal corrective reaction. We reason that if it recedes further, we may expect the price to hold on or around this line of support. It does hold, for on the quick further dip to 35 7/8 (at point U) there is an immediate rebound, marked by a closing at the high, as the price almost touches our established trend line. Thus, our trend line has given us a helpful hint as to the point at which we might reasonably look for new demand (support) and the probable place where this particular reaction should end.
After the mark-up to 46 7/8 (to the right of point X), we must readjust our trend support line because the increasing momentum of the rise from point X brings a new phase of the advance. This new phase implies that the operator may now be in a hurry to wind up his campaign. This new line runs from points U to X, but, after penetrating the extension of this line (to the left of point Z), the Cryptocurrency reacts only a little further and then quiets down, leaving us in doubt whether our trend line indication is a valid signal of weakness or whether it is merely evidence of a temporary condition requiring correction.
Meanwhile, we had an earlier warning that the swift pace of the advance from point X to point Y might not be sustained when the reaction to 47 1/2 broke the minor trend support line X-Y.
From point Z onward we must wait until the Cryptocurrency gives some new decisive indications in the trading range 46-51 before we can again get any aid from trend lines. We have no basis for establishing new trend lines until another series of intermediate movements develop and we must avoid trying to establish trend lines on small fluctuation. To use trend lines on minor dips and bulges will introduce fallacies and lead to deceptive inferences.
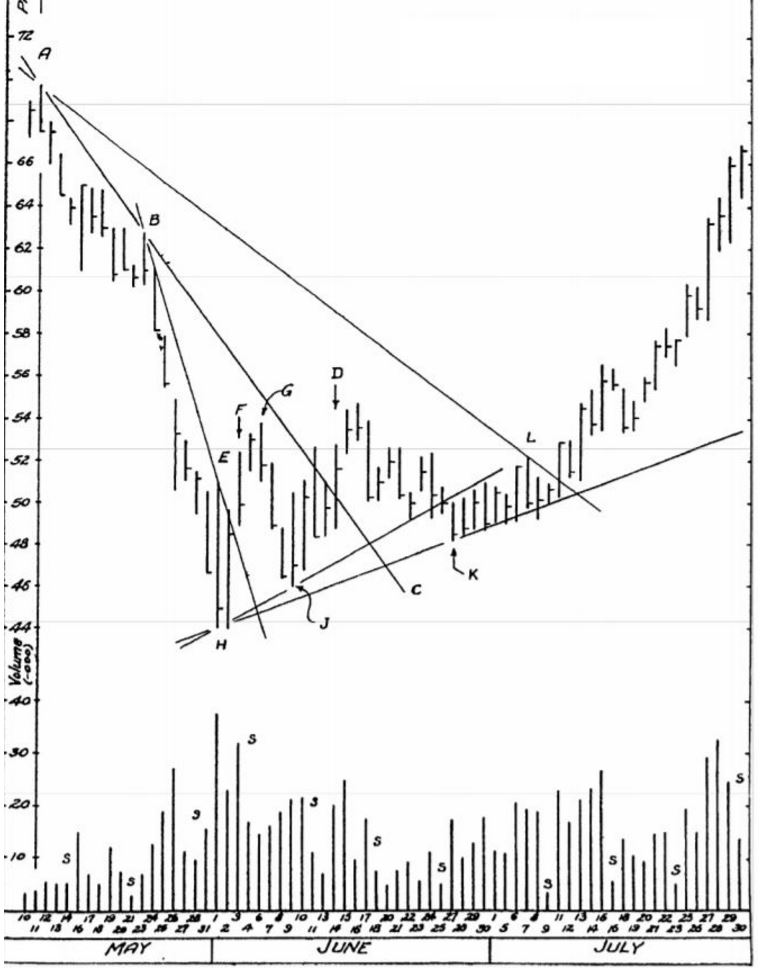
Referring next to the vertical chart of a hypothetical Cryptocurrency, Chart 10.7, observe that the decline from the May 11 high point A to the May 21 low at 60 proceeds at a downward angle whose pitch may be represented by a straight line drawn from point A to the next rally top at point B. Extending this line to point C, we find that it calls our attention to a possible change of trend when the sharp rally of June 14 penetrates this line decisively (at point D).
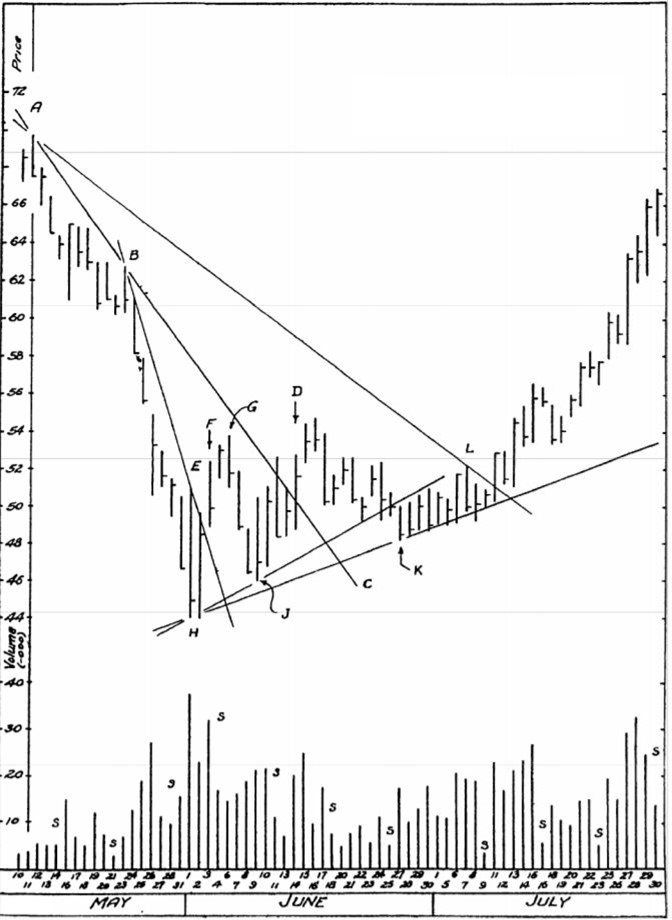
Meanwhile, observe that after leaving 62 1/2 at point B, the downward movement of the Cryptocurrency is sharply accelerated so it becomes necessary to draw a new trend supply line from points B-E to represent this change of pace. Since this new decline is pitched almost perpendicularly, we conclude that the Cryptocurrency is dropping into an oversold position. Hence, when the line is penetrated at point F by a vigorous rally on heavy volume, after the down move reaches climactic proportions on June 1, we have an indication that the force of the supply is being overcome by a superior force of demand and we may now anticipate the appearance of the customary technical rally which usually follows as a sequence of a selling climax. Note how this technical rally is checked at point G as it approaches our initial supply line A-B-C, that is, within the limits of the initial down wave angle.
As shrinking volume is a normal characteristic of the technical rebound which follows a selling climax, when the price begins to hesitate at point G in the vicinity of our supply line A-B-C, we are put on notice that this rally may be terminating. We are now prepared for the next normal sequence of events, namely, the appearance of a secondary reaction which will test the preliminary support around 44-45. This test may confirm the previous support (show that a good quality of demand exists around these levels), or it may show that support has been withdrawn. As volume remains low, or at least does not expand substantially on the anticipated secondary reaction (June 7 and 8), and as the price makes no further progress on the down side during the next two days, and since the Cryptocurrency tends to enlist increasing volume on the rallies from higher support around 47 on June 9 and 10, we have a set of indications implying that a broader base of support (accumulation) is forming: the force of demand is building up.
In the meantime, having established a tentative support line from points H to J, we note that the extension of this line is violated by the reaction on June 27 at point K. Is this a valid indication of further weakness? We are in doubt on June 27 because the volume increases somewhat sharply on the break-through. But since the increase is quite marked, we must consider whether this may prove to be a minor selling climax rather than a case of volume increasing on a decline. So, we wait for a clearer indication. There is no follow through on the down side over the next few days. Instead, the price movement narrows, recording higher tops and bottoms, and volume tends to increase on the rallies and decrease on recessions. Accordingly, we must conclude that the demand is still of better quality than the supply. Hence, when the price swings to a dead center on July 9, having held for two weeks previously well above the June lows, we conclude definitely that the violation of our tentative support line H-J should be disregarded. The action of the Cryptocurrency shows accumulating strength, thereby saying that our first support line (H-J) merely represented a temporary rate of upward acceleration which could not be sustained until more energy (force) could be stored up (i.e., more of the floating supply of the Cryptocurrency could be absorbed). This action, incidentally, again illustrates how other technical manifestations may deny the inferences which might be drawn from purely mechanical interpretation of trend lines.
After the confirmatory bullish indication is given by the rally of July 11, we establish a new trend support line H-K. Meanwhile, note that if we have drawn a readjusted trend supply line through points A and L, we are able to visualize that the lateral movement of late June has had the effect of working the price into a broad apex, defined by the intersection of the supply line A-L and the support line H-K. Thus, in swinging to a dead center on July 9, the Cryptocurrency is in a position to break away from this broad hinge position in a quick mark-up; it is stepping on the springboard ready to release the force of demand that has been accumulating in the range 44-54.
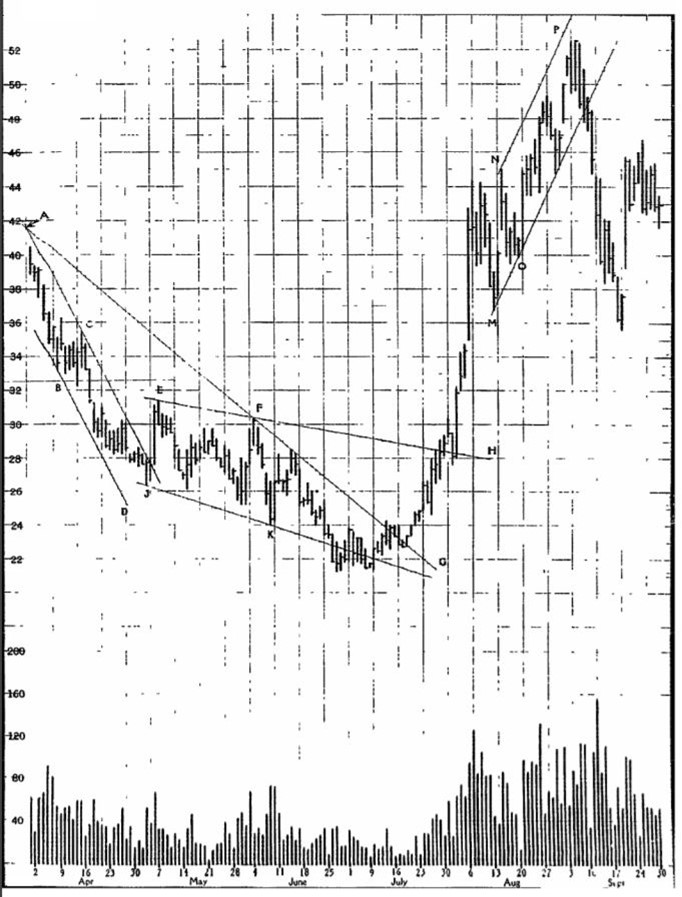
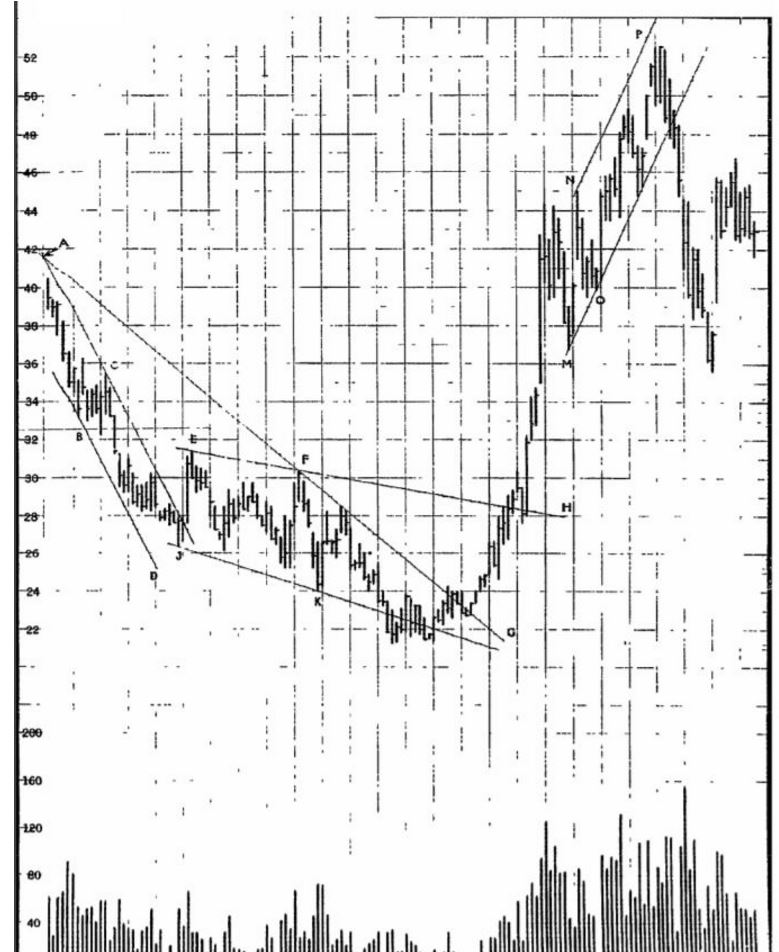
The chart of another Cryptocurrency in Chart 10.8 shows additional examples of trend lines, illustrating how price movements sometimes follow regular channels between the supply line A-C and the corresponding oversold position line B-D. The latter is located by drawing a straight line through point B parallel to line A-C. In other words, as soon as the down swing from 41 (point A) has been sufficiently developed to enable us to identify the next succeeding high point at 35 (point C), we draw the supply line A-C to mark the angle of downward acceleration. Simultaneously, we draw a second straight line B-D, parallel to A-C, taking this line through the intervening low, or temporary support, point at 34 (point B); extending this line to point D so it may thereafter indicate the points at which ensuing down swings may cause the Cryptocurrency to become oversold.
Similarly, after the support line M-O has been established, we draw a parallel through the intervening rally top at point N. For sometime thereafter, this second line (extended to the right at point P) marks the limit of subsequent up waves (i.e., the points at which the Cryptocurrency tends to become overbought). Hence the line N-P is an overbought position line.
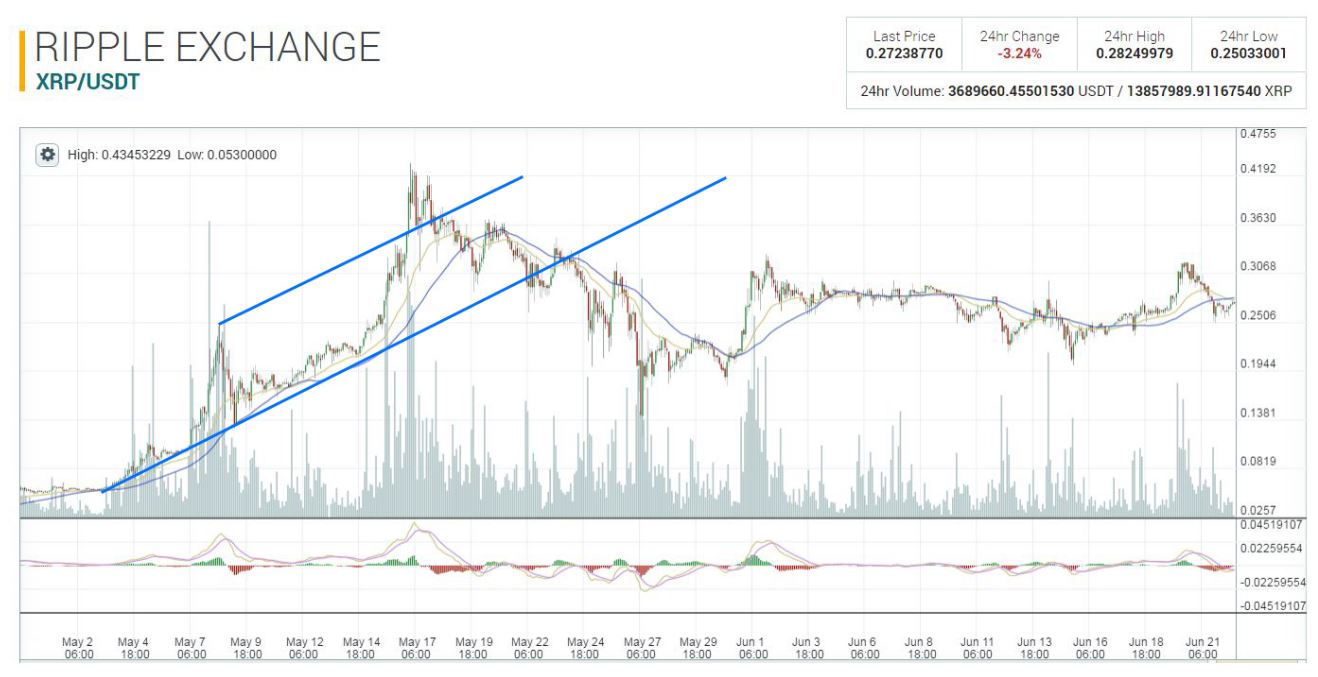
Now let’s briefly look at a vertical line chart of Ripple and see how the uptrend lines captured the uptrend. When a Cryptocurrency trades above the overbought line in an uptrend it puts the currency in a vulnerable position for a pullback or sideways action. On May 17 Ripple was trading solidly above the overbought line but then traded back into the uptrend channel. As you can see, it then penetrated the support line of the uptrend and tried to regain the uptrend channel, but on May 24 decisively broke the uptrend and put the coin into a sideways trading mode. Ripple is now preparing for its next move trading in its range of 19-31 cents.
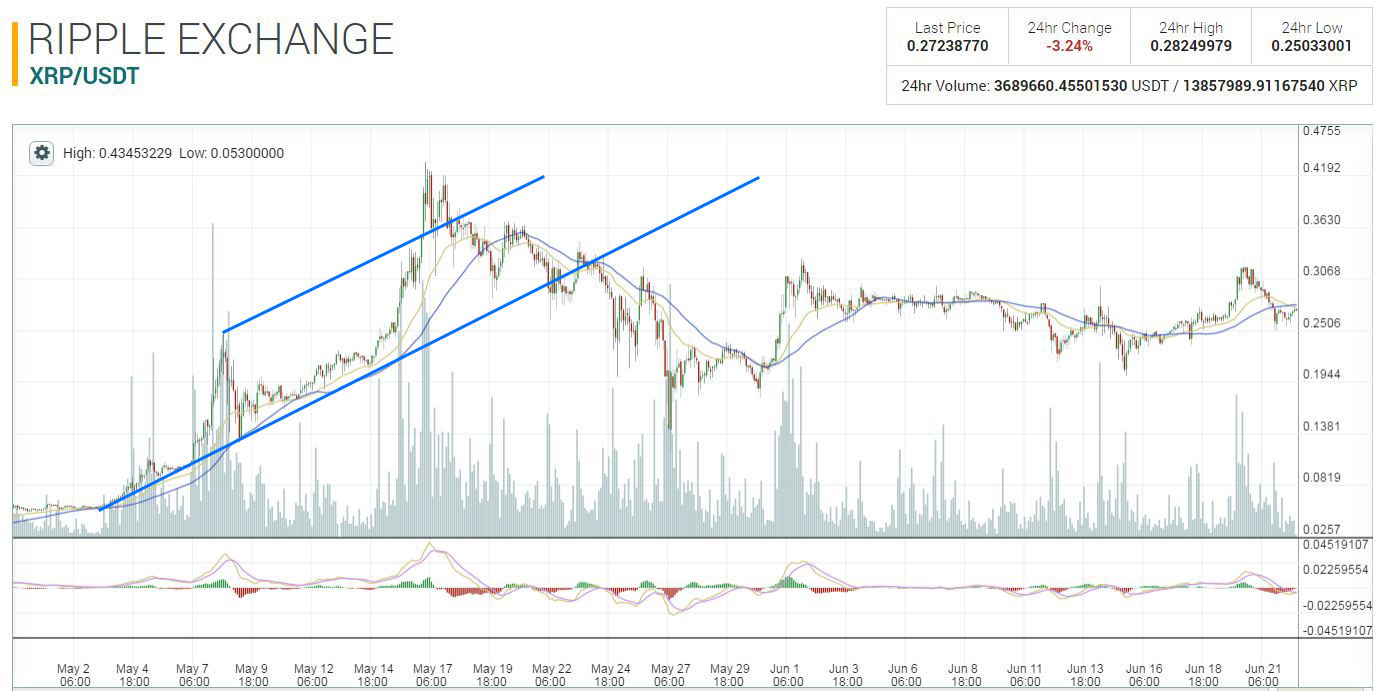 Chart 10.9
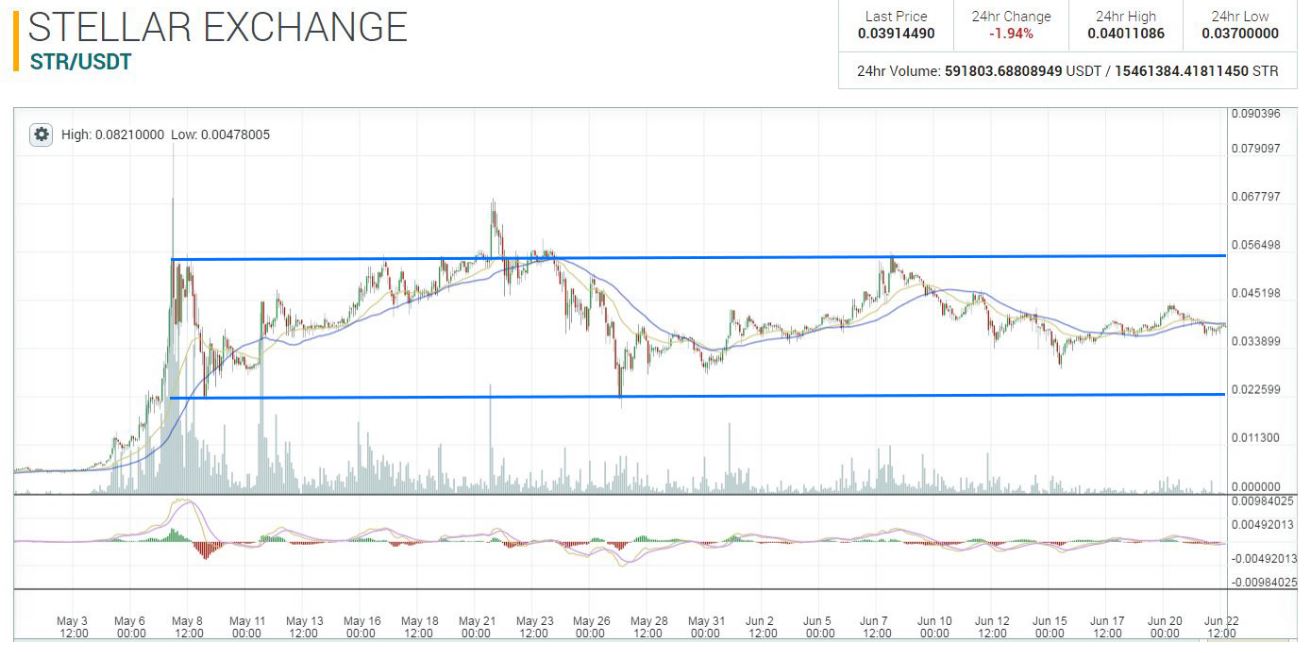
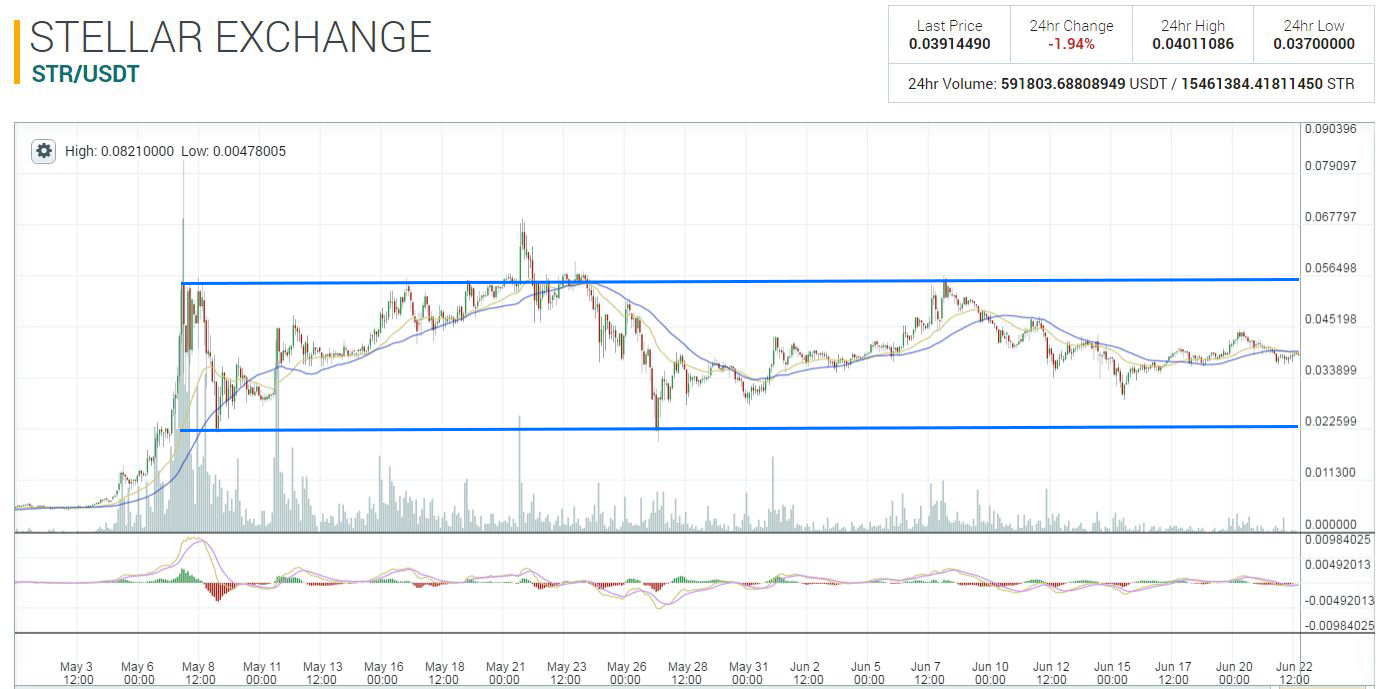
We also want to include a chart for Stellar in this lesson. Stellar has been locked in a trading range for six weeks and has experience a buying climax on May 7, an up-thrust on May 22, a spring on May 27 with its test on May 28 and 31, and now trading in a narrower range on decreasing volume. The next few weeks will be interesting…..
Here is a video discussing trendlines applied to the chart of ZEN CLICK HERE
In general, trend lines applied to major and intermediate price movements, of course, are more important than minor trend lines. Which is to say, that a decisive violation of an intermediate trend line usually implies possibilities of a relatively more extensive continuation of the move in the direction of the break-through than in cases where a minor trend line is conclusively violated. A notable exception to this presumption occurs when the Cryptocurrency has worked into a position where indications of a change in the minor trend would be likely also to signal the beginning of a new intermediate or major trend.
By studying the charts carefully, you will notice that when the price movement exhibits a tendency to stop short of, or pull away from, an established oversold or overbought position line, such action frequently conveys a strong hint of an impending change of pace or trend. However, the probable importance and extent of the implied change, as well as the validity of the indication, must be judged in the light of all other technical factors influencing the behavior of the Cryptocurrency under observation at the time the above-mentioned action is observed.
Therefore, by employing discretion with the use of trend lines, taking care to weigh all of the factors involved in a complete diagnosis of market action, you will find that trend lines can be handled intelligently and to your advantage. But their principal value is in affording you clues rather than positive indications.
Never undertake to draw conclusive deductions from trend lines alone. Let other people employ them as mechanical cure-alls if they wish. YOU are studying the correct principles of market forecasting because you do not want to be in the “sucker” class of calculating machine forecasters.
IMPORTANT POINTS
1. Accumulation is the period of preparation which supplies the momentum to a particular upward move.
2. The force of demand being overcome by supply may be shown by the tendency of the price movement to flatten out or arch over.
3. In distribution, the force of supply is such that it overcomes the force of demand.
4. The momentum of an upward movement is reflected in its angular rise.
5. The momentum of a downward movement is reflected in its angular decline.
6. Trend lines are used to visualize the momentum of various movements.
7. The threatened violation of a trend line is often an indication that the force of supply or demand which was in effect is now becoming exhausted.
8. The violation of a trend line may indicate a change in the trend.
9. The quality of buying or selling at or around the point of penetration of a trend line determines whether this is a change in the trend or merely a temporary penetration.
10. Every congestion area need not be an area of accumulation or distribution, for it may merely be a trading range.
11. Trend Lines –
Support line: identifies the angle of advance by passing through two successive points of support.
Supply line: identifies the angle of decline by passing through two successive points of resistance.
Oversold Position Line: a line parallel to a supply line through an intervening support point.
Overbought Position Line: a line parallel to a support line through an intervening supply point.
12. Trend lines give possible indications as to where support or supply may be expected to enter as an opposing force.
13. Shrinking volume is a normal characteristic of a technical rebound following a selling climax.
14. Do not interpret trend lines mechanically. Don’t use them alone.
15. Intermediate and major trend lines are more important than minor trend lines.