
 Loading…
IMPORTANT POINTS
1. Deduction is the technique of reasoning proceeding from a general statement to the specific case. Induction. is reasoning from the specific case to a general statement.
2. You have learned to deduce the bullish or bearish nature of individual stock issues by:
a. determining the position and trend of the market
b. determining the position and trend of the various groups, and
c. formulating conclusions concerning the particular issues.
3. You may also induce the position and trend of the market by:
a. determining the position and trend of the particular stocks
b. using ‘a’ to determine the position and trend of each of the various groups
c. using ‘a’ and ‘b’ to determine the position and trend of the market.
4. The Position Sheet should be used with the inductive method in analysis of the market.
5. The Position Sheet is a valuable tool in:
a. determining the position and probable future trend of various groups
b. selecting the best individual issues
c. judging the turning points of individual issues
d. analyzing the trend of groups
e. studying the trend of the market.
6. Stocks are either bullish, bearish, or in a neutral position at any given time.
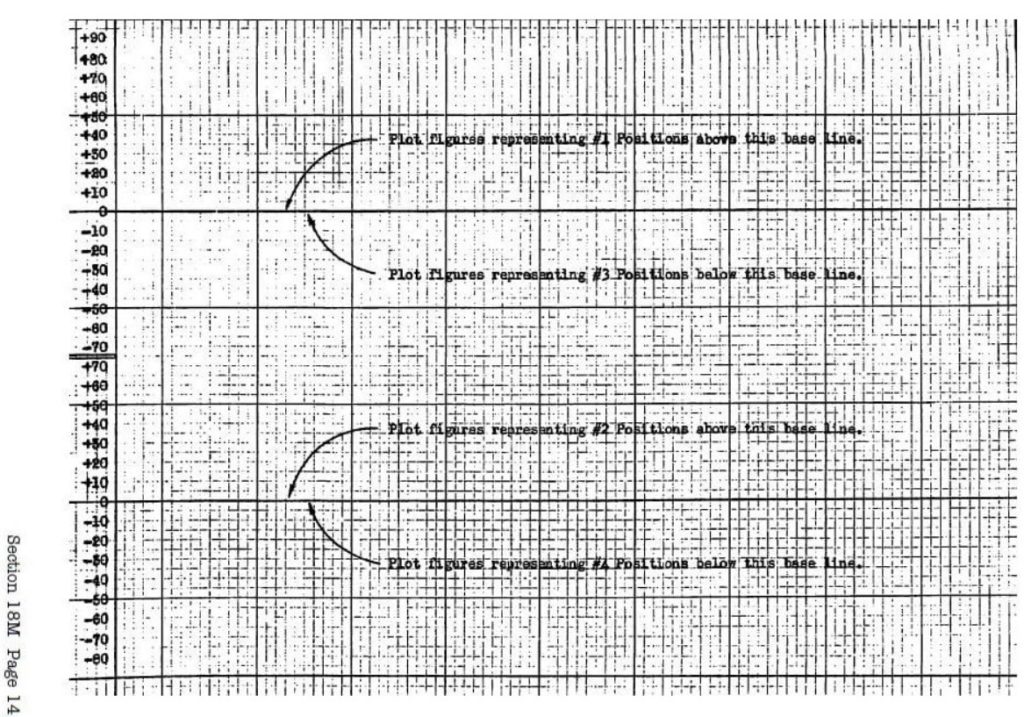
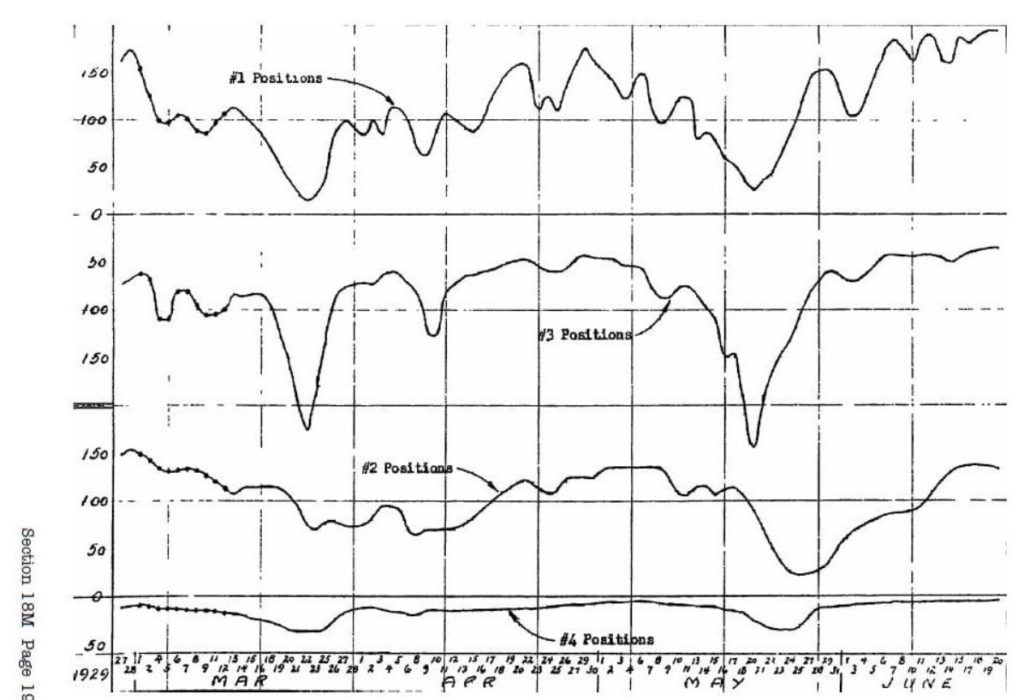
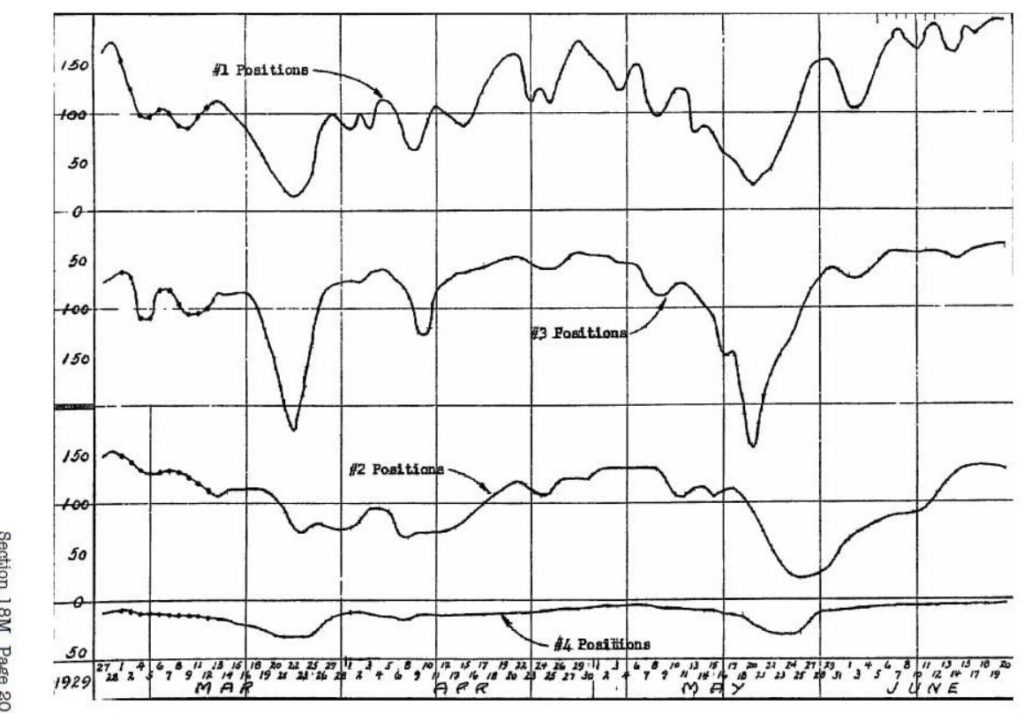
7. The five market positions are:
a. Position 1: Minor up-trend
b. Position 2: Intermediate up-trend c. Position 3: Minor down-trend d. Position 4: Intermediate down-trend
e. Neutral.
8. The percentage method is used in determining the position of stocks.
9. A stock can not be in Positions 2 and 4 or Positions 1 and 3 simultaneously.
10. Positions 2 and 4 are the two positions most important to us.
11. Purchases should be made at the bottom of reactions – and sales at the top of rallies. Positions 1 and 3 are valuable aids in the proper timing of such moves.
12. Determine the trend of the market in the ‘Summary’ section of the Position Sheet.
13. Consult the Position Sheet for determining which issues are the most advantageous for a commitment.
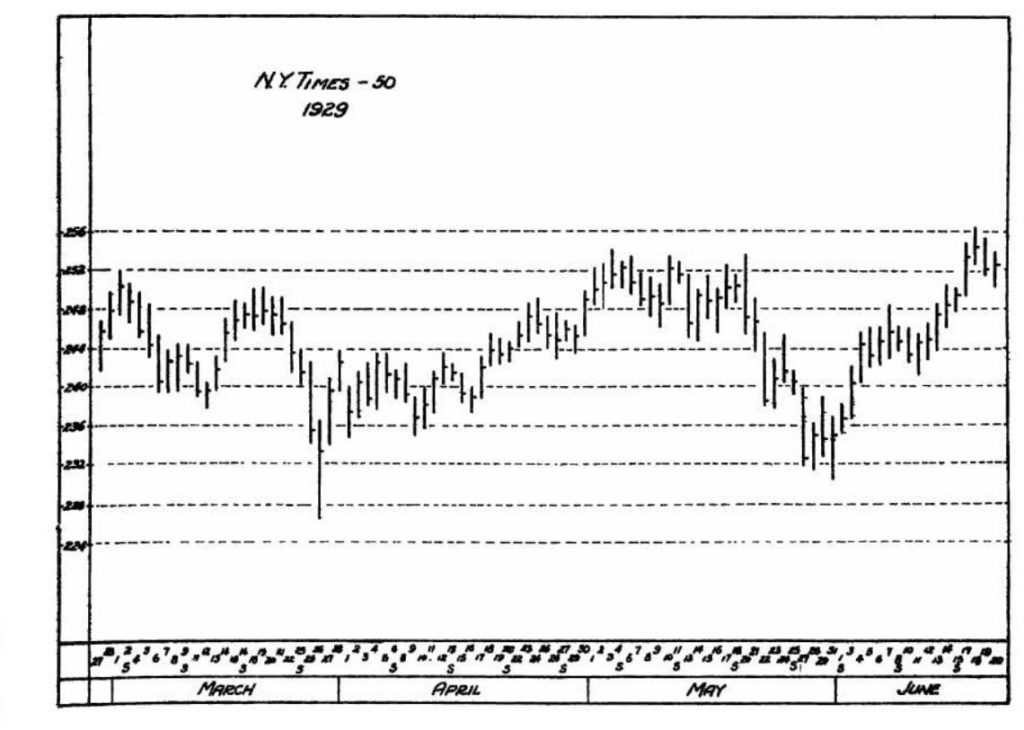
14. Use the Wyckoff Wave for the accurate timing of commitment.
15. The Technical Position Barometer is a graphic portrayal of the changing daily positions of the issues on your Position Sheet.