The Wave Chart – 22M
 Loading…
IMPORTANT POINTS
1. Determine the market’s general trend-then utilize effective, workable tools to analyze that trend.
2. The trend is the line of least resistance.
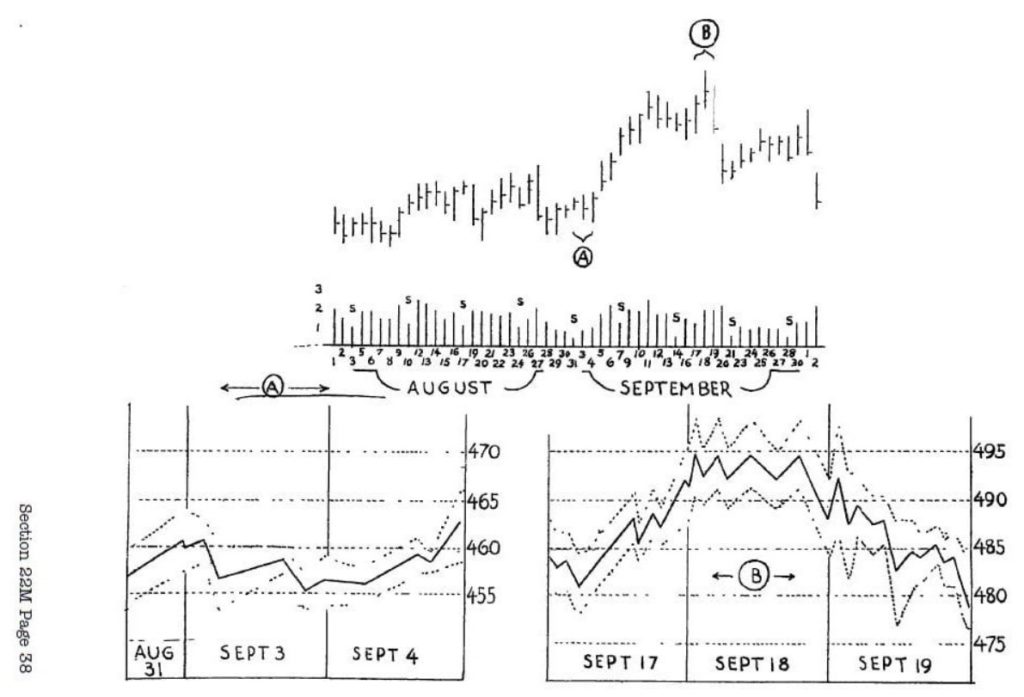
3. The profit-risk ratio should be at least 3:1 before you make a commitment.
4. The Stock Market Institute’s model of the market is the Wyckoff Wave, which consists of twelve leading stocks.
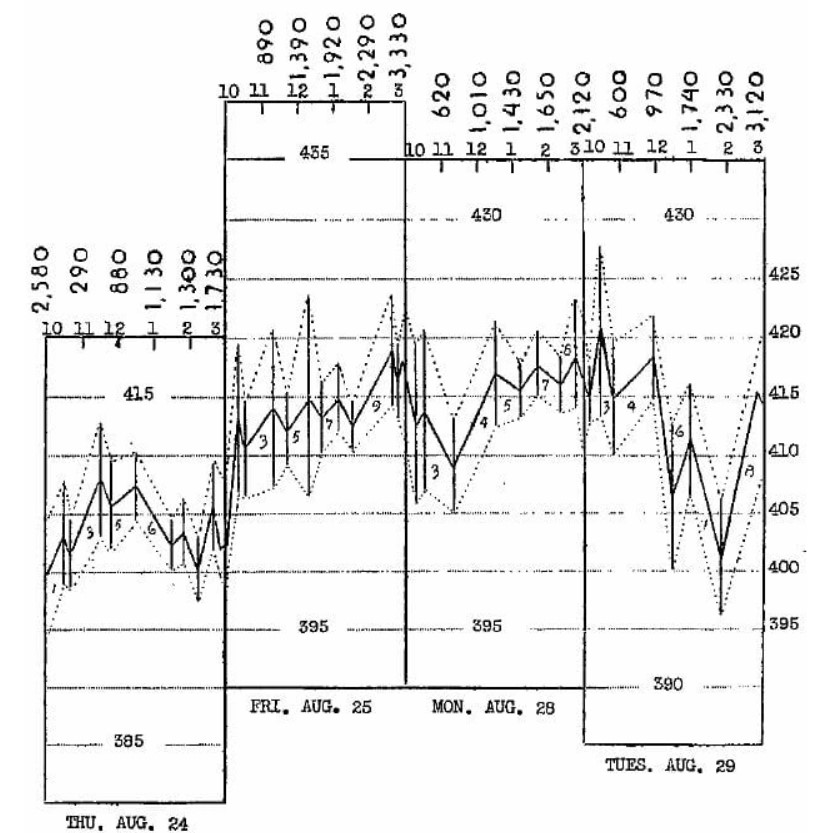
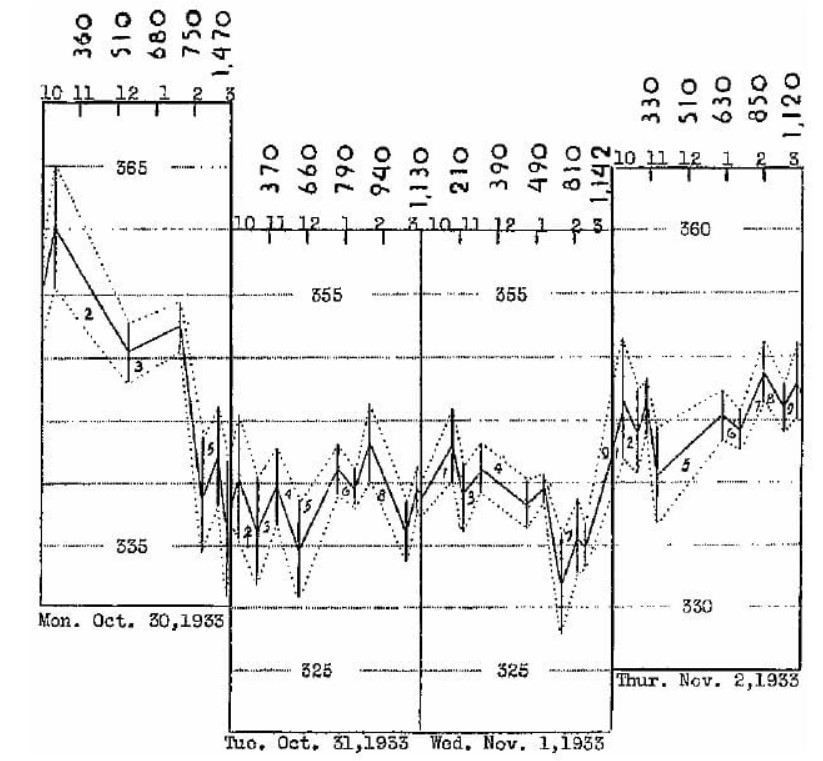
5. The Intra-Day Wave Chart is the primary tool for analyzing the smallest important market phenomena .
6. Speculative interest is reflected by the activity.
7. All moves in the stock market have their beginnings with the smallest waves.
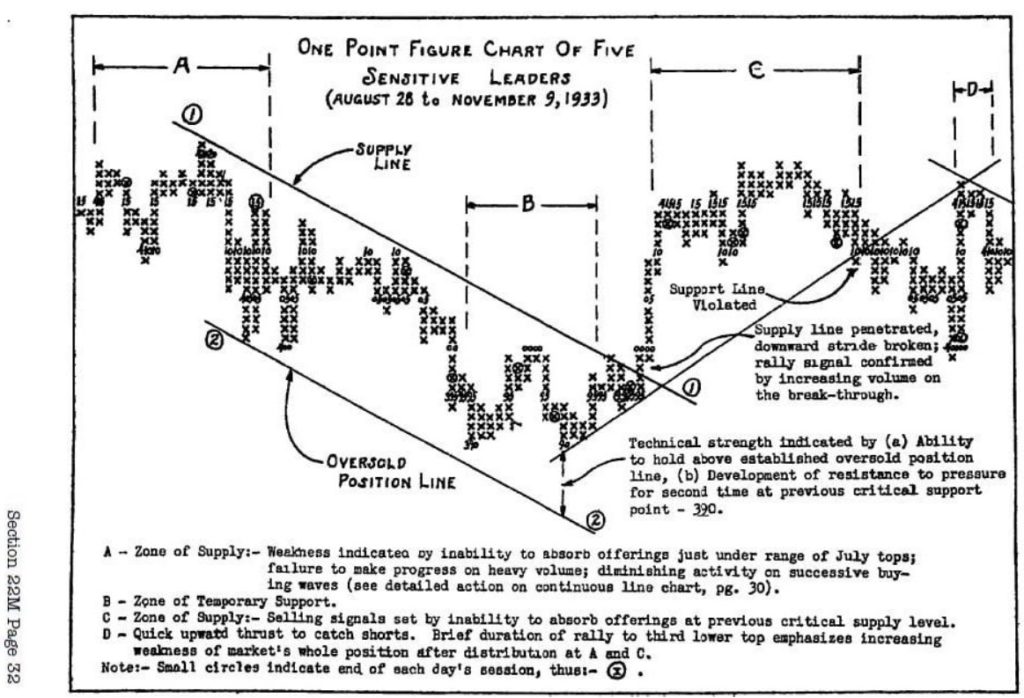
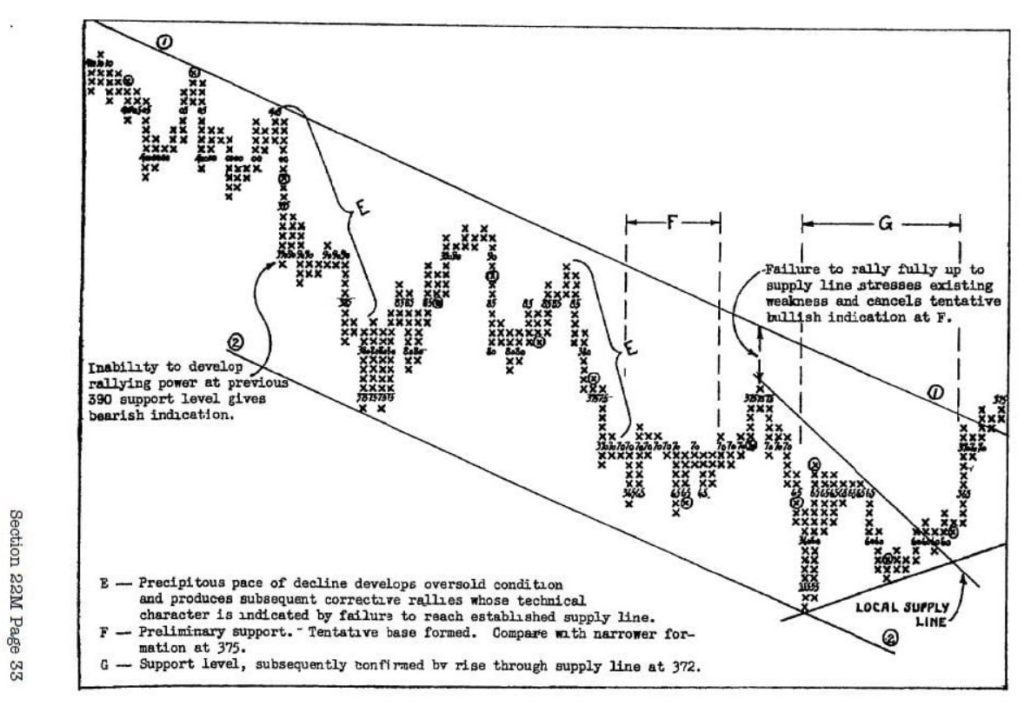
8. Appraisal of the changes in the balance of power of the shortest term professional element must be made.
9. Generally, increasing persistency characterizes the early stages of a trend; and reduced endurance is typical of the termination of a trend.
10. The same techniques used in analyzing vertical charts are applicable to the Intra-Day Wave Chart.
11. Tools used in analyzing the market are: the Wyckoff Wave, the Intra-Day Wave Chart, and the figure charts of the Wyckoff Wave.

