📈 Wyckoff SMI “Week In Review” March 22nd, 2026.

📋 Market ScoreCard
General Market Condition: Corrective / Risk-Off
Wyckoff Bias: Distribution / Markdown pressure in major indexes
Trend Structure: Weakening leadership, broad deterioration under resistance
Technometer Condition: Cooling, but not yet washed out in equities
Weight of Evidence: Negative near-term, selective strength in energy only
Tactical Stance: Defensive, patient, highly selective
🌍 Macro Market Backdrop
This week’s market tone remained defensive as the major indexes continued to lose structural integrity beneath prior resistance zones. The broad message from the tape is that rallies are failing to gain sponsorship, while downside breaks are beginning to expand with better follow-through. The market is no longer acting like a healthy reaccumulation environment. Instead, it is showing more signs of distributional pressure and selective liquidation.
At the same time, interest-rate behavior remains a headwind rather than a cushion. Long-duration bonds continue to weaken, which keeps pressure on equity valuations and reinforces a more cautious macro backdrop. Hard assets were unable to provide clean relief this week either, as gold miners saw sharp selling after a climactic advance. The one standout remains energy, where persistent relative strength continues to separate it from the rest of the market.
Crypto remains in a damaged but potentially more mature corrective state than equities. Both Bitcoin and Ethereum are still under overhead resistance, but their Technometer readings are now much closer to levels where a more important low can begin to develop.
🧭 Market Overview (SPY / QQQ)
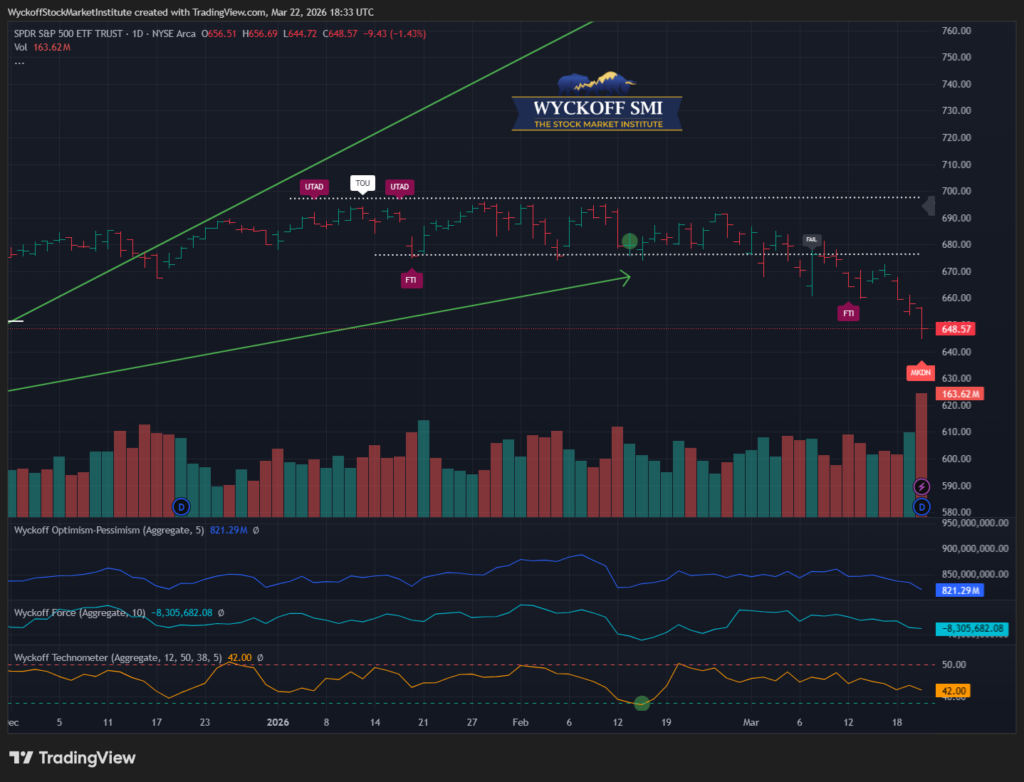
SPY continued to weaken this week and is now pressing toward the lower end of its recent structure after repeated failures beneath overhead resistance. The chart shows a distributional tone, with prior UTAD / TOU behavior near the highs followed by breakdown characteristics that have now transitioned into FTI / MKDN type action. The inability to reclaim the mid-range after the February low was important. That rebound lacked true sponsorship and has now given way to renewed supply.
The Wyckoff message is straightforward: price has been unable to absorb supply at the upper boundary, and support tests have not produced durable follow-through. Optimism-Pessimism has been rolling over, Force remains weak, and the Technometer at roughly 42 is softer but not yet at the kind of extreme that typically signals a durable low. This suggests the decline may be getting older, but it may not yet be complete.
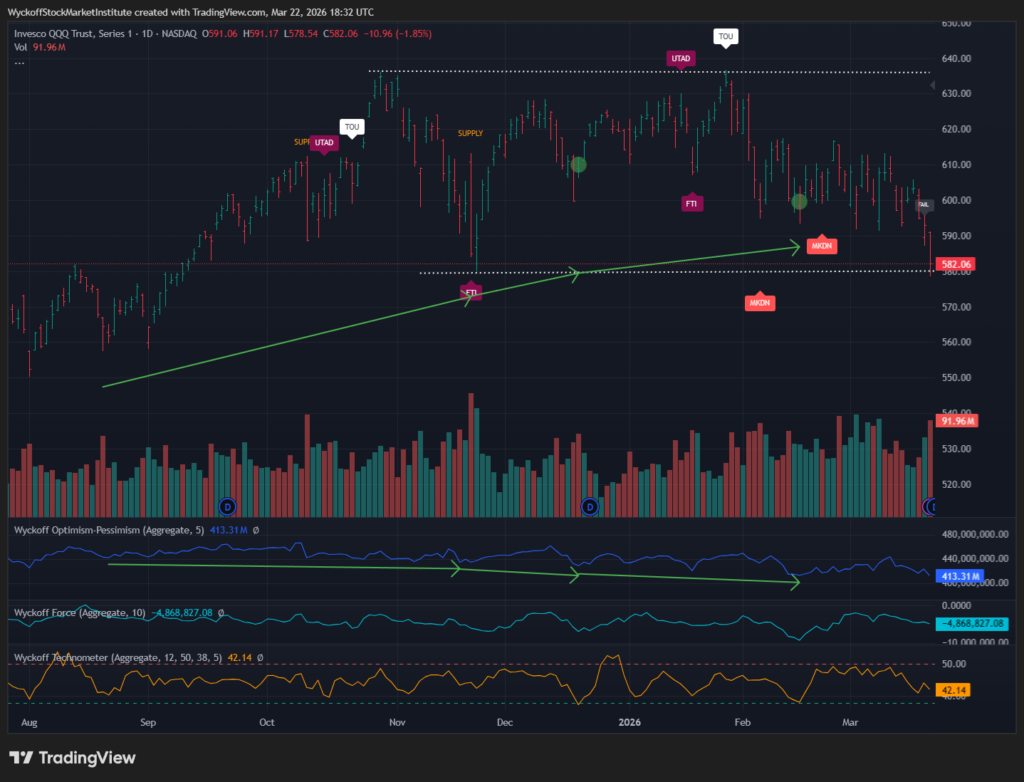
QQQ remains structurally weaker than a healthy leader should. It has shown repeated signs of distribution, including multiple overhead failures and a clear inability to sustain rallies back toward resistance. The chart reflects a similar story to SPY, but with even more visible rejection near the upper boundary. Recent action shows breakdown pressure expanding, with FTI / MKDN behavior confirming that demand has not yet regained control.
The important takeaway is that the Nasdaq has not been able to reassert leadership despite several opportunities to do so. That keeps the burden of proof on the bulls. Optimism-Pessimism continues to drift lower, and the Technometer near 42 again suggests a market that is weakening but not yet fully exhausted. Until QQQ can reclaim broken support and show a true sign of demand, rallies should be treated cautiously.
🏦 Interest Rates & Defensive Assets (TLT)
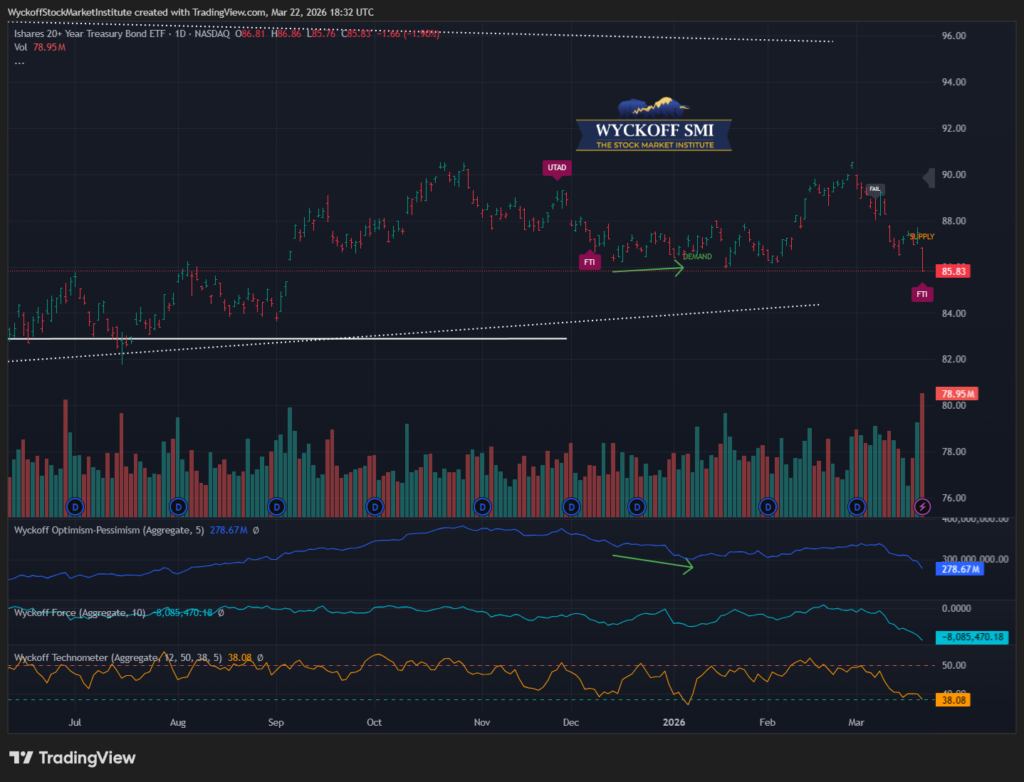
TLT weakened again this week, reinforcing the idea that the bond market is not yet providing a defensive tailwind to equities. Structurally, the ETF appears to have failed after a rally attempt, with prior UTAD behavior followed by renewed weakness and another FTI type break lower. Recent price action shows that each rebound has been increasingly vulnerable to supply, and the market is now sliding back toward the lower end of its range.
This matters because a weak TLT backdrop often keeps pressure on risk assets. Falling bonds imply rising yields or persistent rate stress, and that tends to weigh on equity multiples while reducing the attractiveness of duration-sensitive leadership groups. The Technometer near 38 is getting closer to a more meaningful oversold condition, so bonds may be approaching an area where a reflex rally can occur. But as of now, the tape still says defensive money has not fully embraced long-duration Treasuries.
⛏️ Gold / Hard Assets (GDX)
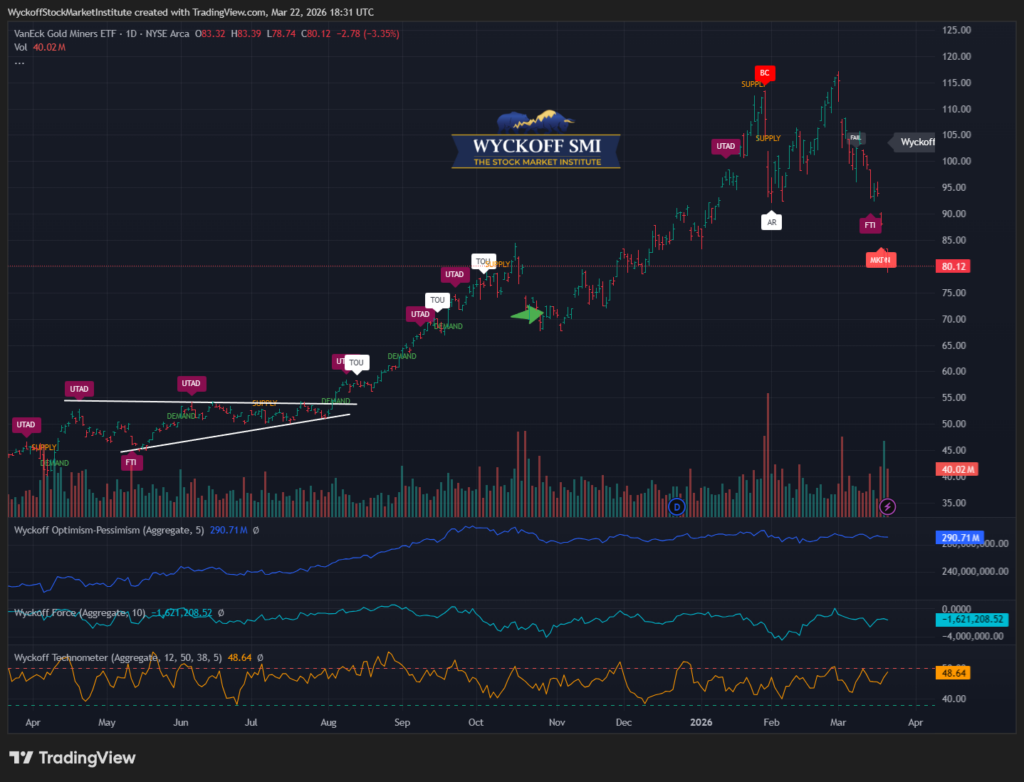
GDX suffered a sharp reversal this week after an extended advance, reminding traders how quickly climactic leadership can transition into reaction. The miners had been acting very well for months, but the recent structure now carries clear signs of supply entering after a mature markup. The chart shows prior buying climaxes and upthrust-type behavior at higher levels, followed by a much more aggressive decline that now looks like FTI / MKDN style weakness.
This does not necessarily mean the longer-term case for gold-related assets is broken, but it does mean the group is undergoing a corrective event that should be respected. The Technometer remains elevated relative to true washout conditions, near 48.6, which suggests GDX may still need more time or price damage before a cleaner low-risk setup emerges. In Wyckoff terms, this looks more like a reaction after a powerful campaign than an immediate new buying opportunity. The next objective is to see whether the decline becomes controlled and constructive, or whether supply expands further.
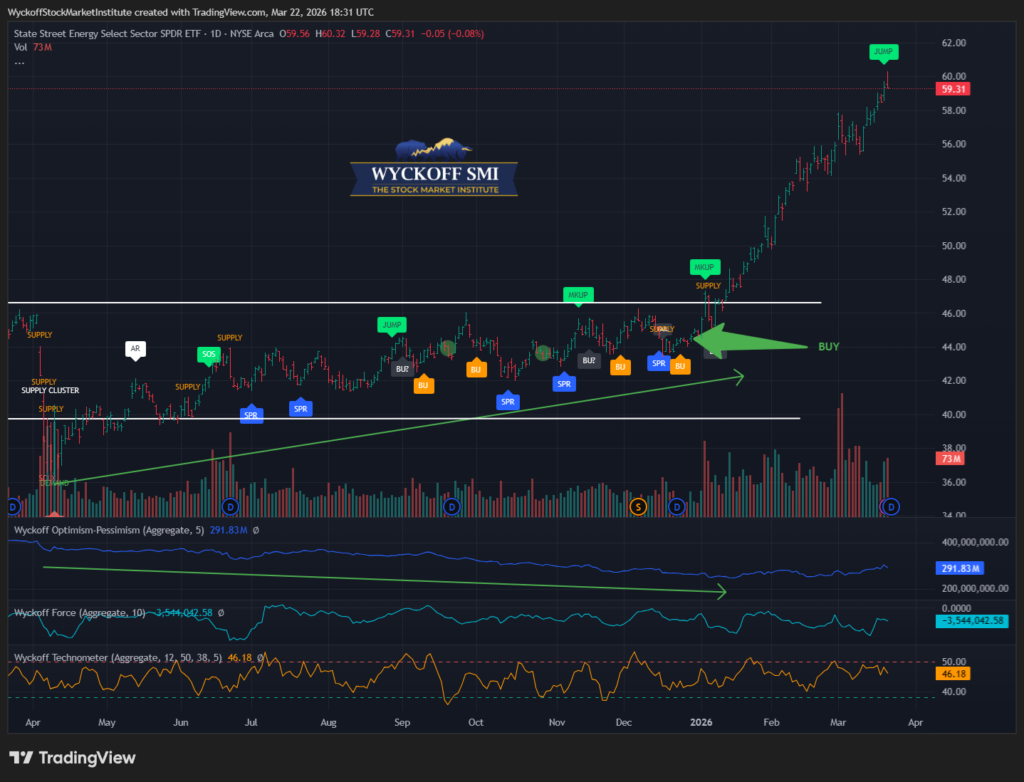
⚡ Energy Sector (XLE)
XLE remains the strongest major theme on the board. While most of the market has been struggling with failed rallies and breakdown pressure, energy continues to show classic outperformance. The chart reflects a strong campaign already in force: multiple support events were followed by SOS / JUMP / BU / SPR behavior, and most recently the ETF has pushed into a clean markup phase with a fresh JUMP through resistance.
This is exactly the kind of relative strength profile traders want to see in a difficult tape. The sector is holding above prior resistance, the campaign structure remains intact, and pullbacks have been shallow relative to the broader market. Technometer around 46 is firm but not yet stretched to an obvious blowoff condition. Unless the sector quickly fails back under the breakout area, energy remains one of the few places where institutional sponsorship is still clearly visible. For now, XLE continues to act like leadership, not laggard capital.
₿ Crypto Market Overview (BTC / ETH)
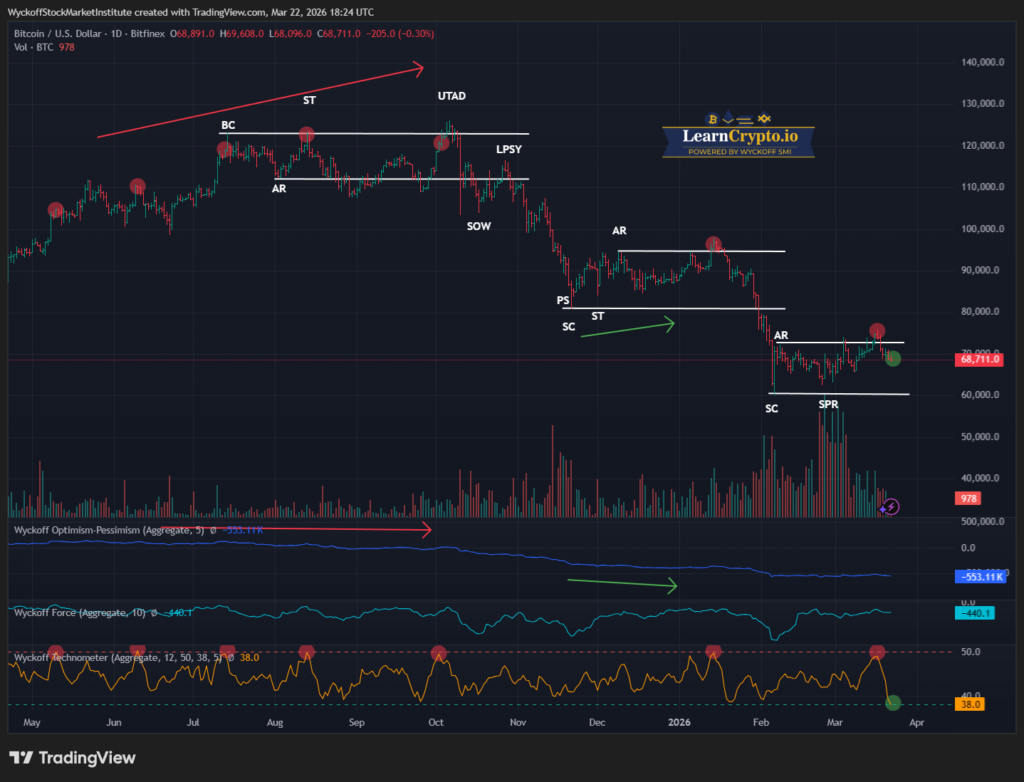
Bitcoin remains in a corrective structure, but there are signs that the decline is becoming more mature. The larger chart still reflects prior distribution and markdown, with an earlier UTAD / LPSY / SOW sequence leading into the major decline. More recently, BTC has begun to stabilize after a selling climax and spring-type action in the lower range. The current structure looks like a developing base attempt rather than a completed bullish reversal.
What makes Bitcoin more interesting here is the condition of the internal indicators. Optimism-Pessimism has been weak for some time, but the Technometer is now sitting around 38, which is to level where meaningful lows often begin to form. That does not guarantee an immediate advance, but it does suggest downside reward-to-risk is no longer as poor as it was earlier in the decline. Bitcoin still needs to prove itself with stronger rally quality and better demand signatures, but it is getting closer to a spot where patient accumulation logic can begin to make sense.
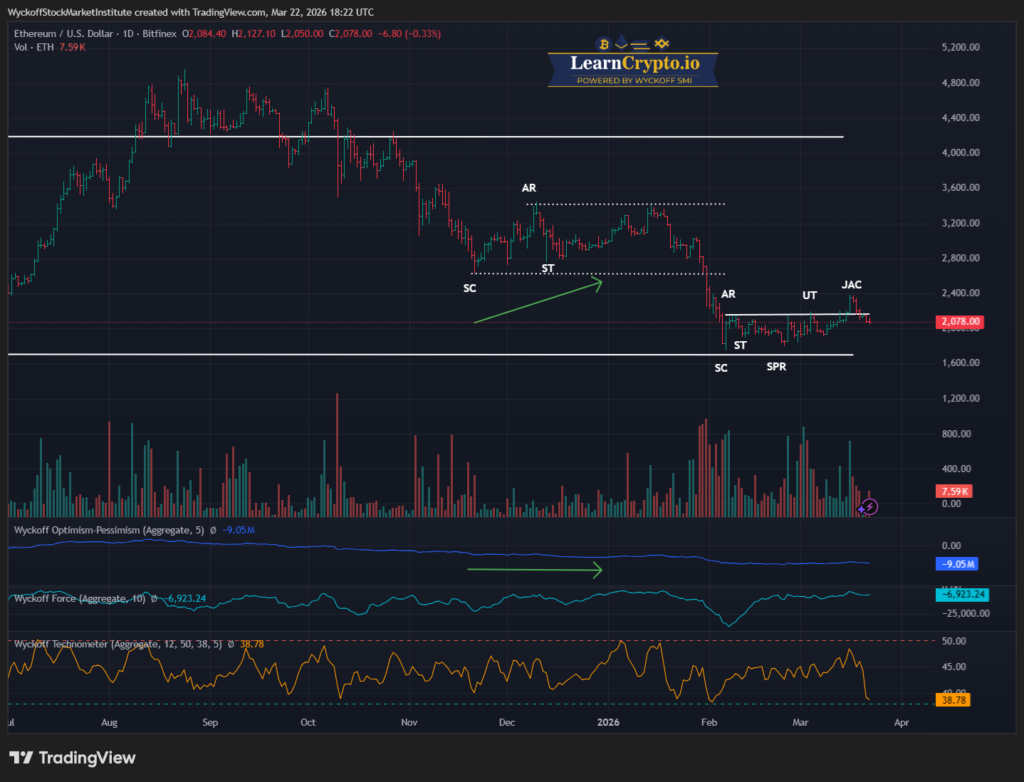
Ethereum remains weaker structurally than Bitcoin. The chart shows a prolonged decline from higher levels, followed by a recent stabilization attempt after a clear selling climax and spring-type event. Price has managed to hold above the lows, but it has not yet demonstrated true leadership or a convincing change of character. The recent rally attempt into the UT / JAC zone has not yet produced the kind of decisive follow-through needed to confirm a new bullish campaign.
That said, ETH is also nearing an important technical condition. The Technometer is around 38.8, which puts it near the lower threshold where important lows can begin to develop. In Wyckoff terms, Ethereum may be transitioning from pure markdown into a repair phase, but it has not yet proven that the repair is complete. Traders should respect the possibility of a base-building process here, while also recognizing that overhead resistance remains significant.
🔄 Rotational & Thematic Notes
The dominant theme right now is selectivity. This is not a broad market tape where leadership is expanding across sectors. Instead, leadership is narrow and concentrated, while many former growth areas continue to deteriorate.
Energy remains the clearest relative-strength pocket and continues to attract sponsorship.
Equities broadly remain under distributional pressure, especially in the major growth indexes.
Bonds are not yet providing a clean defensive countertrend benefit.
Gold miners have shifted from momentum leadership into correction.
Crypto is not yet strong, but it is getting closer to areas where downside may become less efficient and more rotational opportunities may begin to appear.
Thematic leadership is therefore moving away from broad risk appetite and toward isolated strength. That is an environment where stock picking and sector selection matter far more than index exposure.
🧠 Tactical Outlook
The tactical outlook remains cautious. The broader equity market still looks vulnerable to additional downside probing, particularly because the major indexes have not yet reached obvious exhaustion conditions on the Technometer. That means traders should remain disciplined and resist the urge to aggressively bottom-fish broad market weakness too early.
At the same time, this is not a tape that requires blanket bearishness everywhere. The key is to separate weak areas from strong ones. Energy continues to deserve attention on pullbacks or controlled pauses, while crypto is beginning to move onto the watchlist for a possible later-stage low development. Gold miners likely need more repair before becoming attractive again, and bonds are not yet offering a convincing defensive reversal.
For now, the best tactical posture is patience, selectivity, and respect for trend structure. The market is offering opportunities, but mostly in specific pockets rather than across the board.
🎯 ProTraders CTA
Markets are no longer rewarding passive participation — they are rewarding precision, timing, and structure.
Right now, we are seeing:
- Distribution and breakdown behavior in the major indexes
- Persistent leadership in select sectors like energy
- Emerging opportunity developing beneath the surface in crypto
This is exactly the type of environment where the Wyckoff Method separates professionals from the crowd.
Inside WyckoffSMI ProTraders, we are:
- Identifying institutional accumulation and distribution in real-time
- Tracking sector rotation before it becomes obvious
- Providing high-probability campaign setups using our proprietary tools
- Using the Wyckoff Technometer to time market turns with precision
If you’re serious about understanding what the market is actually doing — not what the headlines say — this is where you need to be.
👉 Join WyckoffSMI ProTraders and trade alongside a professional Wyckoff framework:
WyckoffSMI.com

⚠️ Disclaimer
This report is for educational and informational purposes only and reflects interpretation of market behavior using the Wyckoff Method. It is not investment advice or a recommendation to buy or sell any security or cryptocurrency. Trading and investing involve risk, and past performance is not indicative of future results. Individuals should conduct their own analysis and consult a qualified financial professional before making investment decisions.


Responses