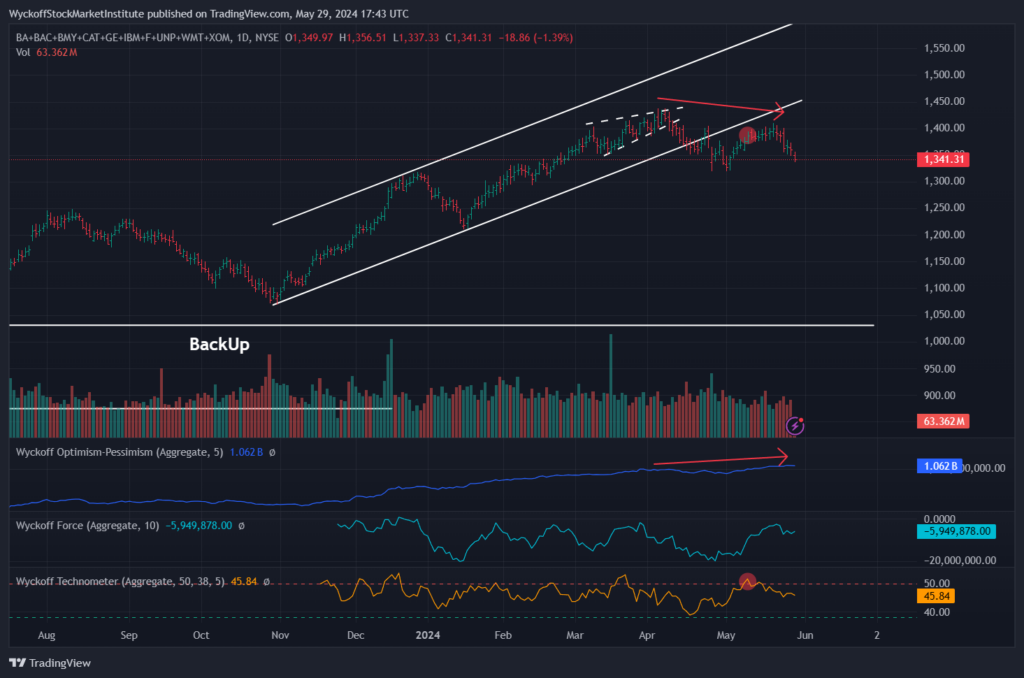
Our Wyckoff Wave chart, which we use for general stock market direction does not look constructive here. We had new highs in our OP Indicator which measures volume, while price did not. Also an overbought Technometer as shown with red dots, and fell out of uptrend.
Responses