The Wyckoff Wave slow grind higher….
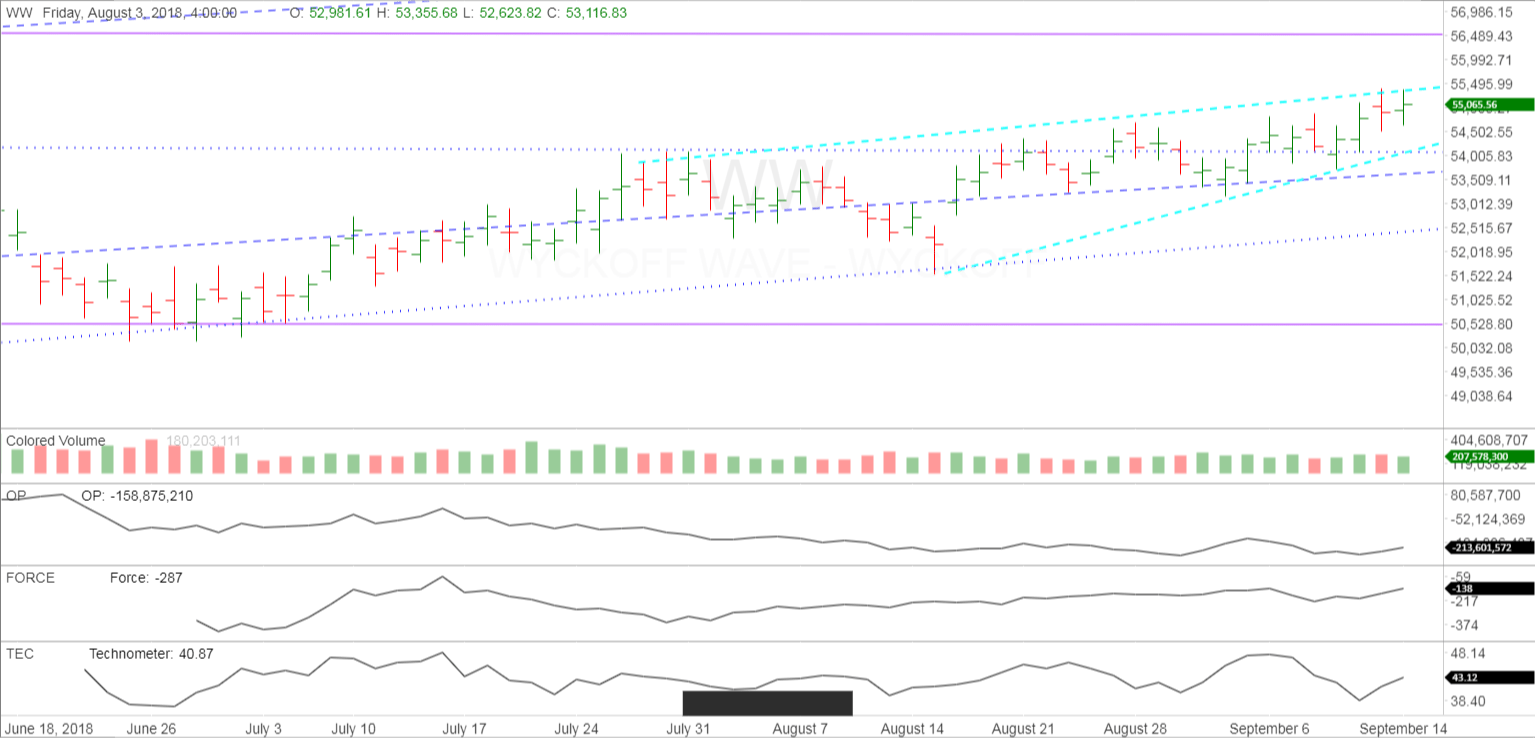
The Wyckoff Wave traded higher for the week once again. We slowly are approaching the top of the recent trading range shown by the purple lines. Volume decreasing on the rally.
The O-P continues to trade basically sideways without supporting the rally in the Wyckoff Wave.
The Force Index was up for the week.
The Technometer became oversold on Wednesday’s low, and now quickly back to a neutral reading.
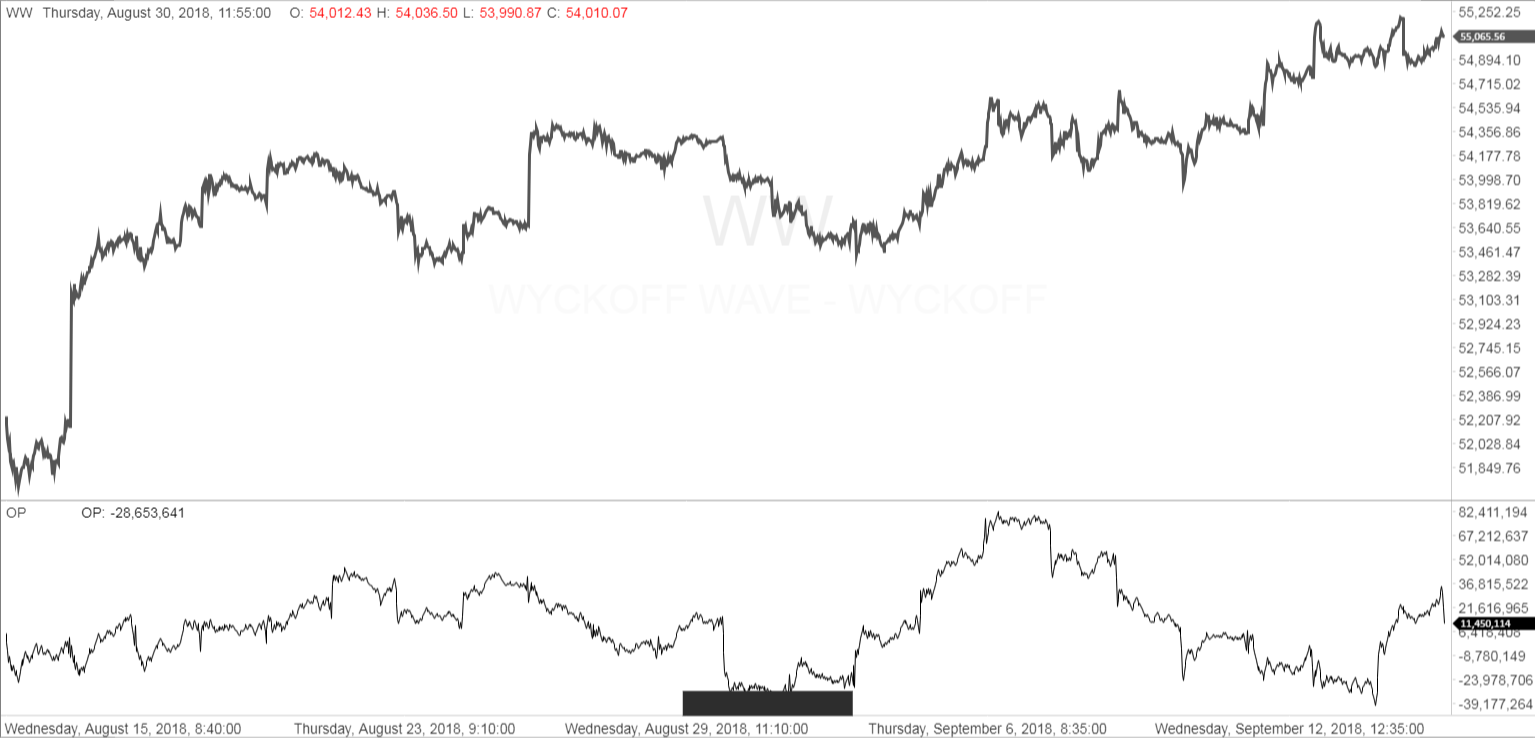
The intraday chart for last week still shows the OP not wanting to respond to the upside. This still seems troublesome for the rally. The OP will need to expand to the upside with good volume to get the Wyckof Wave to rally stronger to the upside.
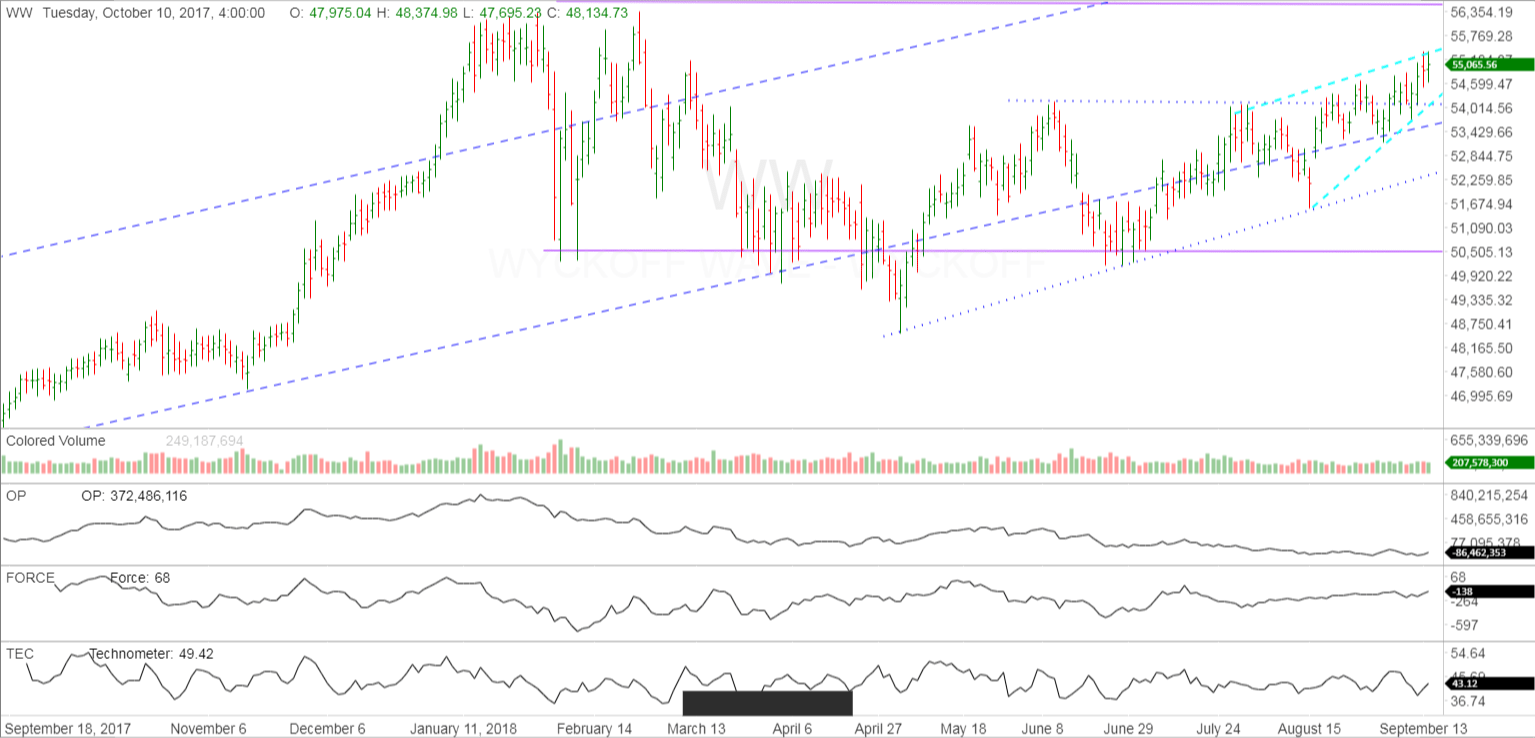
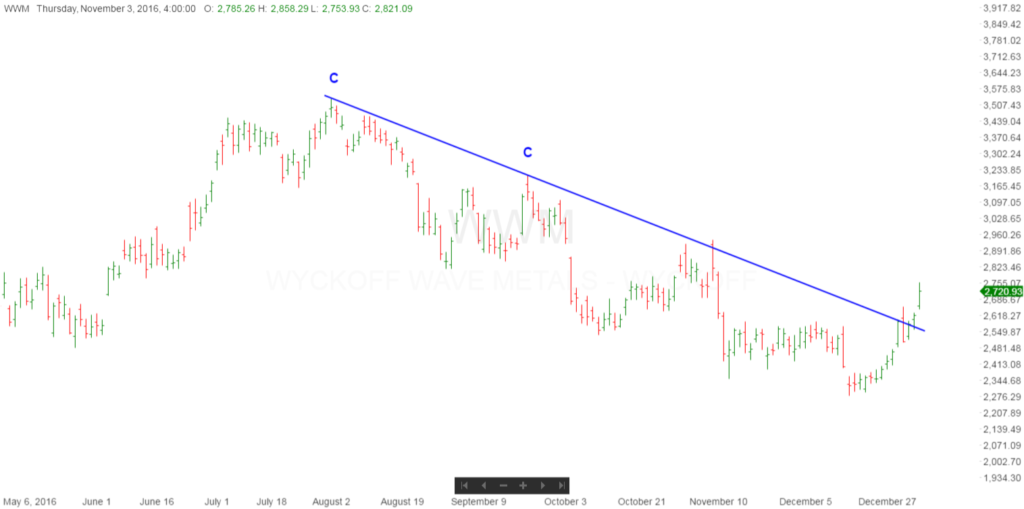
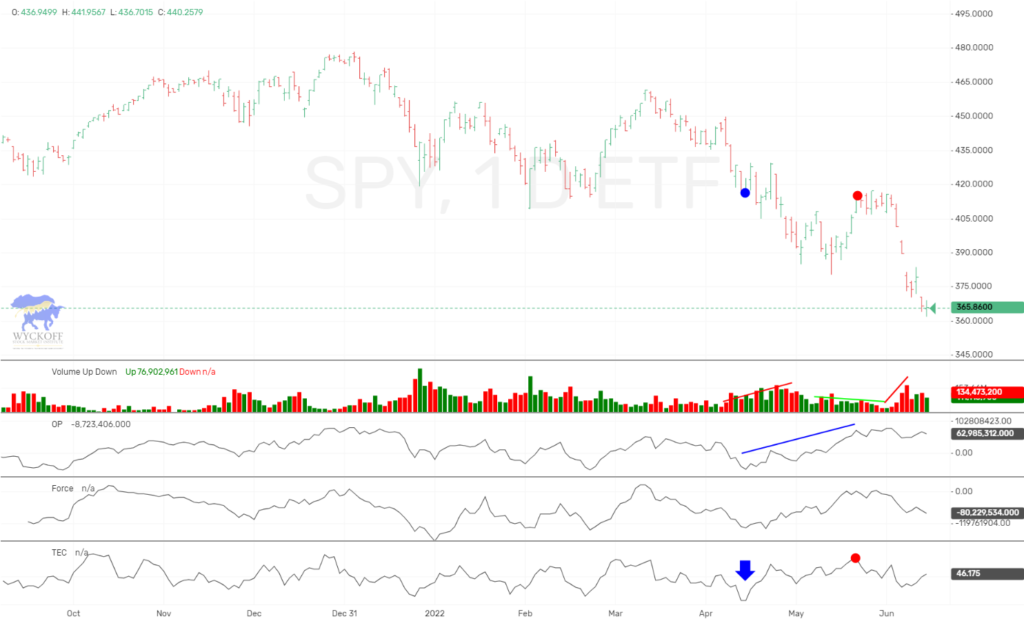
The one year daily chart shows the Wyckoff Wave trading in an uptrend on an intermediate term basis, but losing the stride of the uptrend. We are trying to test the upper boundaries of the recent purple trading range, and with volume so lethargic you would think it will be only a test, and then followed by more range bound trade.
This past week we continued to try and overcome the resistance that had held us back around the 54,500-54,700 level. The Technometer becoming oversold Wednesday which gave us a chance to keep the rally alive. With the overlapping rally as shown by the light blue wedge, it would seem that we will not accelerate higher here.
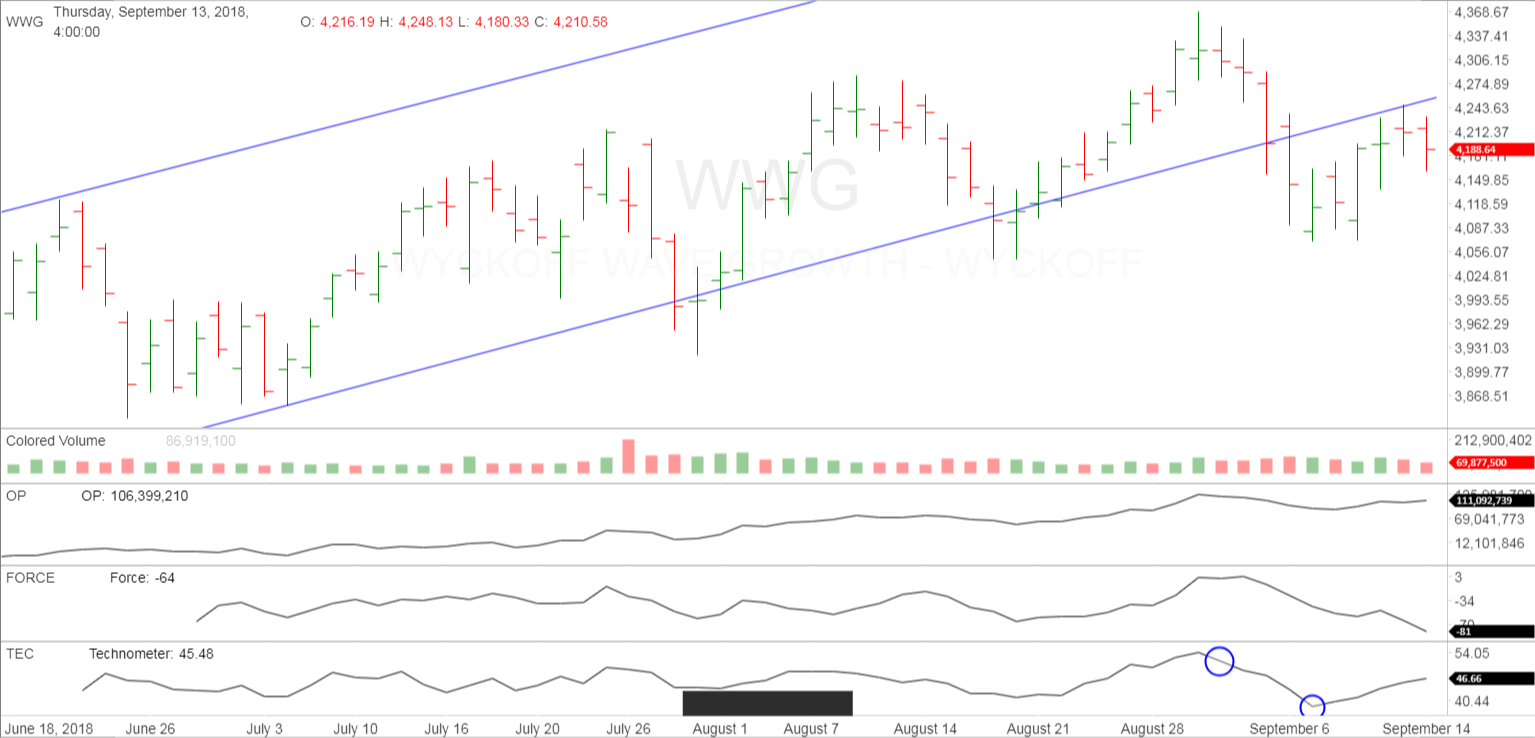
The Wyckoff Wave Growth Index (WWG) traded higher for the week as expected. We had expected WWG to correct its recent decline before continuing lower. This rally could be over with last week action, and the downtrend could now continue.
It has now broken its recent uptrend, and tested the downside break.
The Technometer is nearing overbought once again, and will easily do so on any slight rally this week.
Continue to hold shorts and trail stops.
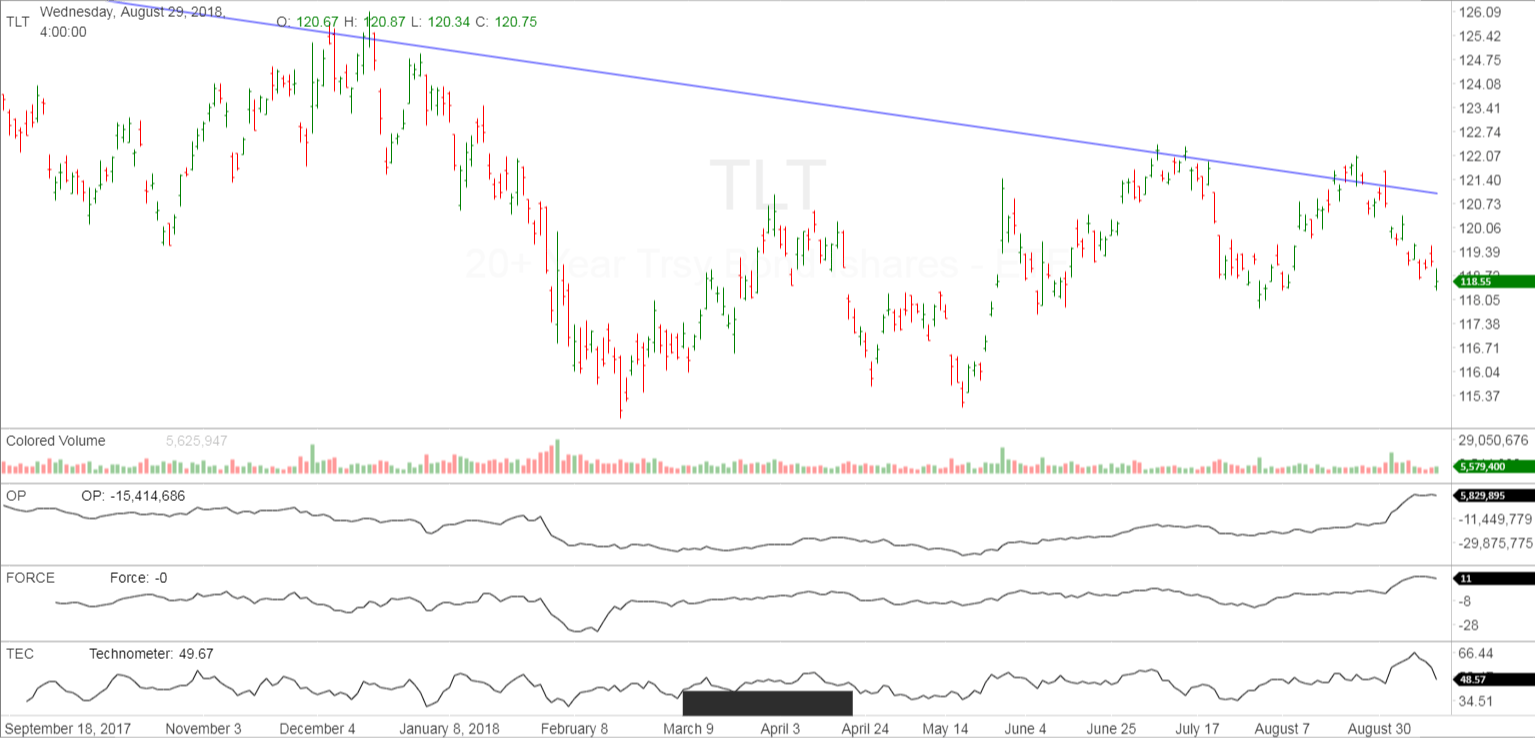
The bond market continued to trade lower for the week as called for. We just had a major overbought reading on the TLT, and have room to continue lower before becoming oversold. Stay short and trail stops.
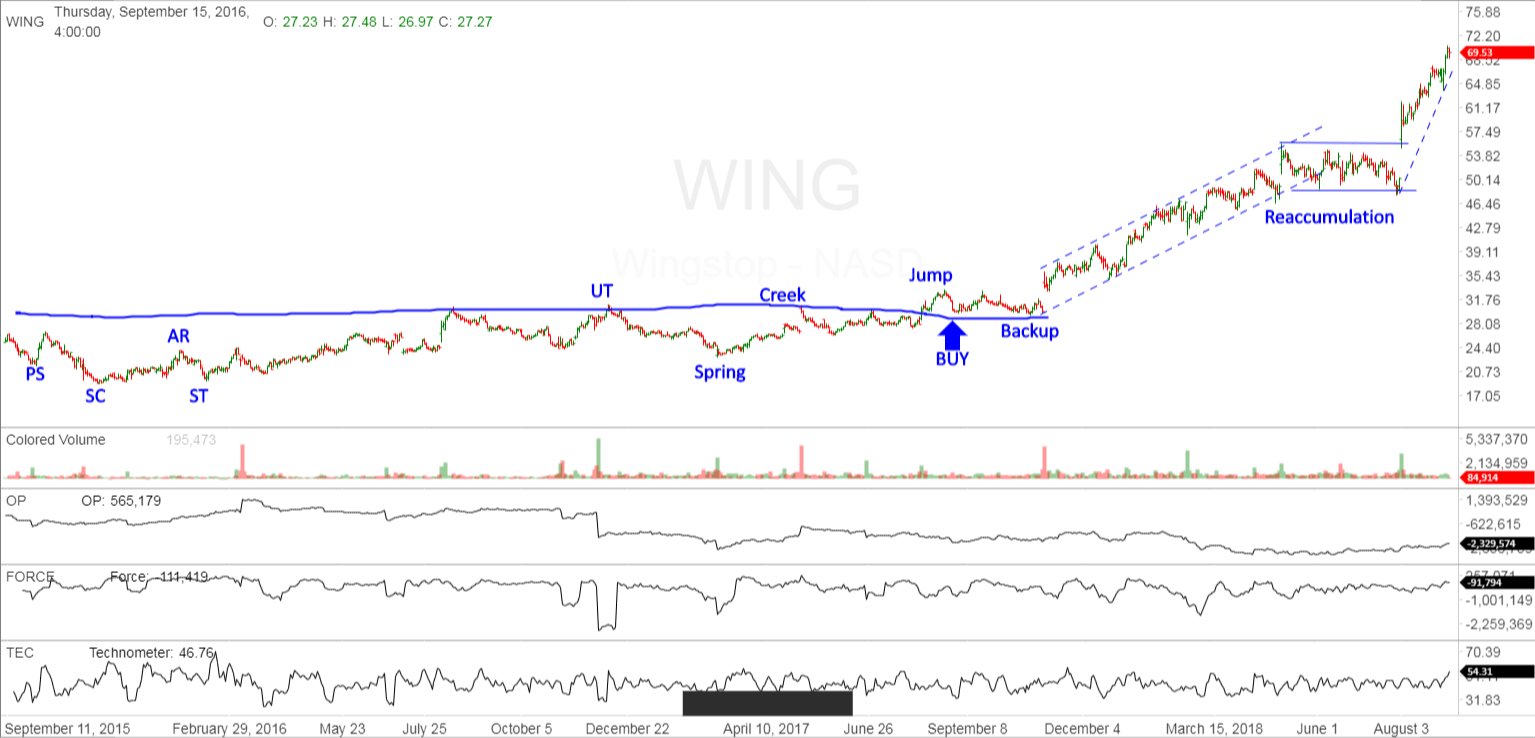
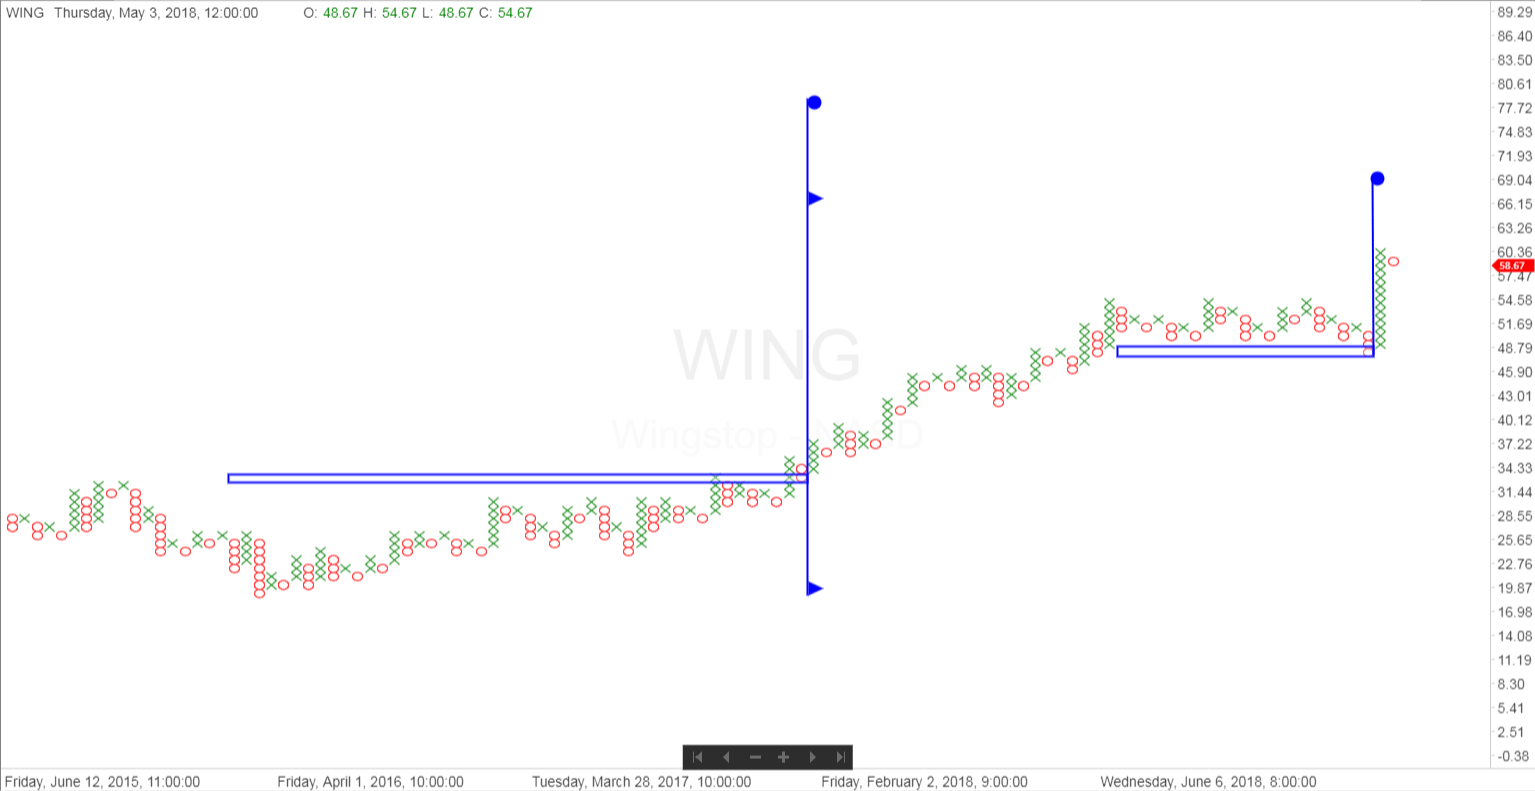
We wanted to add our charts from a recent Pro Trader trade that we closed out for over a 100% profit. Wingstop had a classic Wyckoff accumulation and markup phase that we managed to hold until two upside figure point objectives were reached at $69.
IMPORTANT ANNOUNCEMENT: Our “Pulse of The Market” charting software for Cryptocurrrencies is now working. This software has consolidated volume for the Crypto’s which is utmost important when applying Wyckoff Technical Analysis. We are showing this software in use on our social media sites.
Due to the demand for Bitcoin/Cryptocurrency information and trading knowledge, we released a Cryptocurrency and Wyckoff Trading Course at our site, LearnCrypto.io This course is being offered at an affordable $299.99. We have had 940 students enroll since its launch on June 22, 2017. On June 28th we added lessons detailing the OP, Force, and Technometer and how to use these Wyckoff Tools for analysis.
If you are interested in Wyckoff stock chart analysis as well as Crptocurrency, search “Learn Crypto / Wyckoff SMI” or click this link https://www.youtube.com/channel/UCDxK2PwEDvoaHZgjPV_WgcA
Please subscribe and click the bell to be notified of our upcoming broadcasts.
Our current schedule is Monday-Thursday approximately 6:30 p.m. CST, and they usually last approximately one hour. We will also broadcast at additional random times since we want to satisfy our international subscribers as well.
If you would also like to follow us on twitter for news and trade ideas, follow “LearnCryptoShow”, or “WyckoffonCrypto”. We have given numerous profitable trades to our subscribers on the Youtube channel, as well as Twitter.
Good Trading,
Todd Butterfield

Responses