A Lack Of Supply Rally
Monday, November 21, 2016
What To Do?
No changes from Friday
Short Term:
Short-term bulls should continue to maintain their positions. The expected minor reaction would create a difficult risk/reward ratio for any new positions to the downside. Short-term short positions are not recommended.
There are no short-term positions to the downside.
Intermediate & Long Term:
Intermediate and long term positions to the upside should be maintained.
There are no intermediate or long term opportunities to the downside
Market Trends:
Intra-day: Changed to Up
Short Term: Neutral.
Intermediate Term: Neutral
Long Term: Neutral
The stock market, as measured by the Wyckoff Wave, traded higher on decreased volume. It closed in the upper half of a very slightly wider price spread, in a neutral condition relative to the Technometer. The price spread and volume suggest a lack of supply. In addition, little demand was present.

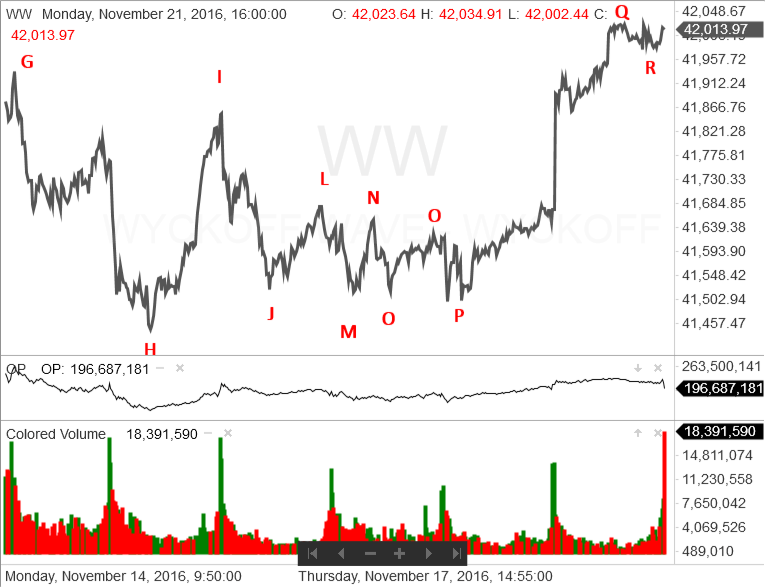
A review of the intra-day waves confirms the above. After a gap opening to the upside, the Wyckoff Wave continued to rally to point Q. The rally consisted of relatively narrow price spread and low volume. However, the Wyckoff Wave made reasonable progress to the upside. This suggested supply was being withdrawn.
Then, the Wyckoff Wave reacted to point R. The reaction was on a lack of supply.
During the last thirty minutes of the trading day, the Wyckoff Wave attempted to rally. It made little progress as volume increased. This suggests that some supply is coming back into the market.
Today’s poor quality rally continues to suggest that the Wyckoff Wave will react and test the intra-day lows at points P and H.
The Optimism – Pessimism Index reacted. It continues in a very short-term negative divergence with the Wyckoff Wave when compared with point T. The longer-term negative divergences with points and, J and H remain in place.
The Force Index also reacted and continues to produce moderately negative readings.
Tomorrow, the Technometer will open in a neutral condition.

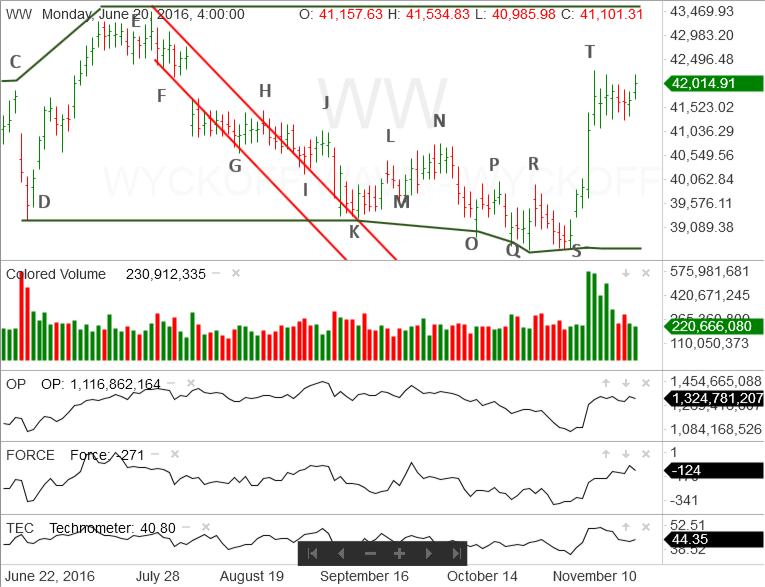
Today the Wyckoff Wave rallied, on a lack of supply, and is testing the high at point T.
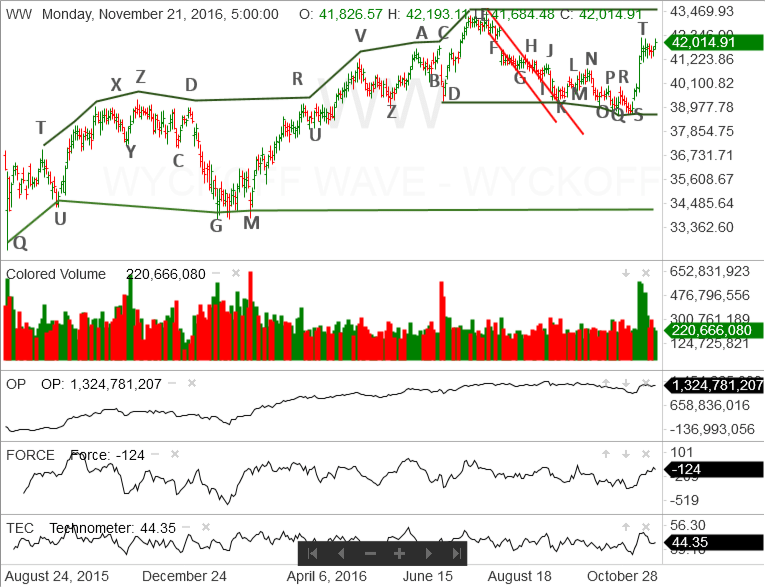
If the Wyckoff Wave is going to rally past point T towards the top of the latest phase of the trading range, one would expect demand would be coming into the market. That is not happening.
The negative divergence with its Optimism – Pessimism Index suggests the results of the rally off point S were not matched by the effort shown through the O-P Index.
This suggests the Wyckoff Wave will successfully test point T and continue its reaction to test that halfway point of the rally from points S to T. As previously mentioned this is also in the area of former resistance, now support points marked R and P.


Responses