More Sideways Movement
Technical Analysis of Stock Trends, The Wyckoff Wave – Week in Review October 7, 2016
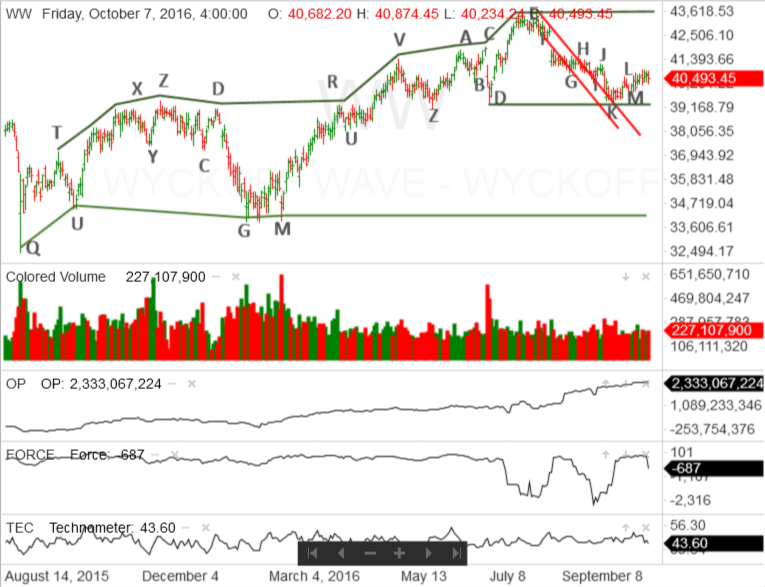
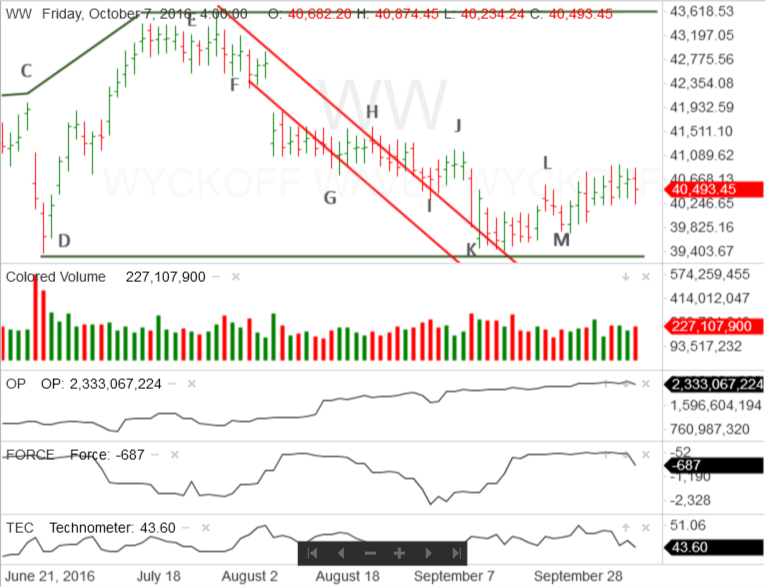
This past week, the Wyckoff Wave continued to move sideways, in a fairly narrow trading range. In fact, when the Wyckoff Wave closed on Friday, it was only 42 points lower than it was, at the close, on the previous Friday. This continues the extremely dull market that began on September 12th, after the reaction from point E to point K on the vertical line chart.
What is the market going to do in the short-term and, more importantly, what are the longer-term scenarios?
One of the purposes of a dull market is to motivate investors to sell their stock and look elsewhere for more active investment opportunities. This is one of the key factors found during periods of accumulation. These days this strategy is hindered by government overregulation and low interest rates. This makes it difficult for the individual investor to uncover alternate opportunities.
Other opportunities will only become attractive when our government reduces unnecessary regulations and the Federal Reserve allows interest rates to rise. This is probably why this trading range, which began with a Selling Climax on August 24, 2015 is still in effect.
Right now, the Wyckoff Wave has a huge count on the 100 Point & Figure chart. Like most trading ranges, this one is made up of four phases. Phase 1 will be from its ending action over to point D. Phase 2 is from points D to M. Phase 3 is from points M to U. Finally, phase 4 is from point U to point Q.
It is quite doubtful that the Wyckoff Wave will work out the counts that exist in all the four phases. If it does, I suspect that, by then, I’ll be smiling down on Wall Street from above.

Therefore, both short and long-term investors and traders should focus on the trading range’s first phase. Right now, the most important part of that phase is the support line drawn from point D.

Presently, it appears the Wyckoff Wave has rallied slightly and is beginning to roll over. This suggests the Wave is getting ready to react back towards the support line. If that happens, there is a good probability one of two things will occur.
1. The Wyckoff Wave will rally off that support and test the resistance at the top of the trading range. That is marked by the green line drawn through point E. If that happens, the trading range will continue until there is ending action. It would also create short-term opportunities to the upside.
2. The Wyckoff Wave could react sharply and penetrate the support. Demand would come into the market and the Wyckoff Wave would rally. This is a Spring. A successful Spring of the support at point D could certainly be ending action. This would place the Wyckoff Wave in a position to put in a significant rally. This is a more serious event and new intermediate and long-term positions should be considered.
There is a third scenario that has the Wyckoff Wave reacting sharply through the support at point D and move deeper into the trading range.
The moderate levels of both demand and supply on the slight advance from point M and a Technometer that can quickly become oversold on a reaction, suggest this scenario has a very low probability of success.
Therefore, it’s just a matter of waiting it out and letting the Wyckoff Wave provide more significant clues as to the market’s future direction.


Responses