A Nice Day To The Upside
Daily Pulse of the Market Report
Wednesday, September 28, 2016
What To Do?
Short Term:
Short term bulls, who entered the market, should maintain their positions.
There are no short-term positions to the downside.
Intermediate & Long Term:
Their are no intermediate or long term opportunities to the upside.
Long-term positions to the upside should be maintained.
There are no intermediate or long term opportunities to the downside
Market Trends:
Intra-day: Up
Short Term: Neutral.
Intermediate Term: Neutral
Long Term: Neutral
The stock market, as measured by the Wyckoff Wave, experienced and intra-day failure to the downside. It closed, on increased volume, in the upper quarter of a wider price spread, in a neutral condition relative to the Technometer. The intra-day failure suggests the presence of demand.
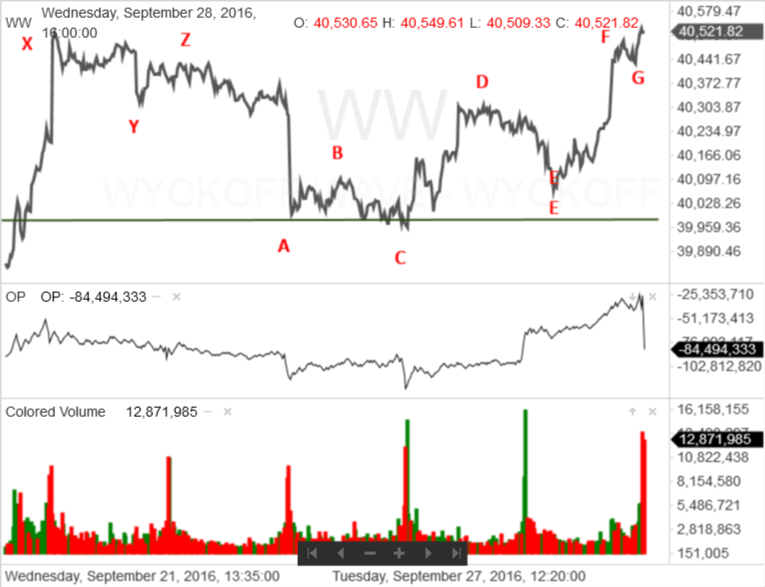
A review of the intra-day waves confirms the above. After a very small gap opening to the upside, the Wyckoff Wave reacted to point E. There, supply dried up, demand returned, and the Wyckoff Wave rallied for the rest of the trading day. The rally was on relatively wider price spread and good volume.
During this intra-day rally, the Wyckoff Wave put in a minor reaction from point F to point G. The reaction was on reduced price spread and volume, suggesting a lack of supply. Some demand did return during the last 10 min. of the reaction. The lack of supply is a positive indication as it sends a message that little supply is left to take in.
The Wyckoff Wave continued its rally to a strong close. The Wave closed slightly above last week’s high at point X.
Today’s market action suggests the Wyckoff Wave will continue to rally.
The Optimism – Pessimism Index rallied. It is in harmony with the Wyckoff Wave when compared with point D. A short term negative inharmonious action is developing when compared with point J. This needs to be watched.
The Force Index rallied and is producing low negative readings.
Tomorrow, the Technometer will open in a neutral condition.
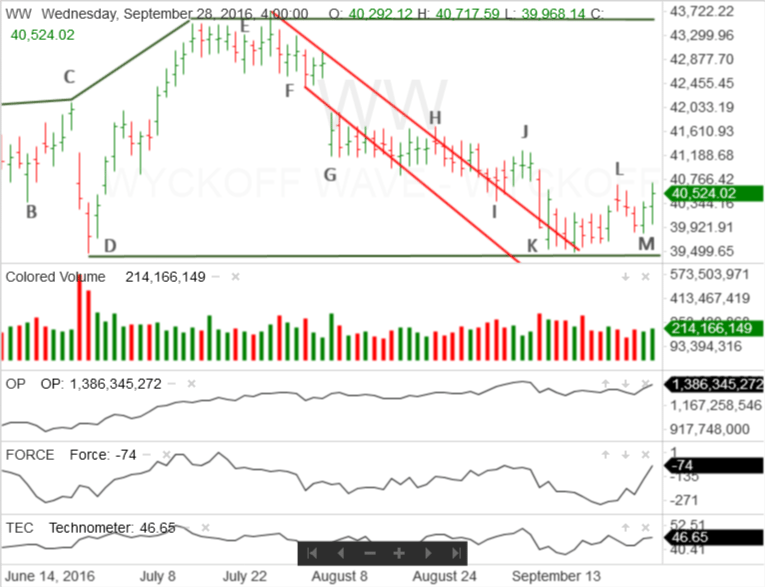
Today, after the intra-day failure to the downside, demand drove the Wyckoff Wave higher and slightly past the high at point L (point X on the intra-day line chart).
Today’s market action suggests the rally will continue. The next test would be at point J.
In addition to the presence of strong demand, the Optimism – Pessimism Index, which may be leading the Wyckoff Wave, and the rising Force Index all suggest the market will continue to rally. The neutral Technometer suggests the move could continue for the next few trading days, before the Wave experiences a possible corrective reaction.
It will be helpful to watch the O – P Index as the Wyckoff Wave rallies. While the Wave will probably experience a negative divergence, it is also not uncommon for the O-P Index to leave the Wyckoff Wave as a rally develops.
If this situation takes place, it will be important to carefully analyze the relationship between demand and supply, plus the Force Index readings. These readings, which record investor sentiment, would help overcome any negative readings from either the O-P Index or the Technometer.
In other words, while the Wyckoff Wave should continue to rally, it will probably not be a straight line back to point E.
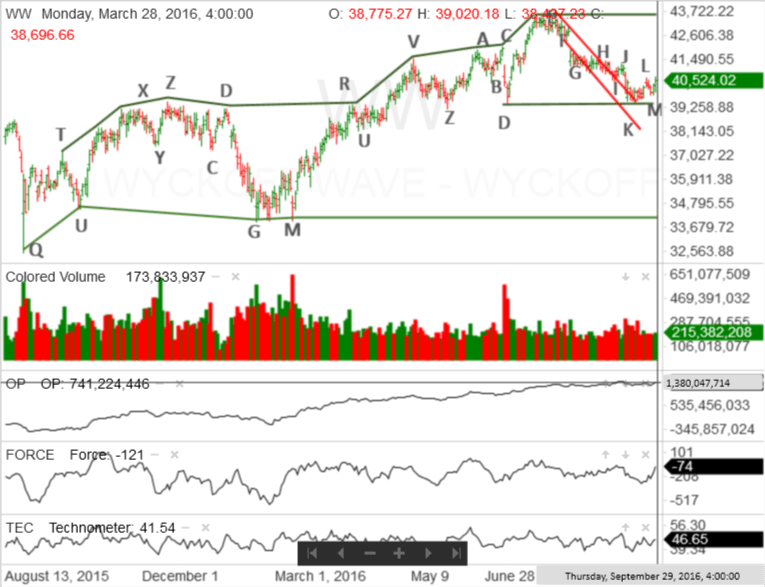
The final chart presents a longer-term view of the Wyckoff Wave.
Responses