"Pulse Of The Market" Indicators Available For TradingView
Indicator Package Overview
Our indicator package for TradingView, is the only place in the world where you can gain access to the Wyckoff Wave indicators that include our O-P Index, Force & Technometer. These indicators which are available for purchase at WyckoffSMI/LearnCrypto, are invaluable and required when using the Wyckoff Method to accurately predict market direction. Indicators are updated every 5 minutes throughout the trading day!!
These proprietary indicators will help any trader monitor the markets and gain the edge required in today’s fast-moving markets. Our crypto indicators are based upon “aggregate” data from up to 40 inputs (18 exchanges, 5 stablecoins). So we are getting the majority of volume to analyze as we do here at WyckoffSMI/LearnCrypto.
We have also built a “Wyckoff Sector DashBoard” for stocks and crypto, that will help Wyckoff students find the strong/weak sectors in comparison to the general market indices. This is a must to appropriately apply the Wyckoff method.
We also include a “Display Dashboard” to easily show up to 20 different stock and crypto Technometer readings at a glance.
With our “Pulse of the Market” indicator package at your fingertips and proper Wyckoff Methods in place, you are sure to increase your chance of achieving success in the markets.
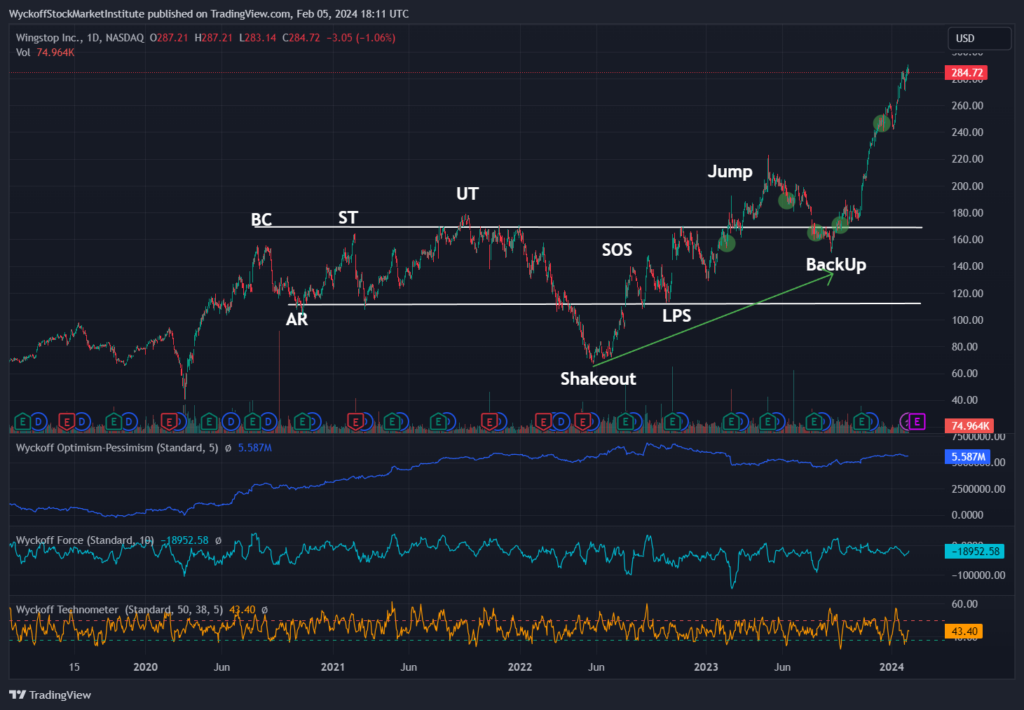
Wyckoff Wave With OP, Force & Technometer Index’s
Our world famous Wyckoff Wave with corresponding OP, Force & Technometer Indicators help traders recognize overall market direction and identify potential changes of character within the market.
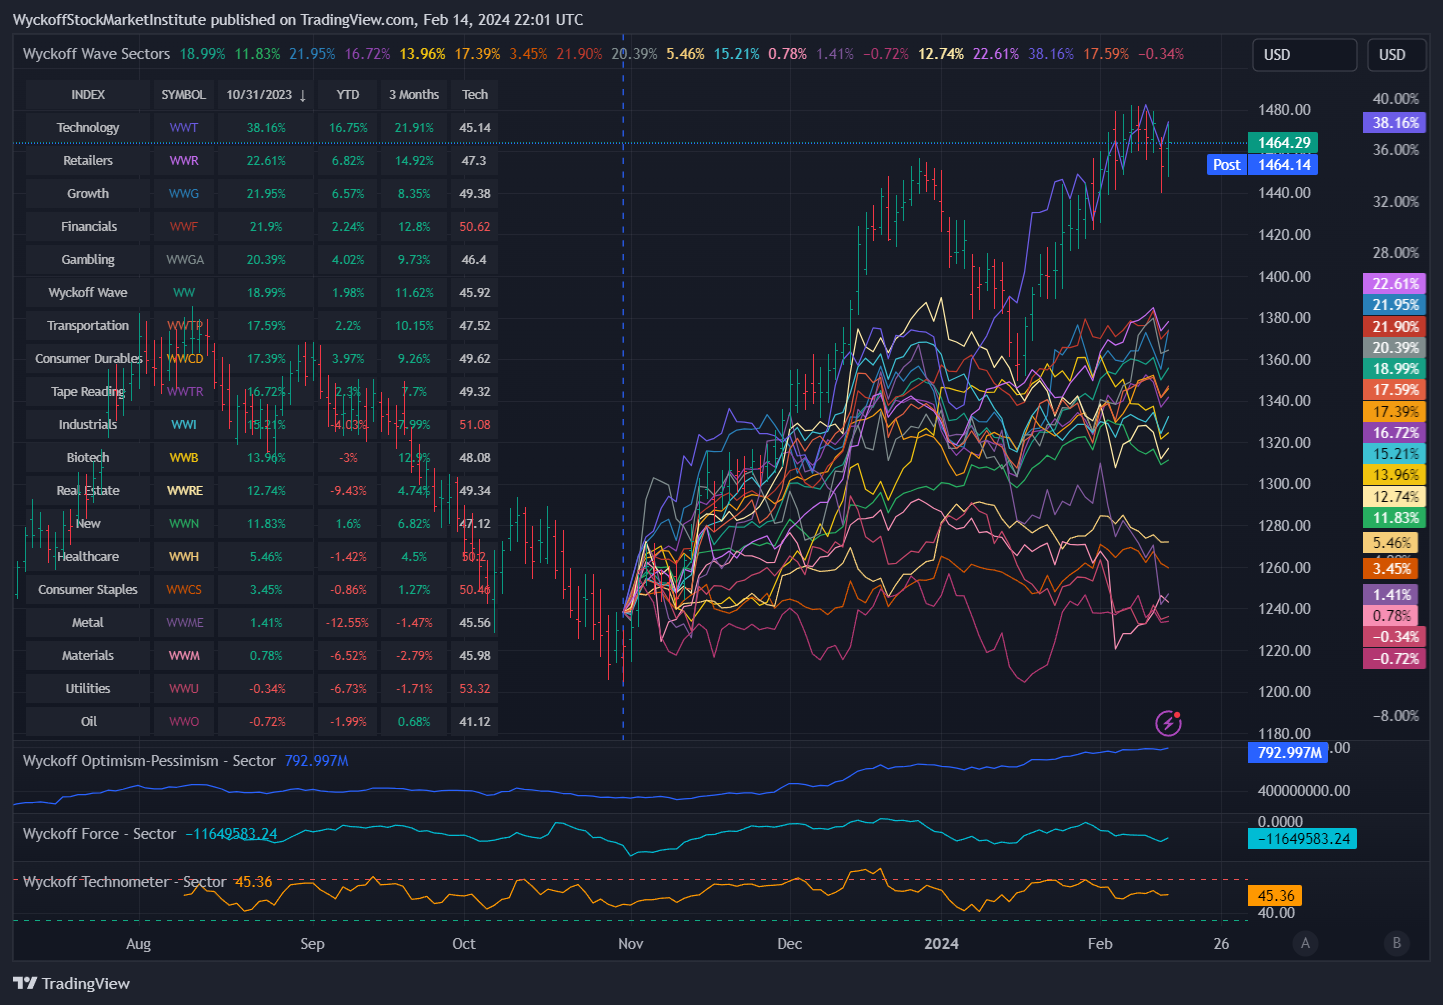
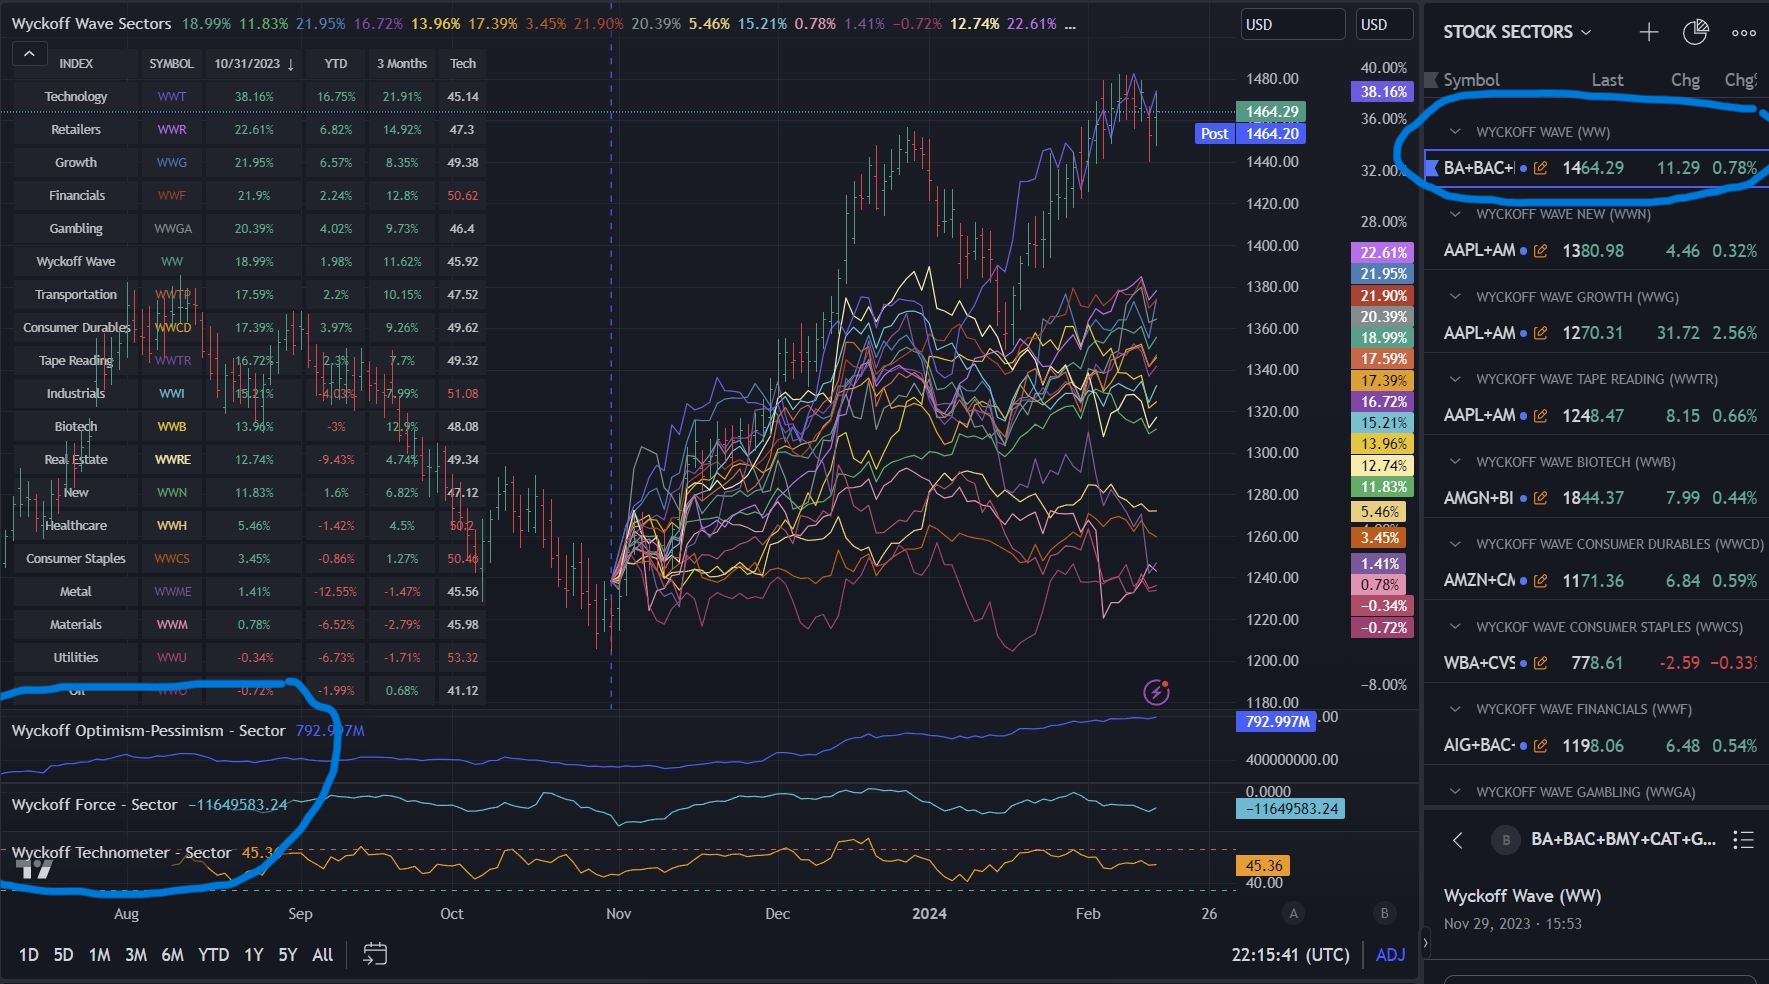
Wyckoff Sector Studies
This chart allows traders/investors to quickly identify which Wyckoff sectors are outperforming or under performing each other or the Wyckoff Wave, at any point in time. These sectors will also have their own OP, Force, and Technometer readings.
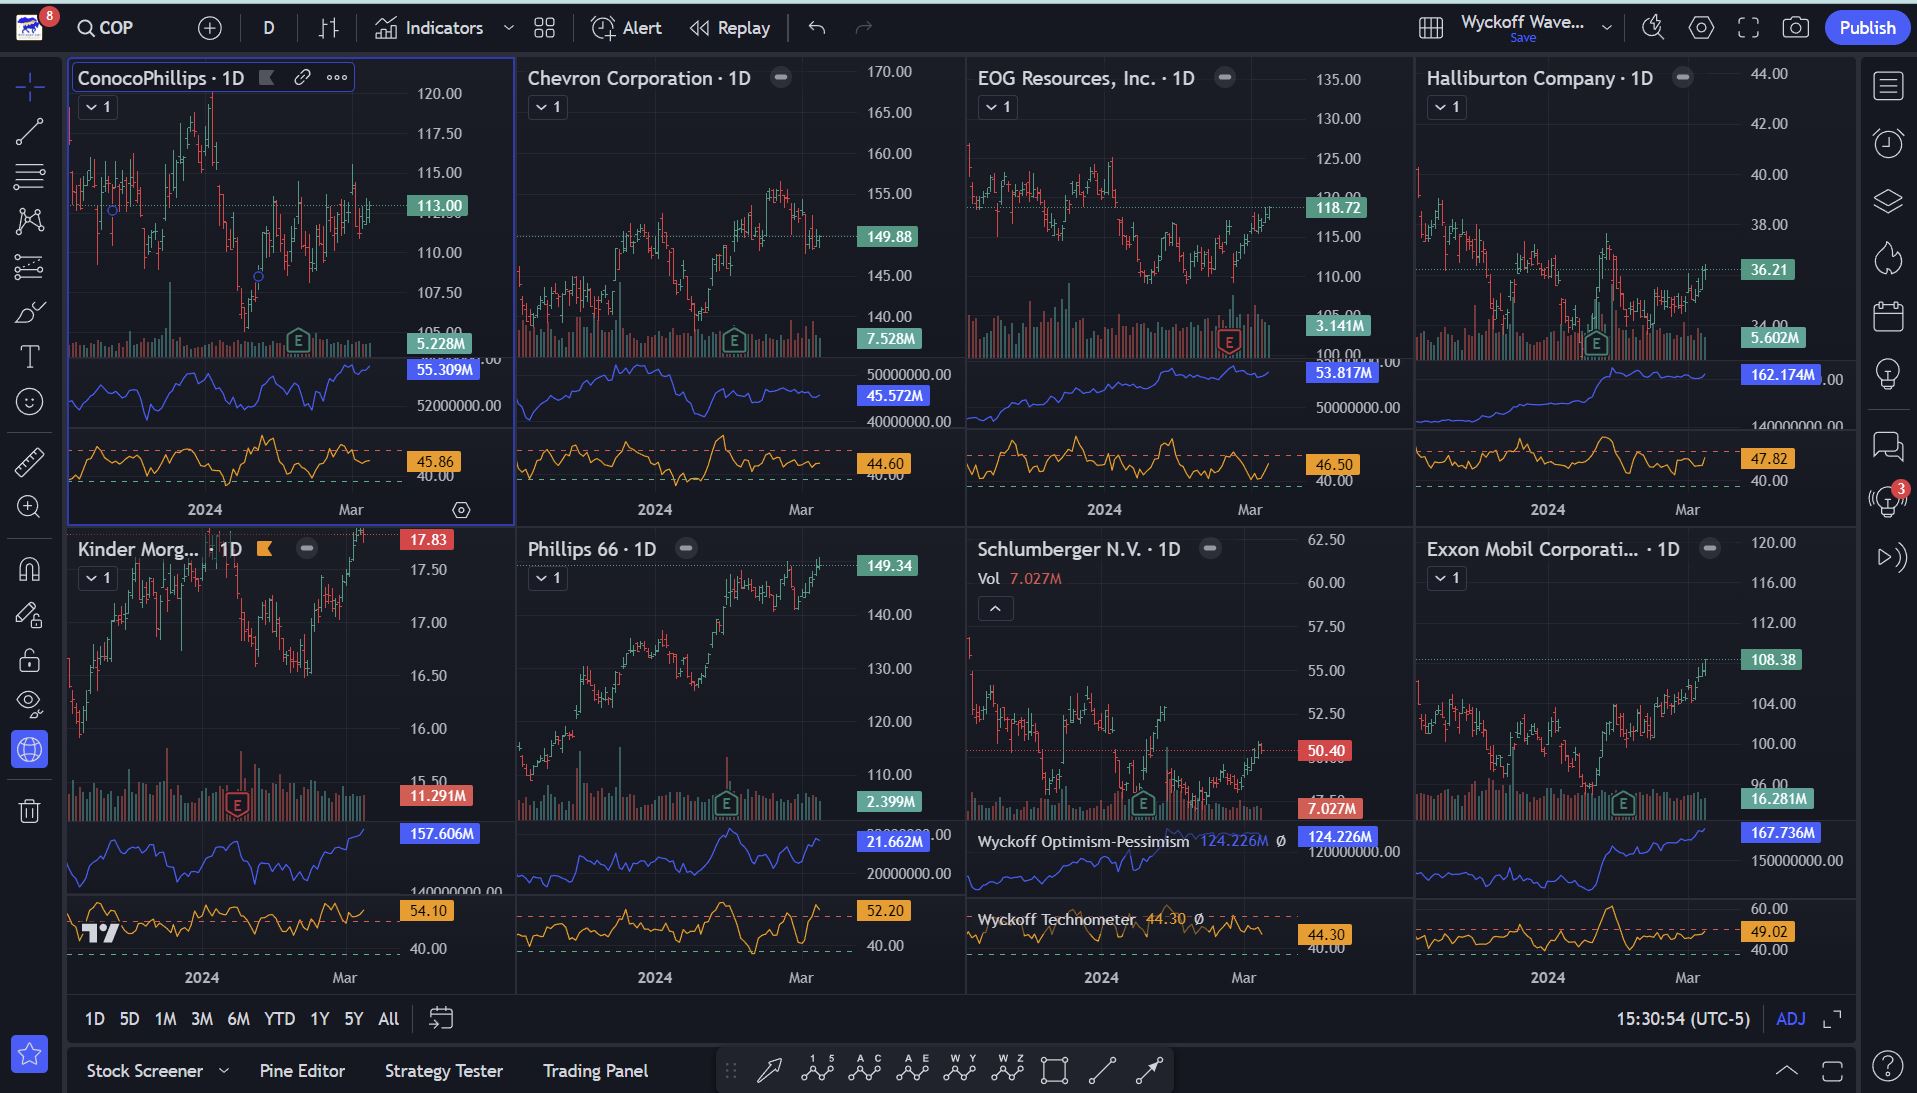
Compare Holdings Chart
TradingView makes it easy to then Compare Holdings of each Sector. We have setup all these Layouts for Subscribers so you can quickly identify how holdings in each Wyckoff Sectors are performing in relationship to one another. This allows you to quickly target underperforming and overperforming holdings.
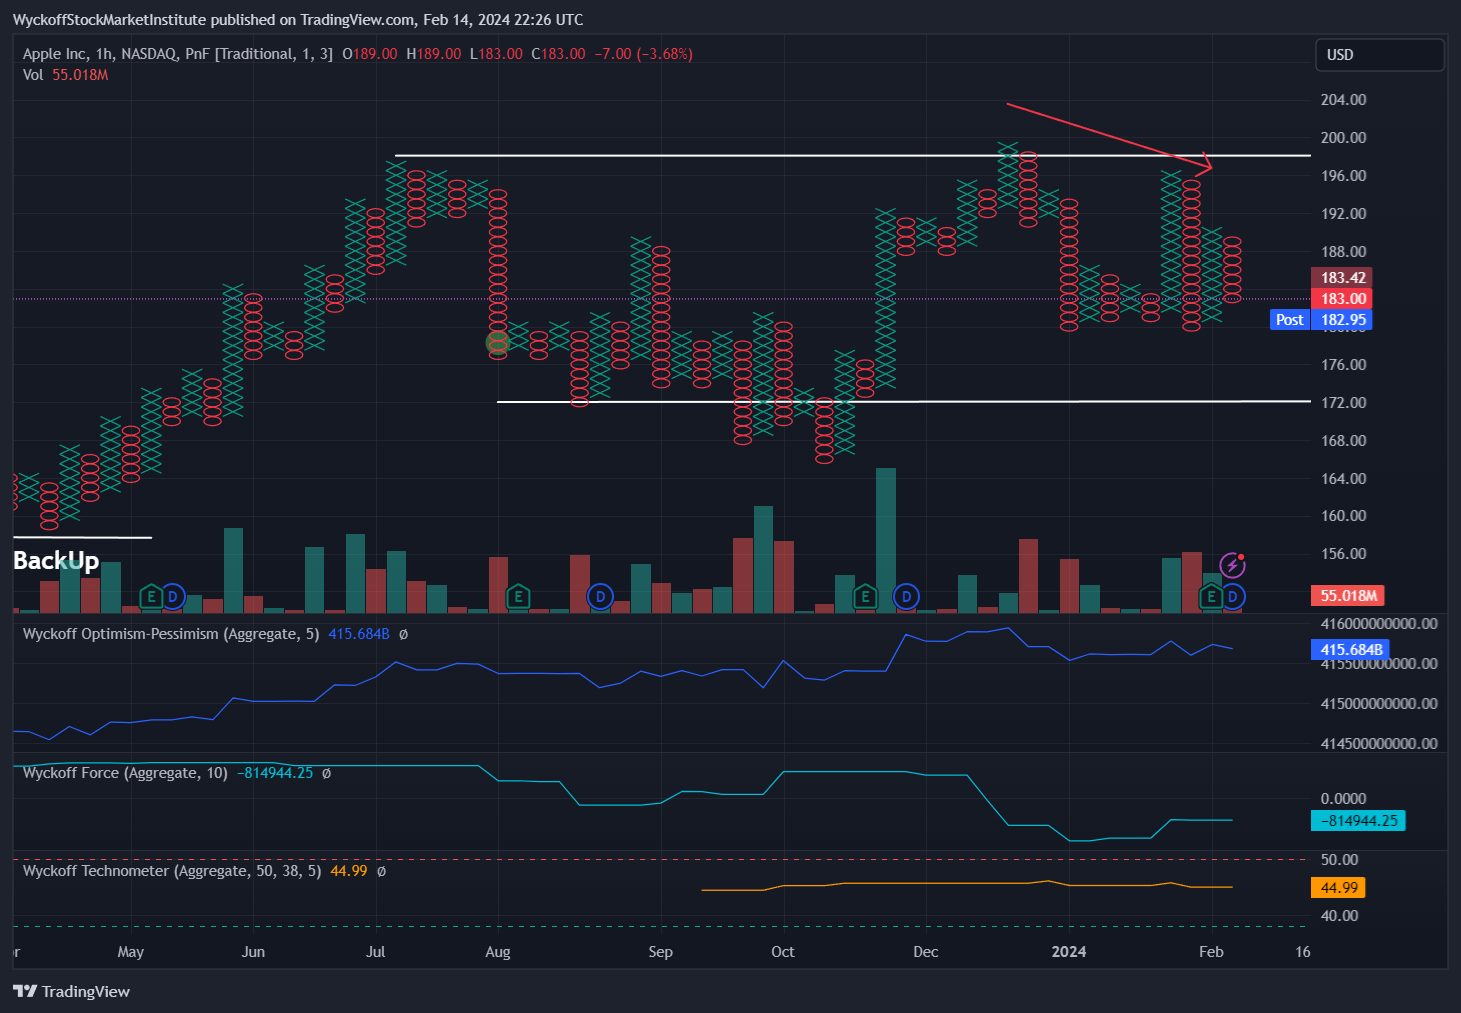
Point & Figure Charts
TradingView charting software allows us to display a point & figure chart as taught in our courses. A point & figure chart is a chart that plots day-to-day price movements without taking into consideration the passage of time. Point and figure charts are composed of a number of columns that either consist of a series of stacked X’s or O’s.
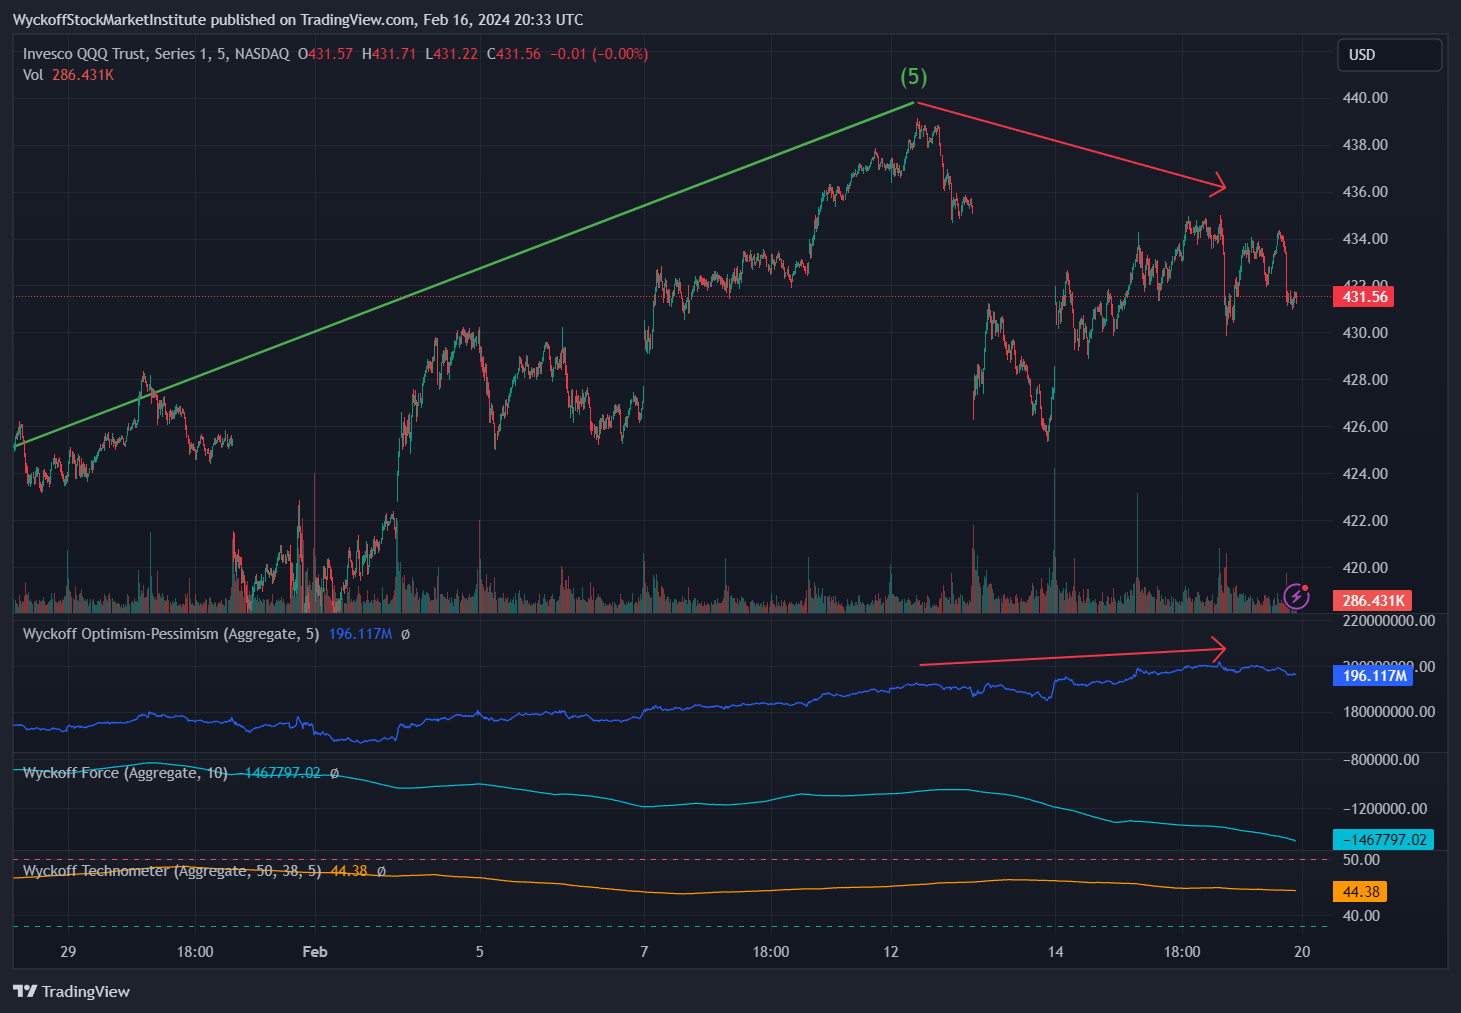
5 Minute Intra-Day Line Chart with our Wyckoff Indicators
This chart helps in the exact timing of taking a position in a stock/crypto. You can easily detect divergences / inharmonious action on an intra-day basis and establish positions accordingly.
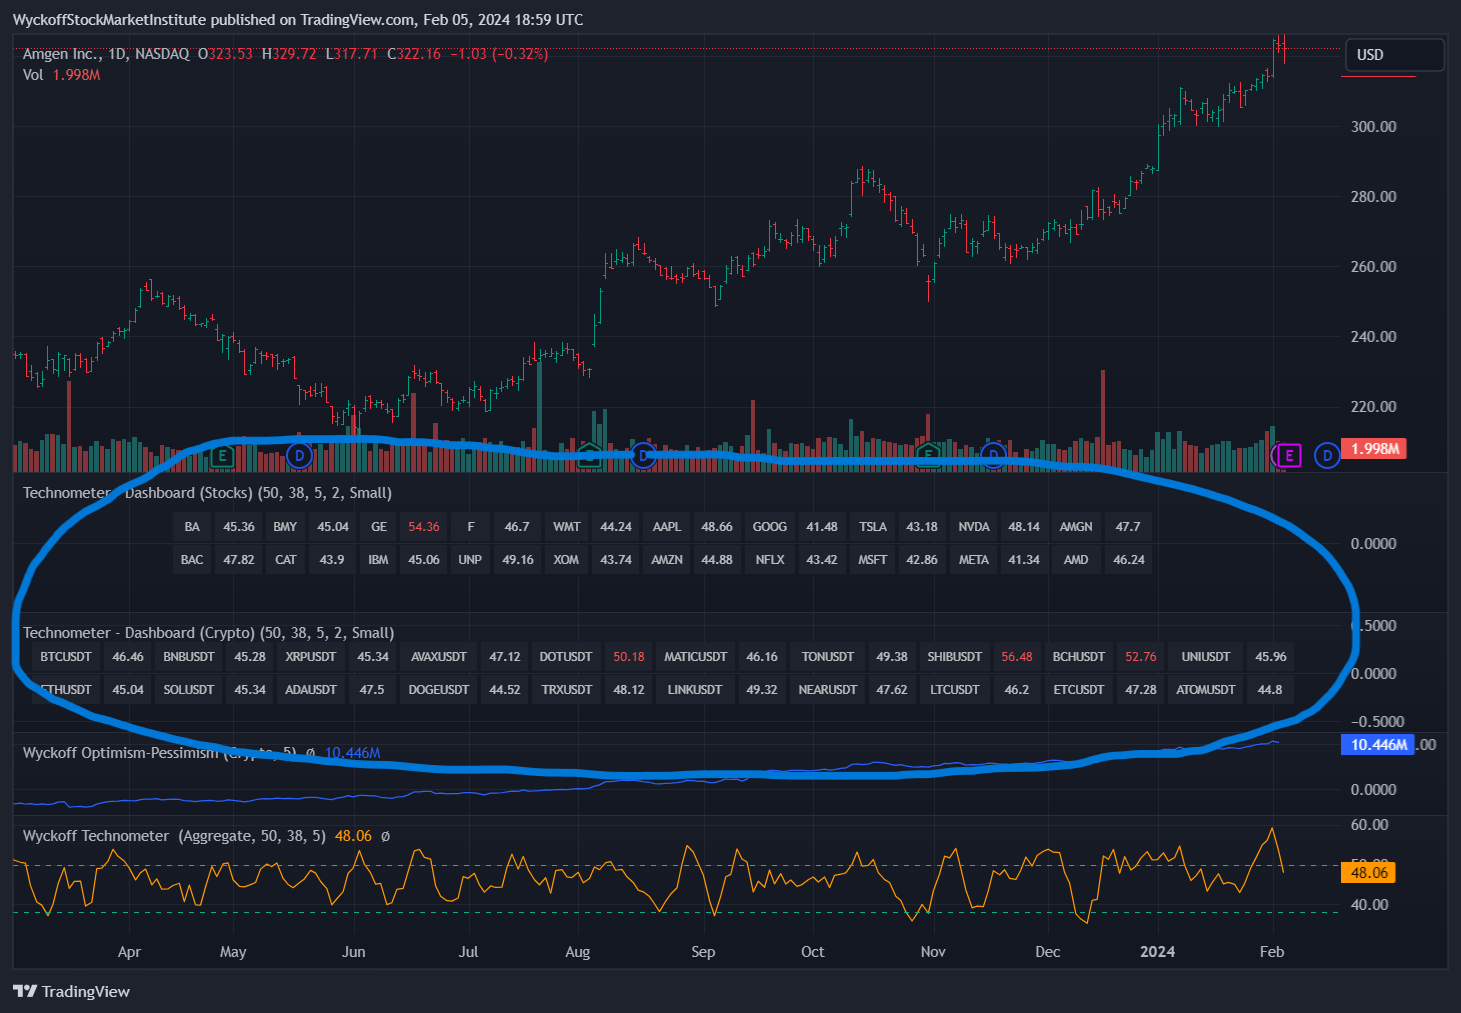
Technometer Display
Quickly access Technometer readings for up to 20 stocks and crypto holdings. A great starting point to where to dig in deeper for possible trade setups. No longer is there a need to view every chart to see the Techometer readings.
Excellent Features Of The TradingView Software
The TradingView software has the majority of all stocks and crypto traded around the world. Subscribers to our Wyckoff indicators will also receive access to our Wyckoff Wave Indices & Sectors for Stocks/Crypto. These are a must have for any Wyckoff trader / investor.
Works On Phones & Tablets
Their software works perfectly on Phones/Tablets, and able to view/share charts easily with other Wyckoff students/friends.
Custom Indicators
The TradingView software includes 100's of indicators to help you track the markets, as well as custom ones uploaded by users.
Twitter Snapshot
You can tweet your charts directly to your twitter! Just click the "X Tweet image" at the top right of the TradingView software to send a screen shot of your charts to your twitter followers!
Enroll Now To Gain Access To Our "Pulse Of The Market" Indicators For TradingView Membership👍🏻
📨 Email us at support@wyckoffsmi.com if you would like to pay with Crypto.
-
Access our proprietary indicators: Optimism-Pessimism Index, Force & Technometer for stocks, crypto, and futures.
-
OP, Force and Technometer readings for Wyckoff Wave Indices & Sectors
-
Wyckoff Sector Comparison Dashboard
-
Sector Holdings Comparison Dashboard
-
Technometer Display Dashboard
-
If you are a ProTraders member for stocks, or a Patreon member for Crypto, you can get 33% off our indicator package.
-
We need your TradingView User Name to give you access
-
Access our proprietary indicators: Optimism-Pessimism Index, Force & Technometer for stocks, crypto, and futures.
-
OP, Force and Technometer readings for Wyckoff Wave Indices & Sectors
-
Wyckoff Sector Comparison Dashboard
-
Sector Holdings Comparison Dashboard
-
Technometer Display Dashboard
-
If you are a ProTraders member for stocks, or a Patreon member for Crypto, you can get 33% off our indicator package.
-
We need your TradingView User Name to give you access