Reaction Continues
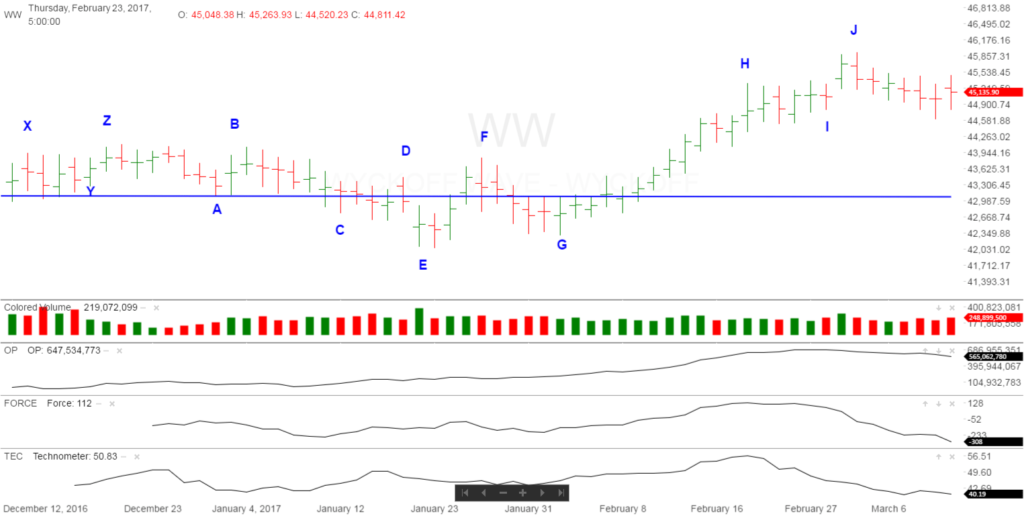
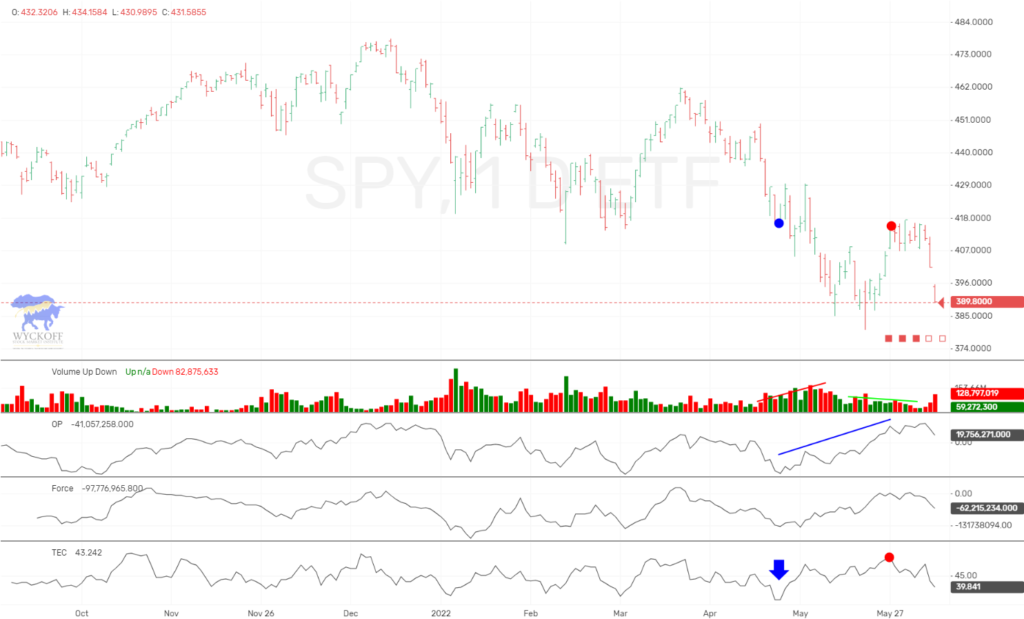
The Wyckoff Wave continued the reaction that began the week before. It did not make much downside progress, but a continued slight correction nonetheless. The price and volume relationship shows supply still present.
The Technometer was extremely overbought a week and a half ago, but with volume coming in on the downside on this reaction, it has brought the Technometer back to below a neutral reading. It currently sits at 40.10, with a reading below 38 considered oversold. Volume did not support the rally to “J”, and has continued to come in on the downside.
Volatility has not picked up, and we are at historical low levels.
The S&P and Nasdaq Indices were both down less than 1/2% for the week.
The Wyckoff Wave traded slightly lower everyday last week, before experiencing a snap back rally on Friday. With last weeks action we erased the rally from “I” to “J”. We expect lower prices in the days ahead.
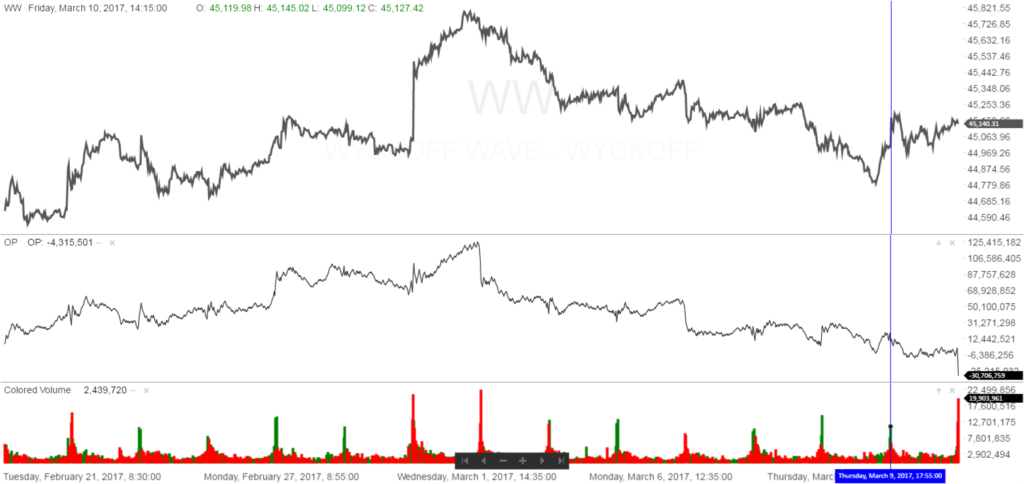
The Optimism – Pessimism Index lagged on the rally to “J”, and has continued to stair step lower on the pullback of last week. The O-P has a downtrend in place for the last two weeks, and continues to provide pressure to the downside. You can see the O-P’s recent downtrend on the chart below.
The Force Index did not support the rally to “J” either, and has traded quickly lower in the last two weeks. The Force Index is in a sharp downtrend and at a reading of -308. This should continue to provide downside pull in the days ahead. The Force Index is shown on the chart above.
We still have shorts on various stocks that continue to show relative weakness versus the general market. For our ProTraders we are short GE, SBUX, CAT, and PX.
The bond market traded down last week as well, and stopped us out of our long position for a slight loss. We are looking to re-enter longs in this market at slightly lower levels.
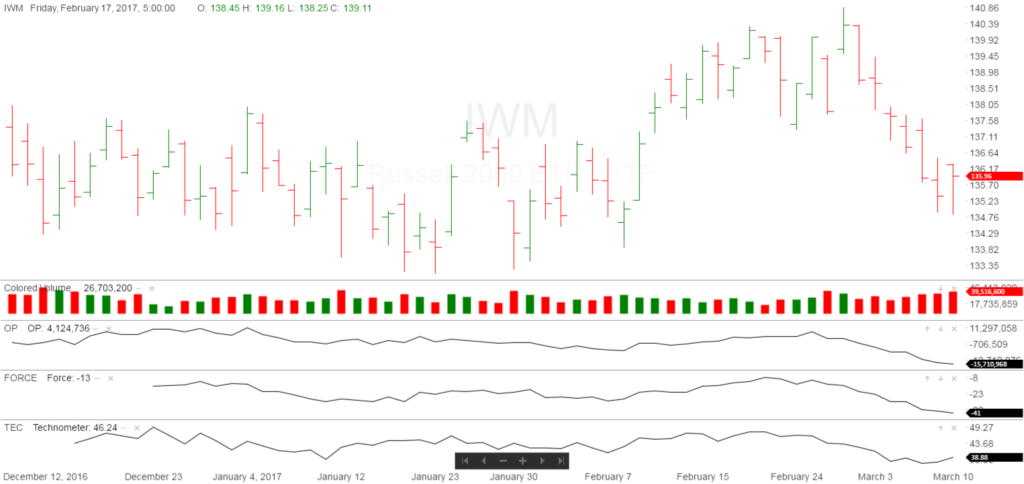
The chart below is that of the IWM, the Russell 2000 Index. This is an index of small cap stocks. You can see the underperformance in small caps versus the Nasdaq, S&P, Dow, etc.. We have continued to lean to the bearish side in the last few months, and this chart shows that small caps have struggled to work higher recently. We feel the next two charts support our thesis of more weakness in the general market in the days/weeks ahead.
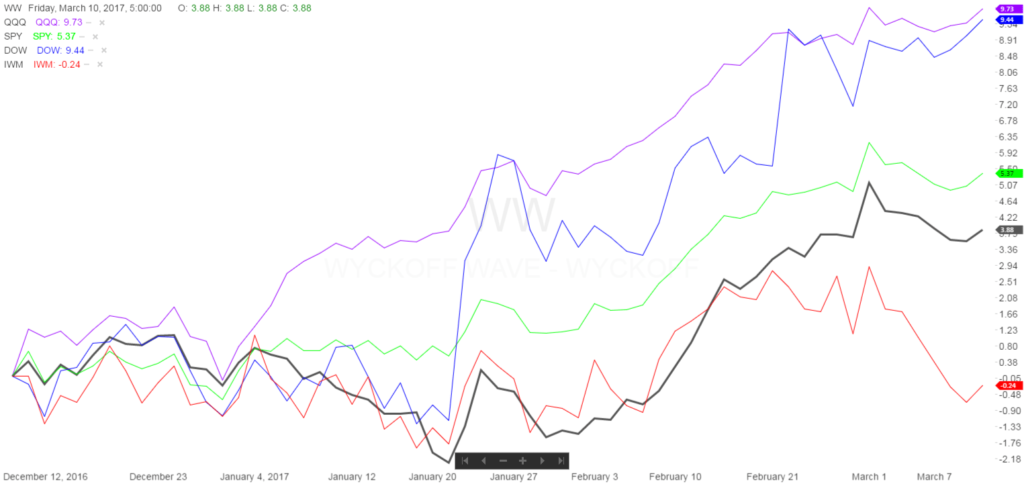
The following chart compares the Wyckoff Wave (black line), Nasdaq, S & P 500, Dow Jones, and the Russell 2000. You can see the relative under performance of the smallcaps on this 3 month chart.
Good Trading,
Todd Butterfield


Responses