Menu
  • Home
  • Store
    • Wyckoff Course
    • Memberships
      • Pulse Of The Market Charting Membership
      • ProTraders Membership
      • Pro Traders Membership (Crypto Discord Members)
    • Courses
      • **Wyckoff Unleashed Official Online Course**
      • Wyckoff Unleashed Official Beginners Online Course
      • Introduction To Wyckoff
      • Cryptocurrency & Wyckoff
      • دورة المبتدئين العنان – Unleashed Beginners Online Course
      • Richard D. Wyckoff Tape Reading and Active Trading Course
      • Wyckoff Trading Techniques Online Course
      • “Pulse Of The Market” Charting Software
      • Wyckoff Unleashed Course (Installment Program)
    • EBooks
      • Studies In Stock Speculation
      • Original Wyckoff Stock Market Institute Course Ebook 1931
    • Wyckoff SMI Partners
      • ReadTheTicker
  • Library
  • Alumni
  • Blog
  • Affiliate
    • Affiliate Program Info
    • Affiliate Area

    Shopping Cart

    No products in the cart.

    Sign in Sign up

    Shopping Cart

    No products in the cart.

    • Home
    • Courses
      • Wyckoff Unleashed Official Online Course
      • Wyckoff Unleashed Official Beginners Online Course
      • Wyckoff Unleashed Official Online Course (Installment Program) 6 Payments
      • Introduction To Wyckoff Online Course
      • Trading Techniques Online Course
      • Richard D. Wyckoff Tape Reading and Active Trading Course
      • “Pulse Of The Market” Charting Software Online Course (Free)
    • Memberships
      • Charting Membership
      • ProTraders Membership
      • Pro Traders Membership (Crypto Discord Members)
    • Library
    • Alumni
    • Blog
    • Affiliate
      • Affiliate Program Info
      • Affiliate Area
    • Contact Us
    • Login
    • Register
    Home » Wyckoff Indicators

    Tag: Wyckoff Indicators

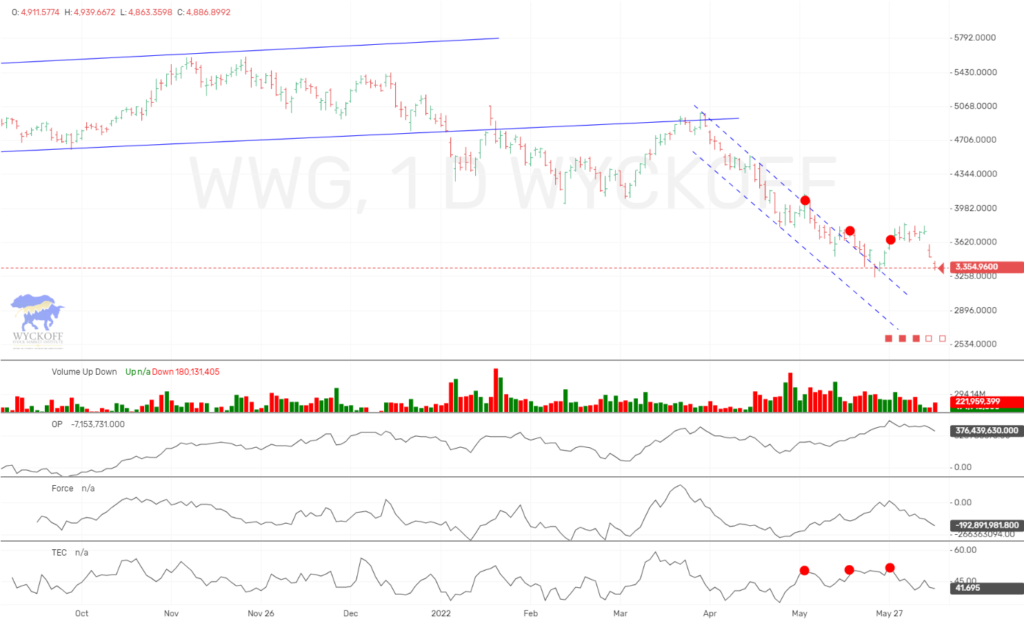
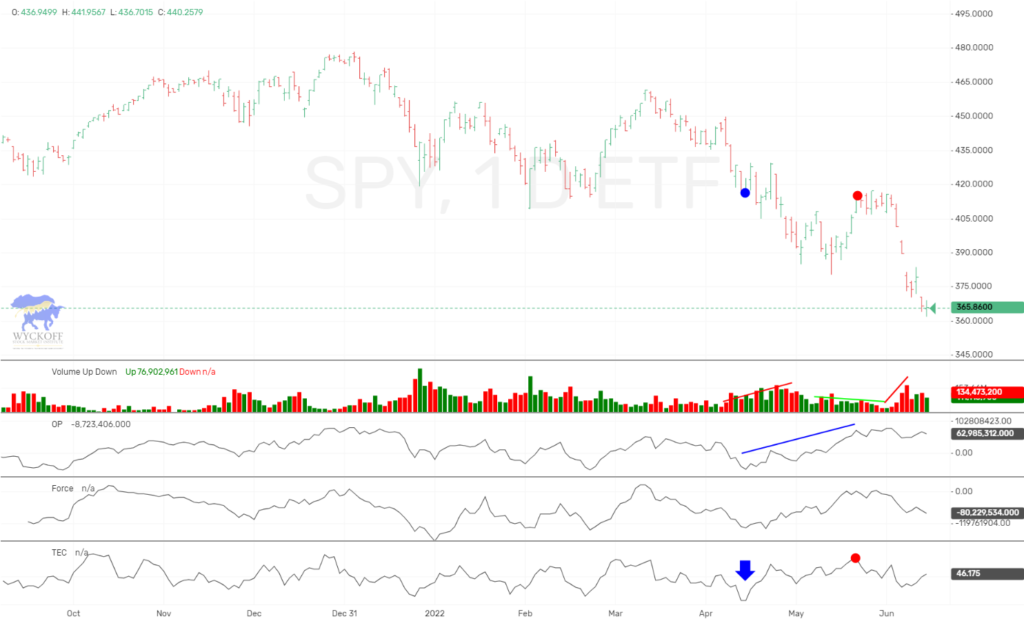
    Wyckoff Wave Still Searching For A Bottom

    The Wyckoff Wave closed the week down again, on an increase in volume. We was hoping that prices would try to hold early in the…

    Todd Butterfield June 20, 2022
    0 Comments

    Wyckoff SMI Update 6.10.22

    Todd Butterfield June 10, 2022

    A Short Term Reaction Is On The Horizon. What About The Big One?

    Click Here For Wyckoff Wave Chart 03-13-2015 This past week, as expected, the Wyckoff Wave rallied off the early March high at point R. In…

    jim-obrien March 14, 2015
    0 Comments

    The Wyckoff Tools Show The Way

    Click Here For Wyckoff Wave Chart 03-06-2015 Back on February 20th the Wyckoff Wave penetrated the top of the trading range (line drawn from point…

    jim-obrien March 7, 2015
    0 Comments

    Using the Wyckoff Tools to Find Turning Points in The Market

    Click Here For Wyckoff Wave Chart 04-04-2014 Every stock market trader is always trying to find the exact time and place where the market changes…

    jim-obrien April 4, 2014
    0 Comments

    Trading Range or Last Point of Support? The Wyckoff Tools May Offer Clues

    Click Here For Wyckoff Wave Chart 02-21-2014 This week the Wyckoff Wave reached, and slightly penetrated, the resistance at the bottom of the sideways movement…

    jim-obrien February 21, 2014
    0 Comments
    Load More
    © 2023 - Wyckoff SMI - Stock Market Technical Trading

    Forum Description

    Click Here For Wyckoff Wave Chart 02-21-2014

    This week the Wyckoff Wave reached, and slightly penetrated, the resistance at the bottom of the sideways movement that began just before Christmas. It also reached the supply line of its long term up trend channel. This is a normal place to encounter resistance and the Wyckoff Wave did just that. Instead of simply reacting, the Wyckoff Wave moved sideways and closed in the middle of a narrower weekly price spread. Volume was also reduced. From a weekly perspective, this suggests a lack of supply, which is a bullish indication. Last week the two prevailing scenarios were: 1. That the Wyckoff Wave was entering a trading range, beginning at point T or 2. It was going to react and put in that elusive Last Point of Support. While, according to my mail, many readers thought we were in for a strong and deep reaction, the markets strong behavior over the past two weeks gives that scenario a low probability of success. The trading range scenario was based on the fairly wide price spread and high volume on the reaction to point T. This does not look like preparation for a Last Point of Support. If there is going to be a Last Point of Support, point T needs to be tested and that Wyckoff Wave needs to hold above point T on reduced price spread and volume. Until supply dries up, the Wyckoff Wave will have a difficult time moving into new high ground. If the Wyckoff Wave is indeed beginning its reaction off the long-term uptrend channel supply line, it got off to a good start. There was noticeably reduced price spread and volume. However, one week does not move make and Wyckoff traders need to look into the market internals to find additional clues. The three Wyckoff tools (Optimism – Pessimism Index, Force Index and Technometer) are excellent helpers when analyzing the market or individual stocks. Presently, the O – P Index is in a negative divergence with the Wyckoff Wave. It is above the January highs, while the Wyckoff Wave has not reached that level. On a shorter term basis, this suggests the amount of effort, as indicated by the O – P Index, does not match the results of the Wyckoff Wave. On a longer-term basis, this suggests that the O – P Index is leading the Wyckoff Wave. This condition often occurs just for and during an important rally. As the Wyckoff Wave completed its rally to point U, the Technometer had moved into a dangerously overbought condition. By itself, this suggested a fairly strong reaction was coming. However, it is very important to use the Technometer in conjunction with the Force Index. A strong Force Index mitigates an overbought Technometer. During the same., The Force Index was producing extremely strong positive readings. This suggested that the Wyckoff Wave would have a much shorter and shallower reaction. So far, that is what’s happening. The next question is, will the reaction continue and if so, when will it end? The Wyckoff tools may have some clues that could help determine the answers. Subscribers to the Pulse of the Market Charting Service receive the daily commentary on the Wyckoff Wave and the Wyckoff tools. They are watching a sharp change in the Technometer as it moves toward an oversold condition. So far, the Force Index is still producing positive readings. An oversold Technometer, coupled with a strong Force Index is a bullish indication. As the week develops, these tools may provide some helpful timing indications for Pulse of the Market readers. This week’s narrower price spread and reduced volume, coupled with the positive indications coming from the Wyckoff tools, suggests the successful Last Point of Support scenario has a slight edge over the trading range scenario. If the coming week brings reduced price spread and volume, we can start looking for a last Point of Support. If price spread and volume increase, the trading range scenario needs to be revisited.

    Report

    There was a problem reporting this post.

    Block Member?

    Please confirm you want to block this member.

    You will no longer be able to:

    • See blocked member's posts
    • Mention this member in posts
    • Invite this member to groups
    • Message this member
    • Add this member as a connection

    Please note: This action will also remove this member from your connections and send a report to the site admin. Please allow a few minutes for this process to complete.

    Report

    You have already reported this .
    Clear Clear All