Tomorrow Is A Critical Day
Tuesday, October 11, 2016
What To Do?
No changes from yesterday
Short Term:
Short term bulls, who entered the market, should maintain their positions.
New positions can be taken if the Wyckoff Wave either successfully tests the support line drawn from point D, or on a Spring of that support.
If I am incorrect and the Wyckoff Wave reacts sharply through the support, position should be closed.
There are no short-term positions to the downside.
Intermediate & Long Term:
Their are no intermediate or long term opportunities to the upside.
Long-term positions to the upside should be maintained.
New positions to the upside can be taken on a successful Spring.
There are no intermediate or long term opportunities to the downside
Market Trends:
Intra-day: Down, using Reverse Use of Trend Lines
Short Term: Neutral.
Intermediate Term: Neutral
Long Term: Neutral
The stock market, as measured by the Wyckoff Wave, traded lower on decreased volume. It closed in the lower half of a narrower price spread, in a slightly oversold condition relative to the Technometer. The price spread and volume suggest a lack of supply.
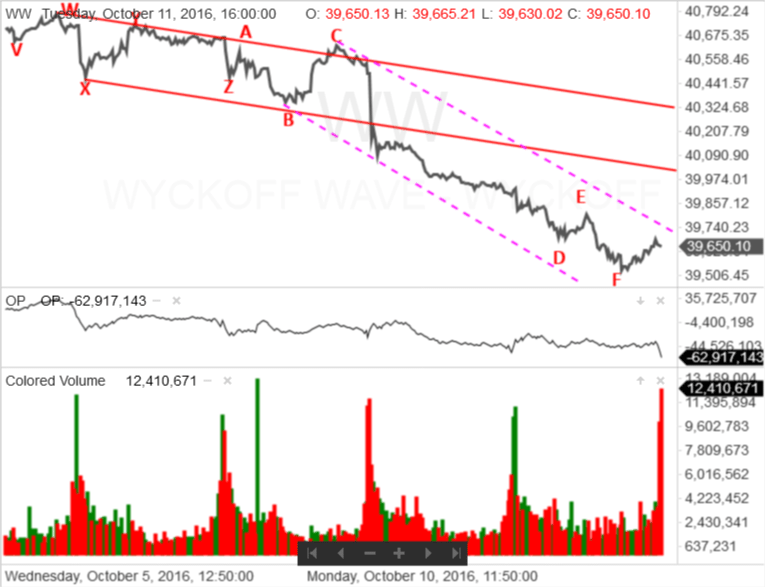
A review of the intra-day waves suggests that for most of the day, supply dominated the market action. Some demand did return during the last hour and 40 minutes.
After a gap opening to the downside the Wyckoff Wave continued to react until it reached point D. After a brief, poor quality, rally to point E, supply returned and the Wyckoff Wave reacted to point F. Then, some demand returned and the Wyckoff Wave rallied for the remainder of the trading day. While demand was present, it was not particularly strong.
As the Wyckoff Wave moved into a significantly oversold position relative to its intra-day down trend channel, a new down trend channel, using the reverse use of trend lines has been drawn. It is marked by the dotted lines.
The Wyckoff Wave is in an intra-day positive divergence with its O-P Index when today’s close is compared to points F and D.
Although the Wyckoff Wave continued to react on good supply, it was unable, at both points D and F, to reach the new down trend channel’s support line. This is a minor indication of relative strength.
While demand was not particularly strong on the intra-day rallies off points D and F, the Wyckoff Wave does have an opportunity to weaken the new intra-day down trend channel.
All this suggests the Wyckoff Wave is reaching the support that is shown on the daily vertical line chart and is probably getting ready to rally.
The Optimism – Pessimism Index also reacted. It is in a very short-term slight positive divergence, with the Wyckoff Wave, when compared with point K. It is in a longer term positive inharmonious action with the Wyckoff Wave when compared with point D.
The Force Index reacted and is producing strong moderate readings. There is a mitigating impact on the slightly oversold Technometer.
Tomorrow, the Technometer will open in an oversold condition.
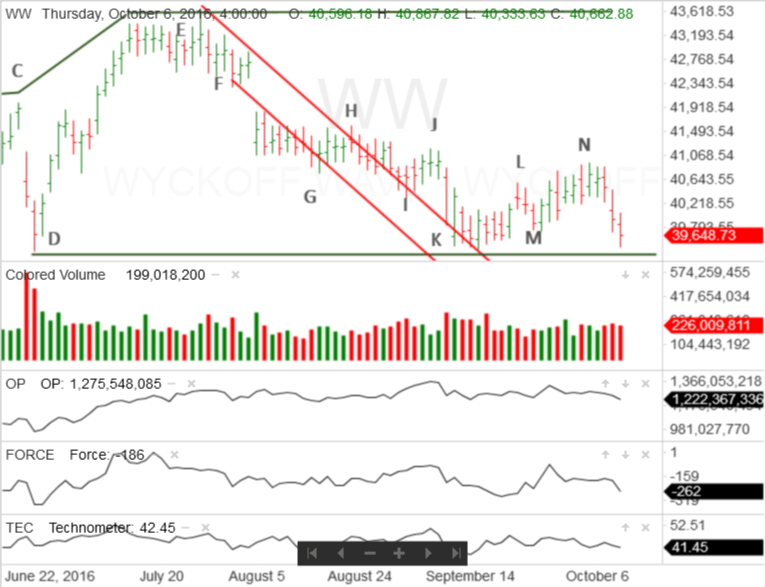
Today, the Wyckoff Wave continued its reaction off point N and is testing the support line drawn from point D. While supply was certainly present, it was not as strong as on Monday. This would suggest the Wyckoff Wave is preparing to test the support and rally.
If the Wyckoff Wave was going to Spring the support there is a good possibility it would’ve done so during the afternoon.
However, the Spring scenario, while its probability of success is reduced, is still a viable option.
Tomorrow will be a critical day. The Wyckoff Wave is either going to rally off the support, Spring the support or react strongly back into the trading range. These scenarios are listed in order of their probability of success.

Responses