Wyckoff Wave Rallies To A New High
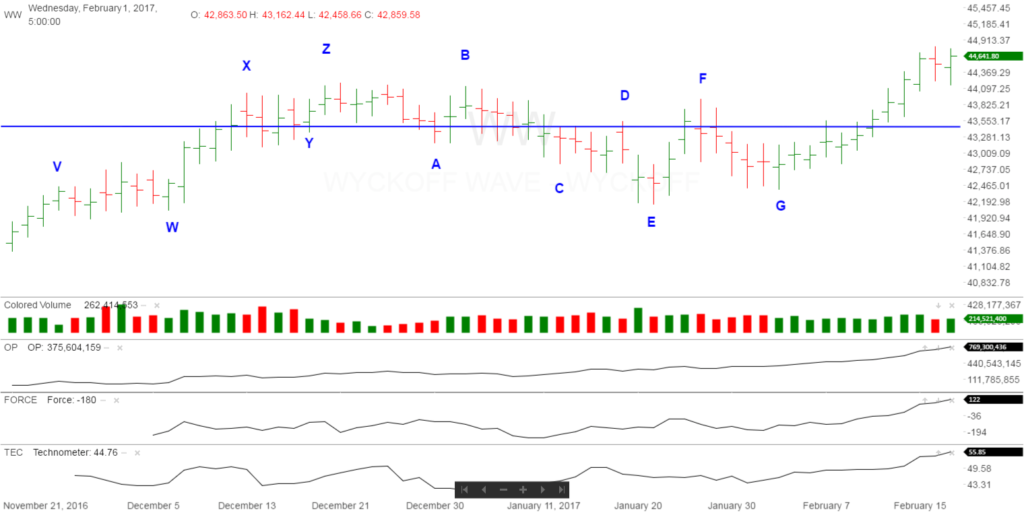
The Wyckoff Wave spent the first half of last week rallying to a new high above the previous resistance of the preceding two months. Volume did not increase noticeably, but stayed at recent average levels. The rally of last week caught us by surprise, as we was not expecting a move to a new high at this time.
The Technometer is now registering a dangerously overbought level, and should make it harder to extend the advance in the Wave from these levels.
Volatility continues to stay low as we have a slow melt up in the various market indices.
The S&P and Nasdaq Indices were both up approximately 1.5% for the week.
The Wyckoff Wave has rallied back to new highs, but we did not feel the selloff to “E” and “G” was a Last Point of Support (LPS). Volume has not came in strong as we would have expected, so we are of the opinion that we are just making a higher high here, and not beginning a strong move to the upside. We would like to see the next correction, and see how the price spread/volume acts at that time.
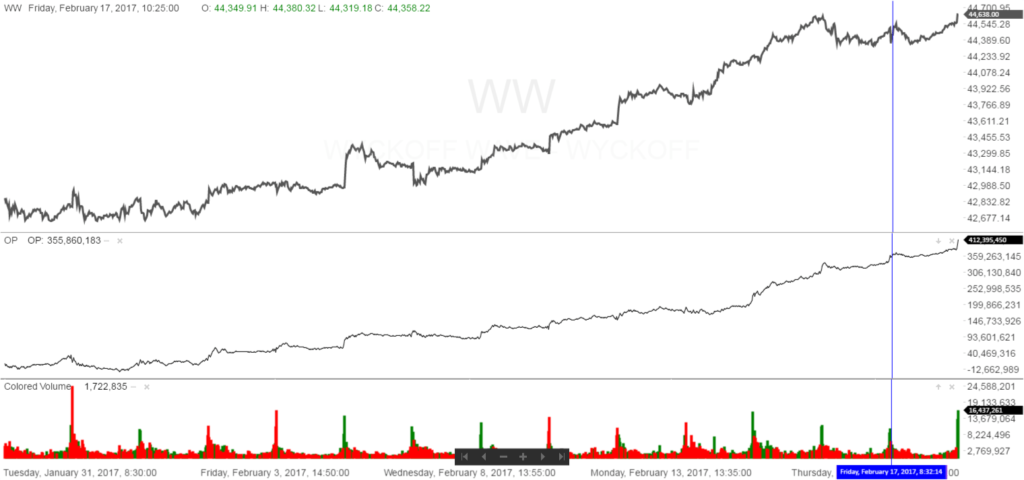
The Optimism – Pessimism Index continues to rally to new highs as this move progresses. You can see this in the 5 minute O-P chart below. The Wyckoff Wave has finally joined in a new high this week, but the divergence we have had for the last few months, has now been replaced with inharmonious action.
The Force Index has continued to rally and now is at a positive 122, which shows upside pull on the market. This takes away some of the negative overbought reading from the Technometer.
This past week we were stopped out of some of our general market ETF shorts, but we still have shorts on various stocks that continue to show relative weakness versus the general market. Some of these like GE, KO, and SBUX.
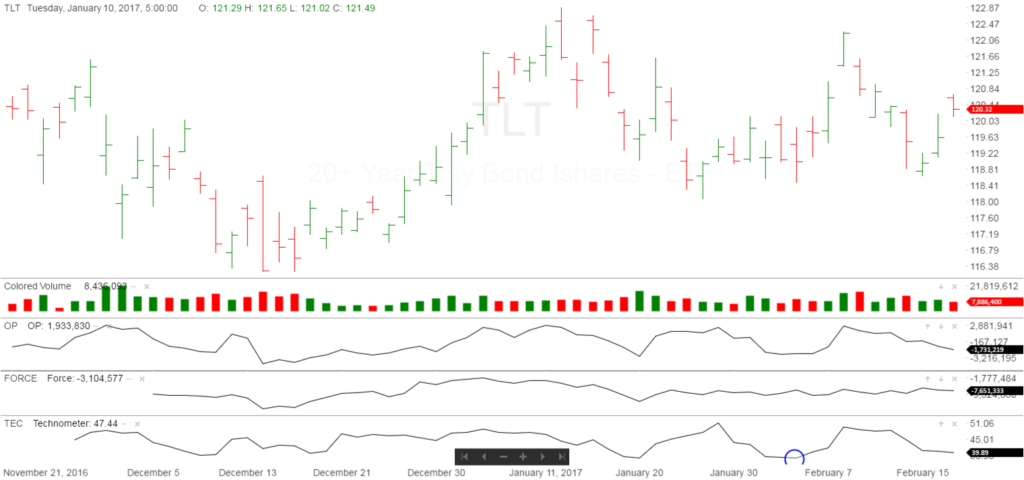
The bond market declined quickly early in the week, and then finished the week on a stronger note. We are still long and expecting higher prices. Below is the TLT Daily Chart with the O-P, Force, and Technometer at the bottom of the chart.
Good Trading,
Todd Butterfield


Responses