A Change In Scenarios
Technical Analysis of Stock Trends,
The Wyckoff Wave – Week in Review October 21, 2016
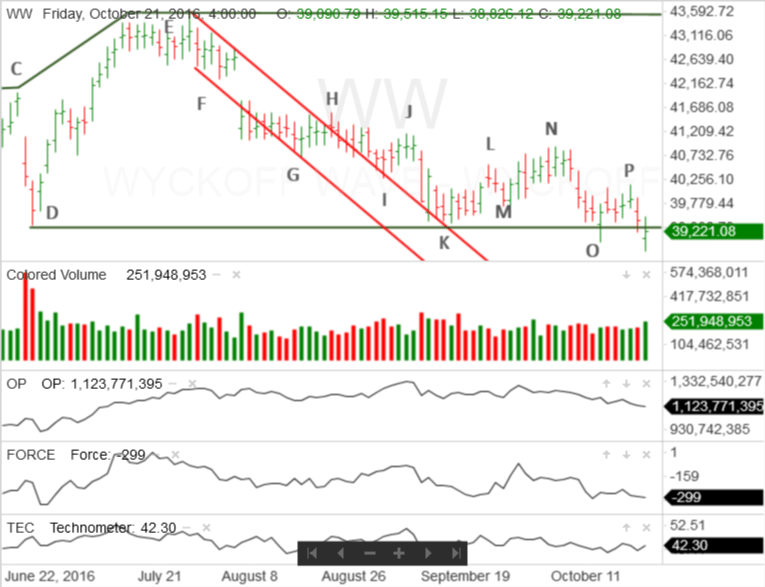
A week ago Thursday, at point O, the Wyckoff Wave put in what certainly appeared to be a Spring. The Wave penetrated the support line drawn from point D and demand came into the market.
However, as mentioned in last week’s Market Letter, the demand, while certainly present, was not strong. Last week’s comments are reprinted below.
“That means the Spring is confirmed, when strong demand comes into the index or individual stock.
“In this case, while demand came into the market and the Wyckoff Wave rallied, it was not overpowering. If the Spring was going to be confirmed on Friday, demand needed to continue. The Wyckoff Wave needed to rally on increased price spread and volume.
“That didn’t happen. Instead, the Wyckoff Wave experienced an intra-day failure to the upside. After a nice gap opening, the Wyckoff Wave continued to rally, but quickly encountered supply.”
Springs need to be tested. On Monday, the Wyckoff Wave reacted and some demand came into the market. Then, the Wave continued to rally to point P. The rally was not of particularly good quality.
This meant that the Spring needed to be validated by a successful Secondary Test.
On Thursday the Wyckoff Wave reacted on wider price spread and slightly higher volume. This suggested the appearance of supply. Friday was a critical day. The Wyckoff Wave needed to react on reduced price spread and volume. This would indicate that supply had dried up and there was a successful Secondary Test of the Spring.
Instead, Friday’s reaction was on slightly decreased price spread and increased volume. More importantly, Friday’s market action moved the Wave slightly below the bottom of the Spring.
This eliminated the successful Secondary Test scenario. It also created two new scenarios.
The first concerned the poor quality of the Secondary Test. Poor quality Secondary Tests need to be retested. For this scenario to play out, the Wyckoff Wave needs to rally and probably move above point P. In addition, the rally needs to be on stronger demand than we saw off the original Spring at point O.
Then the Wyckoff Wave needs to react and put in a successful Secondary Test. The reaction should be on reduced price spread and volume and hold above Friday’s low.
If that happens, the Spring would be confirmed and the Wyckoff Wave could begin to rally into a Sign of Strength.
If that doesn’t happen, the second scenario will probably play out.
Support lines, at the bottom of a trading range, are not necessarily horizontal. Instead, they are drawn through noticeable points of support. In this case, both points D and K, which are significant points of support, happen to be at the same level. Therefore the support line drawn from point D is horizontal.
If the successful Secondary Test scenario does not play out, there is a strong probability that the Wyckoff Wave will continue to move sideways in the trading range that began at point D.
That scenario would eliminate the spring at point O and yesterday’s poor quality Secondary Test. Instead, the support line that began at point D would be drawn through point K. Then it would be adjusted to include point O and yesterdays low.
This scenario would allow the Wyckoff Wave to rally within the trading range but, most probably, it would be unable to leave the trading range to the upside.
New ending action could then come in the form of a Spring. Hopefully, this one would be confirmed by a successful Secondary Test.
There is one other possible scenario. The Wyckoff Wave could continue to react through the support and move towards the bottom of the entire trading range that began in August, 2015.
While that scenario is always possible, it appears to have a low probability of success. This is because, while supply is present, it has not been particularly strong and more importantly, not sustained.
For example, while yesterday’s market action appears to show the presence of strong supply, a wide gap opening and brief 5 min. follow-through took the Wyckoff Wave to its low for the day. The Wave spent the rest of the day rallying on moderate demand. The day’s supply was not particularly strong and certainly not sustained.
In addition, when an index or stock reacts strongly through an important support line, it does so quickly and decisively. That hasn’t happened.
Finally, the Technometer is in a nearly oversold condition and would become clearly, or even dangerously, oversold, if the reaction continues.
This is been a relatively dull market. The Wyckoff Wave has basically moved sideways since the middle of September. This sluggish market action, which is a characteristic of accumulation, suggests the continuing the trading range scenario has the highest probability of success.
If that happens, patience is the watchword and good market discipline should prevail.
Responses