Beginning To Rally
{section:title}Daily Pulse Of The Market Report{/section}
Today, instead of attaching the charts to the e-mail, we are embedding them into the e-mail itself. Hopefully, this will make it easier for you to review the charts and compare them to the commentary. Any comments or observations would be greatly appreciated.
What To Do?
Short Term:
Short term bulls, who entered the market, should maintain their positions.
There are no short-term positions to the downside.
Intermediate & Long Term:
Their are no intermediate or long term opportunities to the upside.
Long-term positions to the upside should be maintained.
There are no intermediate or long term opportunities to the downside
Market Trends:
Intra-day: Changed to Up
Short Term: Neutral.
Intermediate Term: Neutral
Long Term: Neutral
The stock market, as measured by the Wyckoff Wave, traded higher on decreased volume. It closed in the upper quarter of a wider price spread, in a neutral condition relative to the Technometer. The price spread and volume suggest a lack of supply.
A review of the intra-day waves indicates that while today was a lack of supply day, demand was present at the beginning and the end of the trading day.
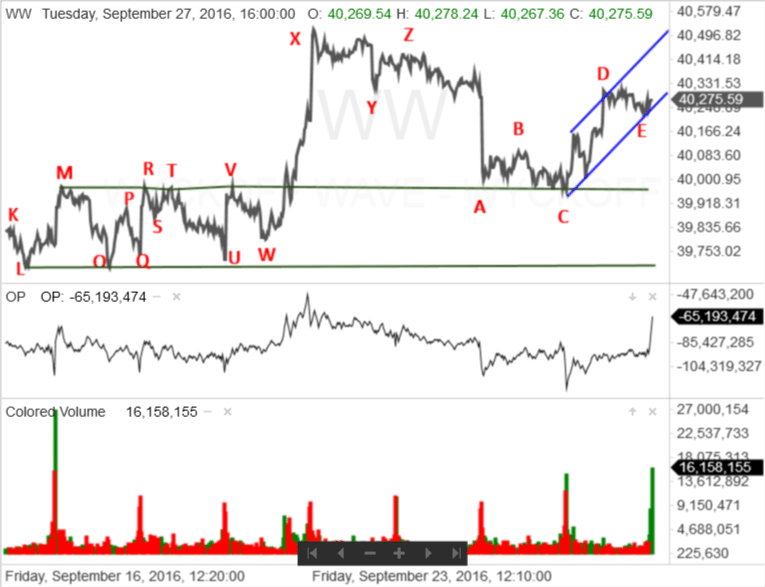
After a small gap opening to the upside, demand continued and the Wyckoff Wave rallied to point D. Then, the Wave reacted to point E. The reaction was on reduced price spread and volume and point E was only a few points lower than point D. Sideways reactions are often an indication that supply has dried up and the index or stock is prepared to move strongly to the upside. This could well be the case today.
Then, some demand returned and the Wyckoff Wave rallied for the last 40 min. of the trading day.
Today’s rally has changed the intra-day trend from neutral to up. The new trend channel is drawn in blue on the intra-day chart.
Today’s market action appears to be the beginning of the long awaited move to the upside. Tomorrow the Wyckoff Wave has an opportunity to test the highs at point X.
The Optimism – Pessimism Index rallied. It remains in a positive inharmonious action with the Wyckoff Wave when compared with point D.
The Force Index continues to rally and is producing moderate negative readings.
Tomorrow, the Technometer will open in a neutral condition.

Today, the Wyckoff Wave appears to have put in a successful intra-day Last Point of Support and is prepared to rally.
This gives the Wyckoff Wave an opportunity to rally past last weeks high at point L and test the highs at points J and H.
It will be important to watch the price spread and volume if, as expected, the rally continues on Wednesday. It appears supply has dried up and therefore, wider price spread normally occurs in this type of the situation.
It is also important to remember that it took the Wyckoff Wave almost 2 months to react to point K. It is doubtful it will rally back to the top the trading range in just a few days.
Presently the Wyckoff indicators are not providing clues as to the Wave’s future direction. This is also not unusual after a rally has begun.
However,, if the rally continues, the relative strength of the Optimism – Pessimism Index could create negative divergences or inharmonious actions as the rally continues. The neutral Technometer could also move into an overbought condition. These conditions and minor turning points need to be monitored as the move proceeds.
A vertical line chart with data back to the August 2015 Selling Climax is provided for a broader market perspective

Responses