Bitcoin trying to take a stand against the bears….
Many of you have heard about the Wyckoff Method of Technical Analysis. In the early 1900’s, Mr. Richard D. Wyckoff was a pioneer in reading of the tape, and including volume analysis in his chart studies. Many of Wyckoff’s basic tenets have become de facto standards of technical analysis that we use today. The concept of accumulation/distribution and the supremacy of price and volume in determining price movements are examples. With that in mind, lets quickly discuss the recent action of Bitcoin.
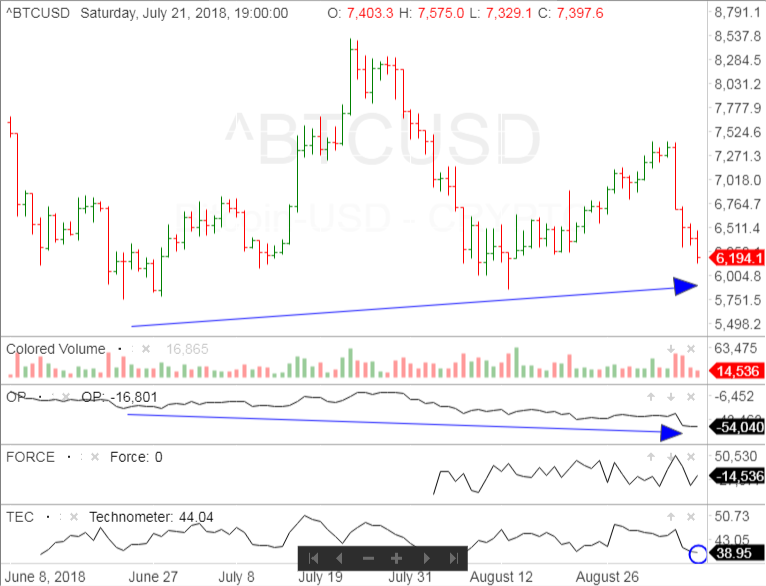
Bitcoin had a quick and sharp selloff from the $7,400 level in the last week. Coming in to the lows at $6,194, our proprietary indicators which consist of the Optimism-Pessimsim Index, the Force Index, and the Technometer, began showing signs of a short term bottom.
As you can see from the chart below, the Optimism-Pessimism Index (O-P) continued to hit new lows in its downtrend as shown by the blue arrow, but the price of Bitcoin has continued to maker higher lows as shown by its blue arrow. The O-P , is a line chart illustrating the accumulated net result of supply and demand as expressed by the positive and negative volume occurring in each intra-day move.
As this positive divergence was occuring our Technometer, which measures overbought/oversold, registered an oversold reading of 38. The underlying concept at work with the Technometer is that the vulnerability to a change in direction increases as the market or stock becomes more overbought or oversold. The oversold reading of 38 says that it is vulnerable to a change in direction.
These days, there are many overbought/oversold indicators to choose from. The age of computerization is responsible for all these choices. The WyckoffSMI Technometer has an advantage over all of them. It considers each day of market action from the standpoint of buying and selling waves (demand and supply), which is shown by the OP. All of the others tend to view the market action from the standpoint of arbitrary time increments and to consider only the net effect of these increments (price only). The WyckoffSMI Technometer considers all three of the important variables – price, volume and time
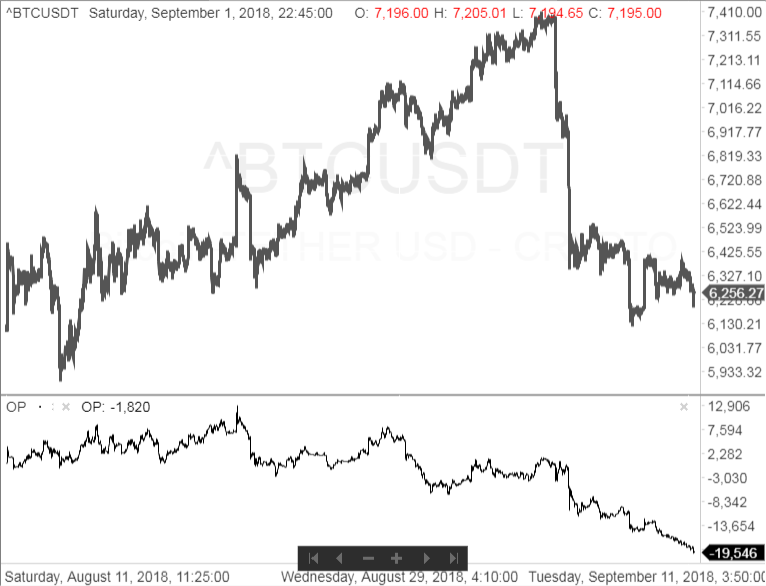
You can see if we magnify in on the daily chart to a 5 minute chart, it also shows that OP continuing to hit new lows for the move. While Bitcoin has stabilized and testing its previous low at $6,120. Once again, this is a bullish divergence between price and volume. Volume as shown, is from up to 95 exchanges and the best look we have of overall volume being traded on Bitcoin.
You can also observe from this intraday line chart that we had previous support in the $6,250 level back in the middle of August. That lead to the rally to the most recent high at $7,400.
We also know that Bitcoin short positions are at an elevated level, and if we can get Bitcoin to rally here as expected, I’m sure it would force some shorts to cover as well.
Good Trading,
Todd Butterfield – WyckoffSMI.com , LearnCrypto.io
Bitcoin had a quick and sharp selloff from the $7,400 level in the last week. Coming in to the lows at $6,194, our proprietary indicators which consist of the Optimism-Pessimsim Index, the Force Index, and the Technometer, began showing signs of a short term bottom.
As you can see from the chart below, the Optimism-Pessimism Index (O-P) continued to hit new lows in its downtrend as shown by the blue arrow, but the price of Bitcoin has continued to maker higher lows as shown by its blue arrow. The O-P , is a line chart illustrating the accumulated net result of supply and demand as expressed by the positive and negative volume occurring in each intra-day move.
As this positive divergence was occuring our Technometer, which measures overbought/oversold, registered an oversold reading of 38. The underlying concept at work with the Technometer is that the vulnerability to a change in direction increases as the market or stock becomes more overbought or oversold. The oversold reading of 38 says that it is vulnerable to a change in direction.
These days, there are many overbought/oversold indicators to choose from. The age of computerization is responsible for all these choices. The WyckoffSMI Technometer has an advantage over all of them. It considers each day of market action from the standpoint of buying and selling waves (demand and supply), which is shown by the OP. All of the others tend to view the market action from the standpoint of arbitrary time increments and to consider only the net effect of these increments (price only). The WyckoffSMI Technometer considers all three of the important variables – price, volume and time
You can see if we magnify in on the daily chart to a 5 minute chart, it also shows that OP continuing to hit new lows for the move. While Bitcoin has stabilized and testing its previous low at $6,120. Once again, this is a bullish divergence between price and volume. Volume as shown, is from up to 95 exchanges and the best look we have of overall volume being traded on Bitcoin.
You can also observe from this intraday line chart that we had previous support in the $6,250 level back in the middle of August. That lead to the rally to the most recent high at $7,400.
We also know that Bitcoin short positions are at an elevated level, and if we can get Bitcoin to rally here as expected, I’m sure it would force some shorts to cover as well.
Good Trading,
Todd Butterfield – WyckoffSMI.com , LearnCrypto.io

Responses