Some Clues From A Dull Week
Technical Analysis of Stock Trends, The Wyckoff Wave – Week in Review November 18 2016
This past week, the Wyckoff Wave moved sideways. At Friday’s close it was only 63 points higher than the close on the preceding Friday. Volume decreased noticeably. This made for a rather dull week. Stock traders enjoy price movement and there wasn’t much present during the last five trading days.
However, the Wyckoff Wave did provide some clues, that may result in some answers, when attempting to determine the market’s future direction.
Two weeks ago, the Wyckoff Wave rallied strongly off the support line, drawn from point D. The rally was on good price spread and volume. It also moved past the halfway point of the latest trading range phase that began at point D. This suggested the Wave was putting in a Sign of Strength, within a trading range, and if there was a reaction to a Last Point of Support, also within the trading range, we might see a nice move to the upside.
While it is not common, ending action in an accumulation trading range does not always need a Spring. There can simply be a Sign of Strength off the support at the bottom of the range. This would be followed by a reaction, on reduced price spread and volume, to a Last Point of Support.
Then, the ending action needs to be confirmed by a second Sign of Strength. This rally would drive the Wyckoff Wave through the top of the trading range. In Wyckoff terminology, this is called a “Jump Across The Creek”. The Creek Jump would then need to be followed by a second reaction that would end in the area of the resistance line at the top of the trading range. This is drawn from point E on the vertical line chart. This reaction could lead to a second, and more important, Last Point of Support
This is a four step process. So far, only step one has been completed.
This week’s question is, Will the Wyckoff Wave react on reduced price spread and volume and put in the first Last Point of Support? Clues to the answer can be found in this past week’s market action.
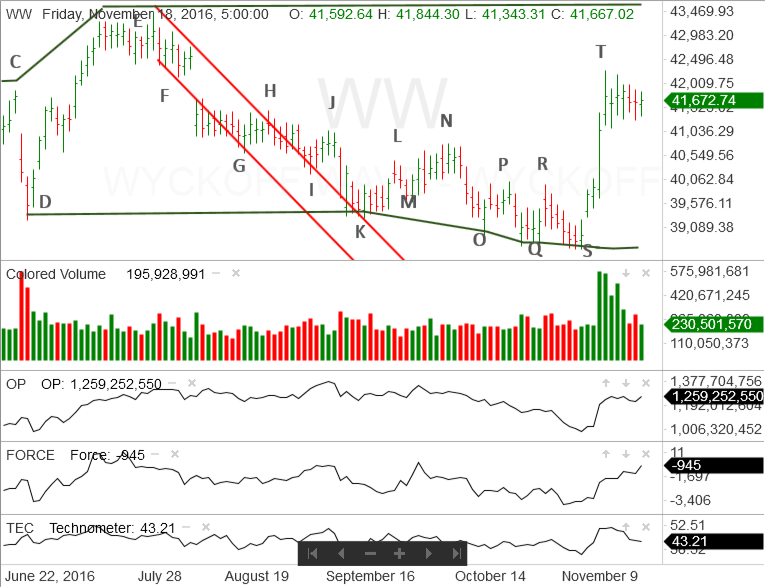
Last Thursday’s rally to point T ended with the appearance of supply. On Friday and Monday, there was a battle between supply and demand. Notice the relatively increased price spread and noticeably increased volume. When this happens and the Wyckoff Wave moves sideways, it is usually an indication that some distribution is taking place.
This is clue number one and is a good indication that the Sign of Strength rally has been completed.
The rest of the week brought noticeably narrow price spread and reduced volume. Notice the lower intra-day tops and relatively sluggish market action. This suggests a minor change in character. Because supply has come into the market, it is reasonable to conclude the next market move will be some sort of a reaction.
A review of the intra-day waves, on Wednesday, Thursday and Friday, showed a similar pattern. Supply came into the market during the morning. It soon dried up and the Wyckoff Wave attempted to rally. During each of these three days, the afternoon rallies were on a lack of demand. This also suggests the Wyckoff Wave will most probably react, before another significant rally, back to the top of the trading range, begins.
Assuming that scenario plays out, the more important question is, “Where will the reaction end?’
On Friday, the Technometer was in a low neutral condition. It is logical to assume that any reaction will quickly move the Technometer into an oversold condition. It is also possible it could become more oversold than it was at point S. If that happens and the Wyckoff Wave holds above point S, it would be an extremely positive indication.
The Force Index was producing moderately negative readings at point S. Since then the readings have improved and the Force Index is now producing low negative readings. It is an extremely positive indication if the Technometer moves into an oversold condition and the Force Index is producing low negative or positive readings.
It is important that a successful reaction to a Last Point of Support end at or above the halfway point of the Sign of Strength rally. In this case it is the move from point S to point T.
The halfway point of that move is in the area of points R and P. Originally, they were originally minor resistance points as the Wyckoff Wave was unable to rally off point O and Q. However, that was eliminated on the rally to point T and they are now areas of support.
It is reasonable to conclude that if the Wyckoff Wave reacts into the support area marked by points R and P, the Technometer will be in an oversold condition. This suggests the reaction to a Last Point of Support scenario has a good probability of success.
While nothing is guaranteed, it would be important to watch the quality of the expected reaction to see if it begins to meet the criteria described above. If so, a Last Point of Support is a great place to take new positions to the upside.
If the above scenario does not play out, the Wyckoff Wave will simply retest the bottom of the trading range and continue moving sideways.
However, we may be encountering a wonderful opportunity in which to take new short, intermediate and long term positions to the upside.
Responses