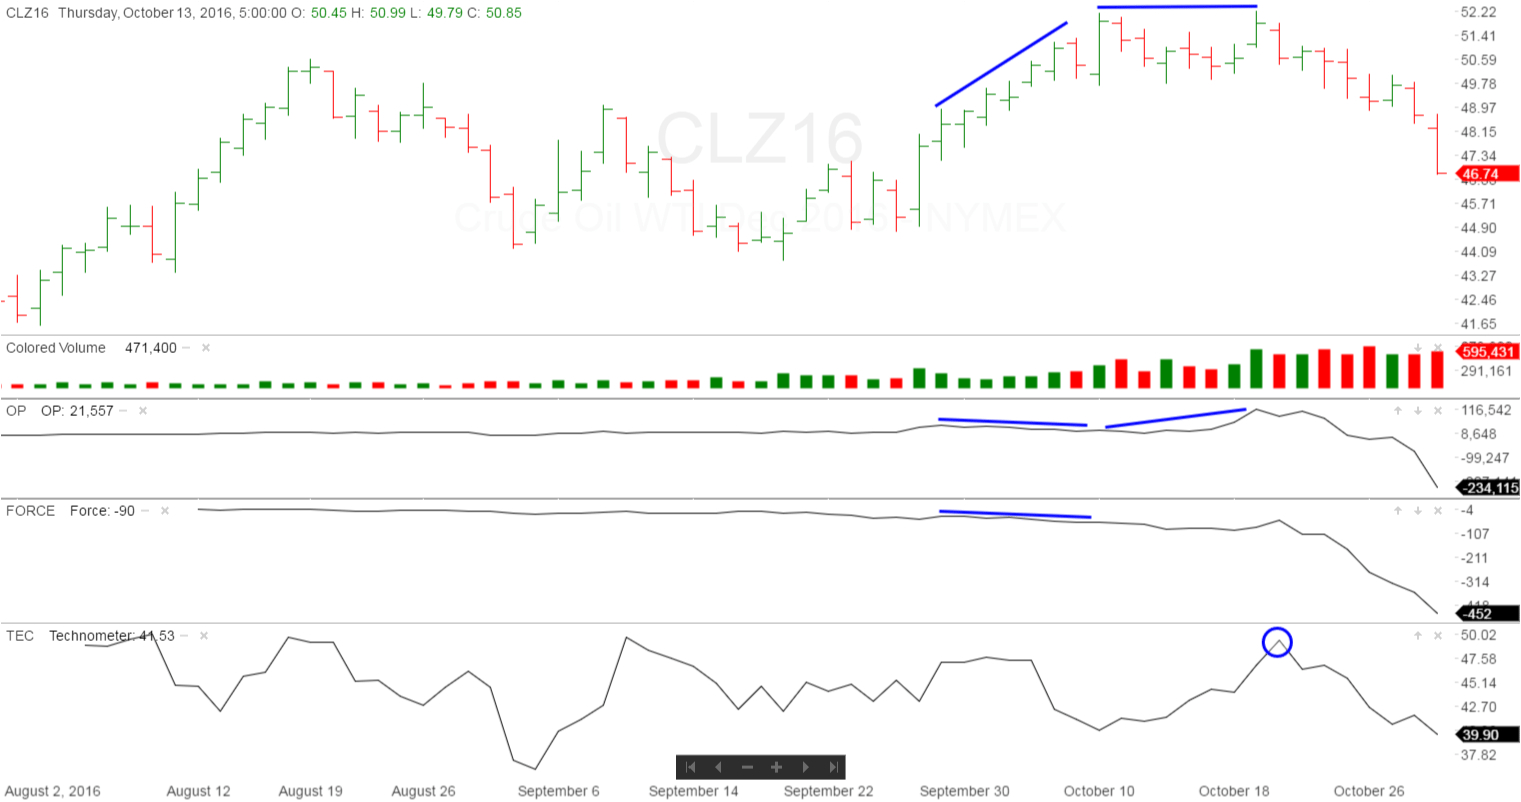
A current example of a Wyckoff “Double Divergence”
The following chart shows a recent double divergence between the OP/Price for December Crude Oil Futures. This setup is discussed on our online course “Wyckoff Wave Unleashed”, Lecture 10, and shown on Chart 14.
You can see that as the Technometer reached overbought at the blue circle, the price made its final high, and has been in a sustained downtrend since. It is now entering oversold territory, so we would expect a corrective rally.

Responses