Drilling Down Into The Intra-day
Technical Analysis of Stock Trends, The Wyckoff Wave – Week in Review October 28, 2016
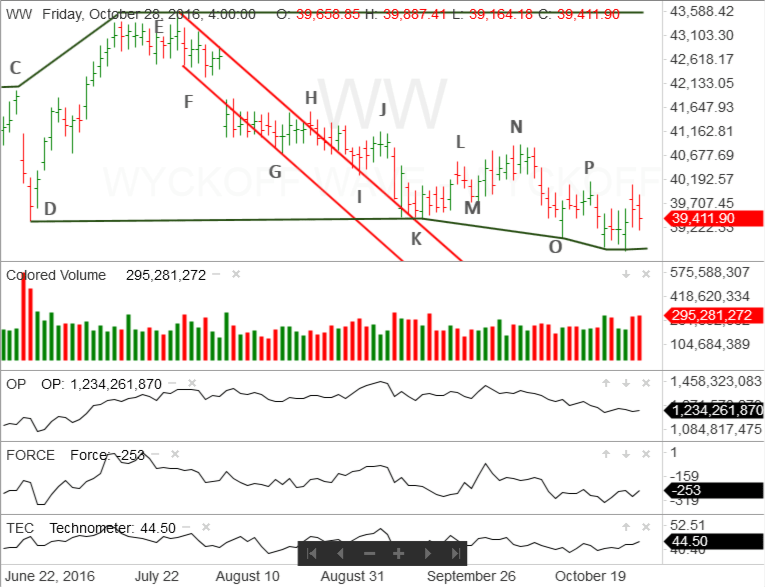
This past week, the stock market, as measured by the Wyckoff Wave, began to rally off the support line, drawn from point D, that marks the latest phase of the trading range, which began in late August, 2015.
After a reaction from the top of the range, down to point K. The Wyckoff Wave has moved sideways for the past couple of months. While it is made several attempts to rally, each time the Wave has encountered supply and was unable to make much progress to the upside.
When analyzing a trading range, the Wyckoff student looks for some sort of ending action that would suggest the market is ready to make a more substantial move, either up or down. This ending action can come in the form of a Spring, an Upthrust, a Sign of Strength or a Sign of Weakness.
At point O, it seemed the Wyckoff Wave was putting in a Spring. It reacted below point K, demand came into the market and the Wyckoff Wave rallied.
However, once again the Wyckoff Wave ran into supply at point P and reacted back to test the lows at point O. This failure eliminated the Spring scenario from consideration. It also created the two new scenarios that were discussed last week. The Wyckoff Wave could put in another attempt to Spring the support or, more probably, it would simply continue to take in supply and, when that was sufficiently reduced, rally back towards the top of the trading range.
A look at this past weeks market action on the vertical line chart shows the Wyckoff Wave met support in the area of point O and made an attempt to rally. On Friday, it reacted on a slightly narrower price spread and slightly increased volume.
A reaction on narrower price spread and higher volume, suggest the presence of demand. However, that must be confirmed by an intra-day analysis.
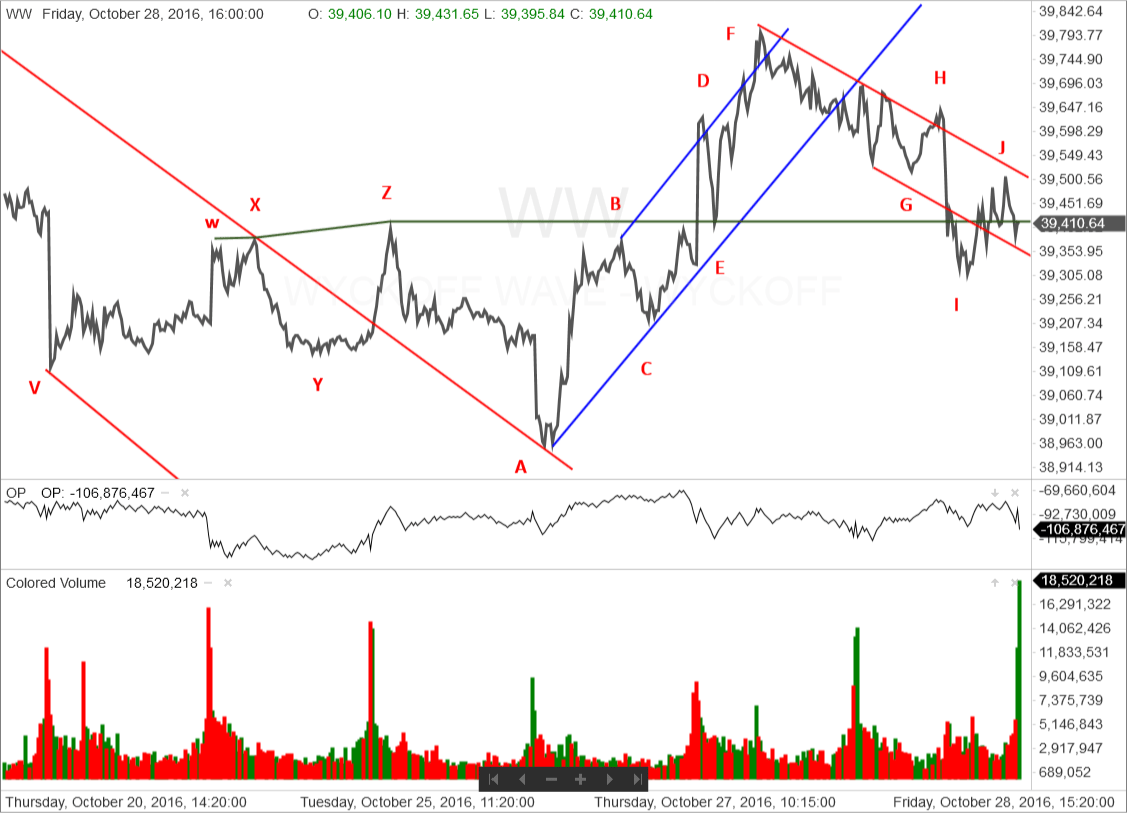
A look at the intra-day line chart revealed some interesting information. This past Tuesday, the Wyckoff Wave reacted to point V and began a two-day intra-day trading range. The reaction to point A was an intra-day Spring. Then the Wyckoff Wave rallied to point B and tested the spring at point C.
The intra-day rally to point F was an intra-day Sign of Strength. Then the Wyckoff Wave began to react in an attempt to put in an intra-day Last Point of Support.
It is extremely important to understand that an intra-day Spring is not nearly as significant as a Spring that suggests ending action and a more significant move to the upside. However, it can provide some clues as to how the Wyckoff Wave will behave on a longer-term basis.
It is also important to understand that while an Index or stock may go through a Spring and a successful Secondary Test, that does not necessarily guarantee a continued move to the upside. The key is always a successful Last Point of Support.
In this case, the reaction off point F began on relatively reduced price spread and volume. By Thursday’s close it was testing the support line of its intra-day up trend channel and appeared to be in the process of putting in a successful Last Point of Support.
Things changed on Friday. The Wyckoff Wave continued to react to point G, on the intra-day chart. Notice the increase of both price spread and volume. This suggests supply is coming into the market. It is also coming in at just the wrong time.
Demand was withdrawn on the intra-day rally to point H. More supply came into the market and the Wyckoff Wave reacted sharply to point I. This placed the Wyckoff Wave slightly below the top of the resistance line that marked the top of the intra-day trading range. It was not enough to eliminate the reaction to a Last Point of Support scenario, but it certainly put in jeopardy.
Some demand came back into the market and the Wyckoff Wave rallied to point J. Then it reacted on high volume, but narrower price spread. This suggests the presence of some demand.
The Wyckoff Wave is in a critical position. Despite the presence of some demand, on Friday afternoon, supply still dominates the market.
Monday morning will be critical. If the Last Point of Support scenario is going to be successful, the Wyckoff Wave must hold above point I. Then it needs to rally and at least weaken the intra-day down trend channel..
If supply remains, look for the Wyckoff Wave to react and test the lows at point A. This would eliminate the intra-day Spring scenario.
The presence of supply suggests the reaction back into the intra-day trading range and the test of point A has the highest probability of success.
If that happens, the Wyckoff trader can then continue to watch the intra-day trading range and look for intra-day ending action. That may also provide a clue to what the Wyckoff Wave will be doing on a longer-term basis.
The low at point A is also Wednesday’s low on the vertical line chart.
Even if the Wyckoff Wave reacts and eliminates the intra-day Last Point of Support scenario, the Wyckoff Wave is still expected to hold at or around the support line drawn from point D. While supply is certainly present, it does not appear to be strong enough or sustained enough to drive the Wyckoff Wave through that support.
Responses