

A Lackluster Lack Of Demand Day

Monday, October 3, 2016
What To Do?
Short Term:
Short term bulls, who entered the market, should maintain their positions.
There are no short-term positions to the downside.
Intermediate & Long Term:
Their are no intermediate or long term opportunities to the upside.
Long-term positions to the upside should be maintained.
There are no intermediate or long term opportunities to the downside
Market Trends:
Intra-day: Neutral
Short Term: Neutral.
Intermediate Term: Neutral
Long Term: Neutral
The stock market, as measured by the Wyckoff Wave, traded higher on decreased volume. It closed in the upper half of a wider price spread, in a neutral condition relative to the Technometer. The price spread and volume suggest a lack of supply.
A review of the intra-day waves indicates that today was a lack of demand day.

After a gap opening to the downside and a brief, five-minute follow-through to point N, some demand came into the market and the Wyckoff Wave rallied to point O. Point O was slightly lower than point M.
Then, demand was withdrawn, and the Wyckoff Wave moved sideways for the rest of the trading day.
Today’s lack of demand suggests the Wyckoff Wave has encountered short-term resistance. The resistance line is drawn through points O, M, L, H and F.
Today’s inability to rally through that resistance suggests the Wyckoff Wave will react and test the lows at points K and I.
The Optimism – Pessimism Index reacted. It is in a very short-term negative divergence with the Wyckoff Wave when compared with point L.
The Force Index continues to post moderate negative readings.
Tomorrow, the Technometer will open in a neutral condition.
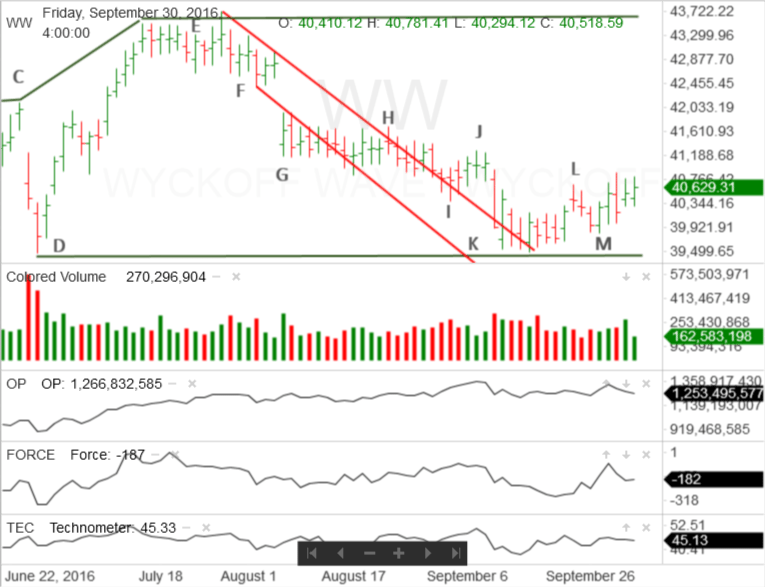
Today, the Wyckoff Wave made another attempt to rally and saw demand withdrawn. Like the intra-day analysis, this makes the Wyckoff Wave vulnerable to more supply coming into the market.
This continues to suggest that the Wyckoff Wave needs to react to dry up supply and even test the lows at point M, or the support line drawn from point D. Until the overhanging supply is dried up, it will be difficult for the Wyckoff Wave to advance.
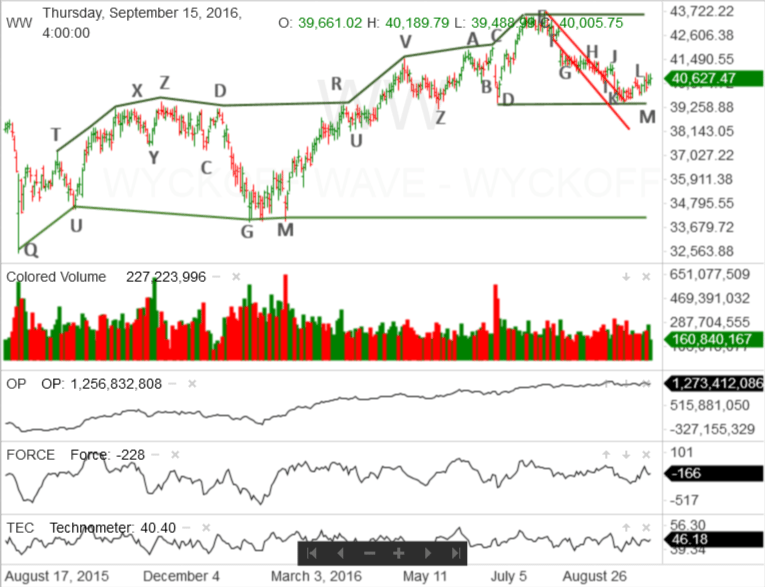
This is a very short-term observation and is part of a longer-term sideways movement within a defined trading range. While the trading range is divided into several phases, it began over a year ago with a Selling Climax at point Q. Point Q is on the longer-term vertical line chart. The trading range is defined on the longer-term vertical line chart, with both the resistance and support line drawn in green.
Presently it is important to watch the latest phase that began at point D.
So far, this trading range has the earmarks of accumulation. At some point there will be ending action and the Wyckoff Wave will begin a significant move, most probably to the upside.
Responses