Choose From The Following Tabs...
History Of Wyckoff SMI
The story of Richard D. and Wyckoff Stock Market Institute began in the 1880’s. Back then, the stock market was a very small affair that was pretty much controlled by few professional traders. The stock market’s small size made their trading manipulations more visible than today. While much has changed over the years and the manipulation by professional traders and large interests are more difficult to uncover, they are still there and provide excellent opportunities for those who know where to look.
The late 19th and early 20th century featured well-known professional investors like William Rockefeller and his allies, J.P. Morgan and other banking interests. Bucket shops were in operation for those with relatively small amounts of money.
Those dealing with the bucket shops were not actually trading shares of stock. They simply made side bets on the direction in which they expected a stock to move.
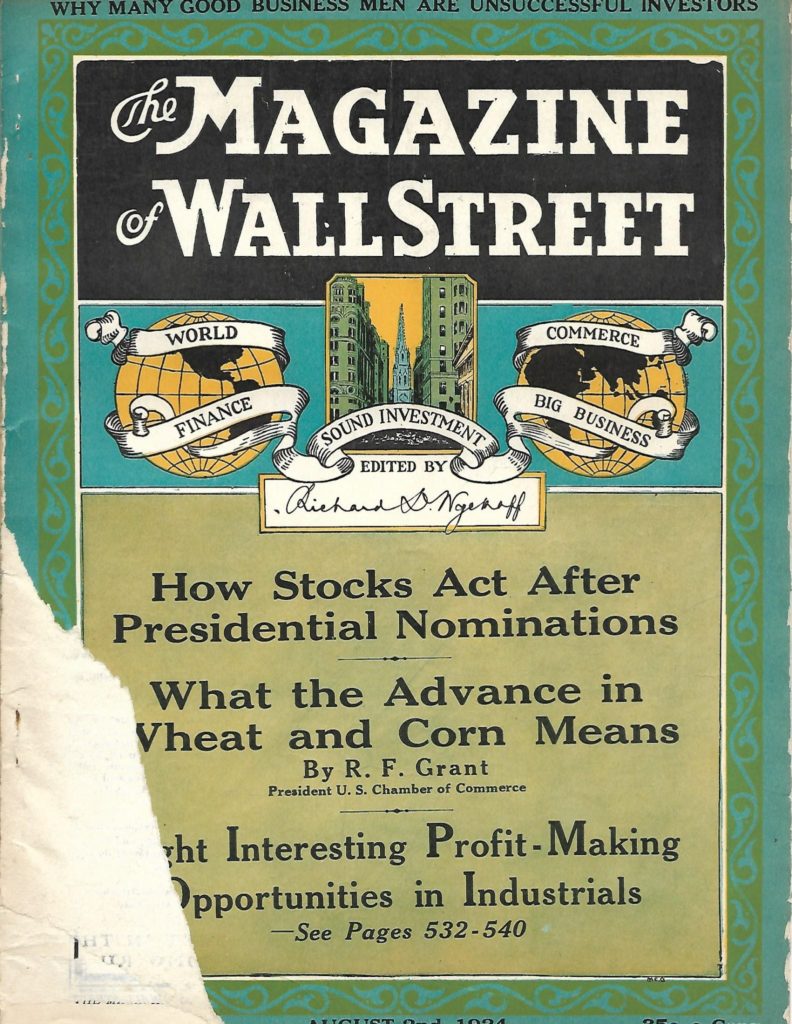
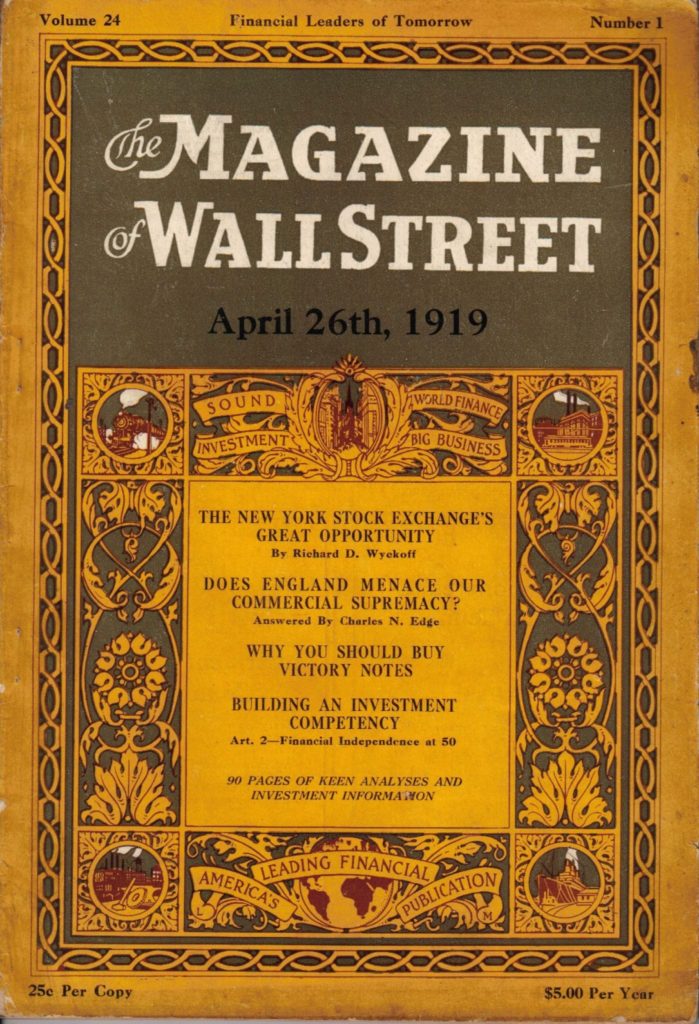
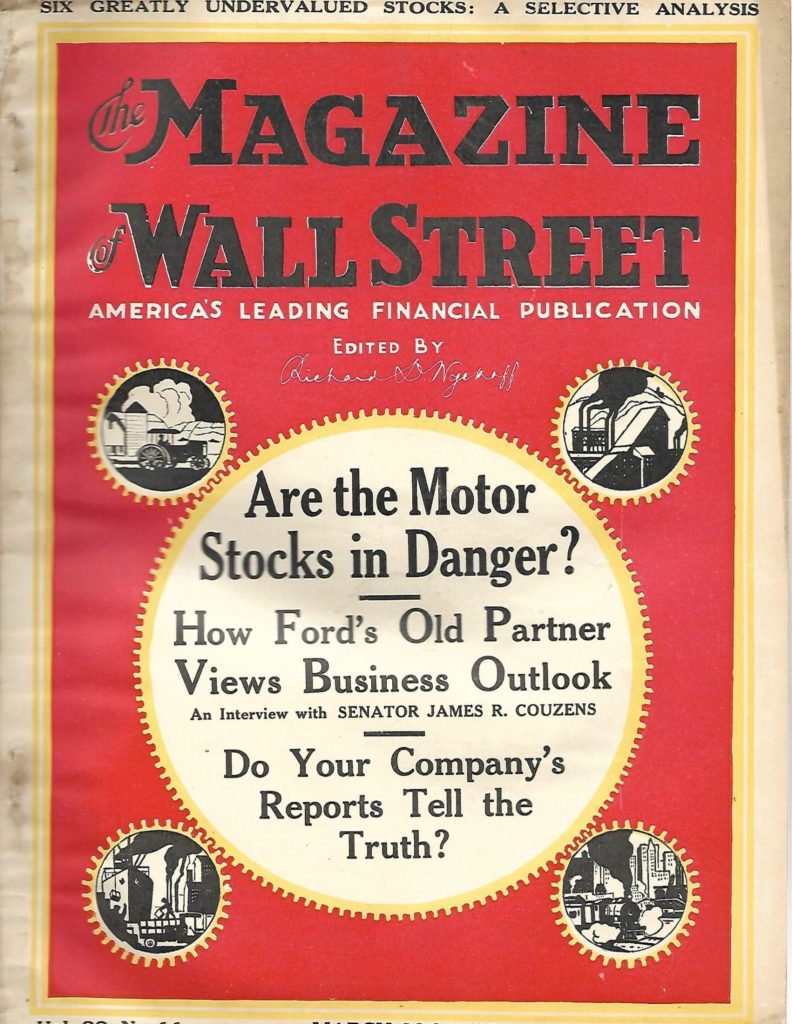
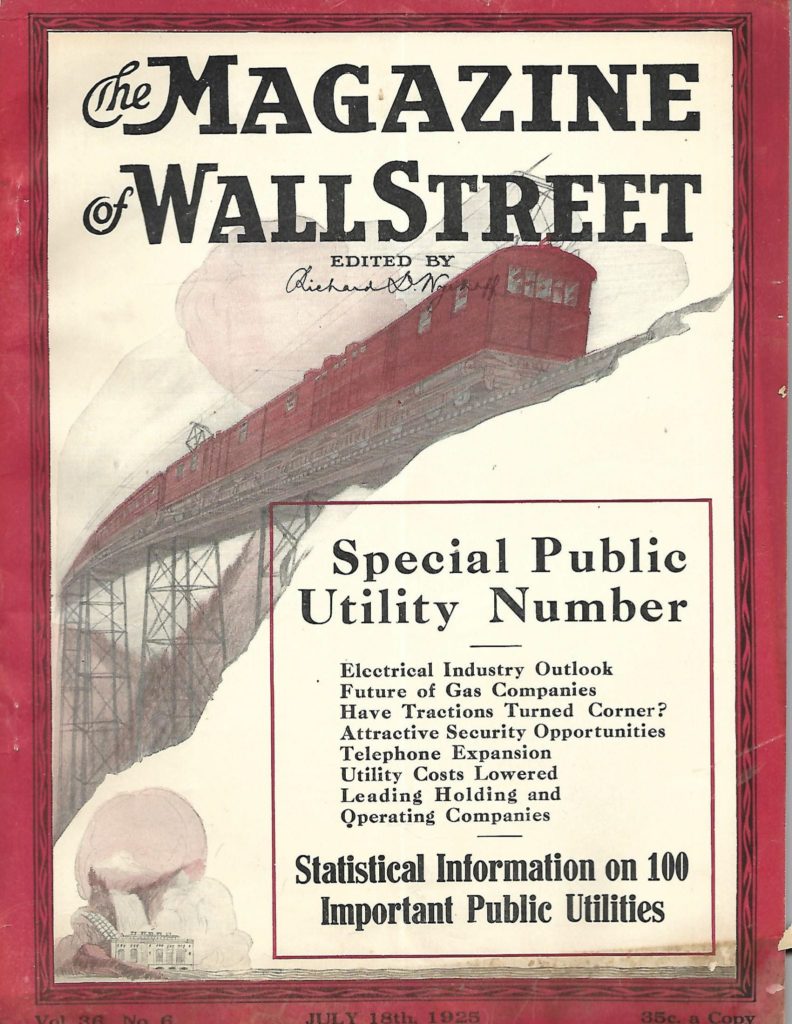
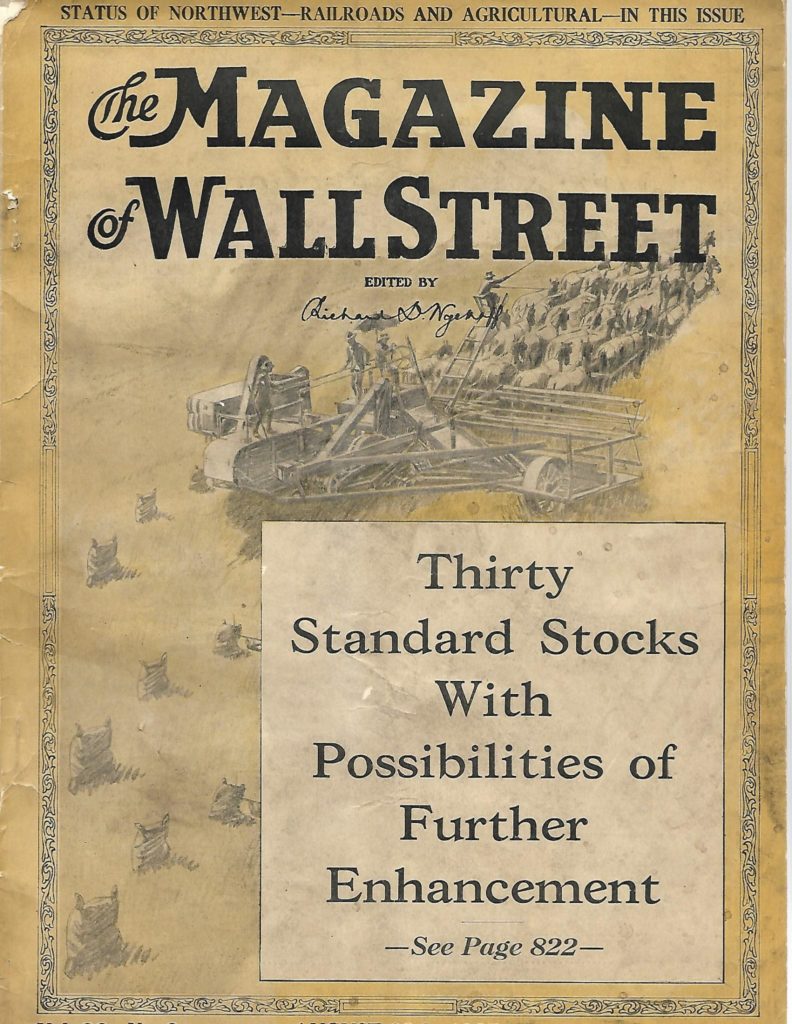
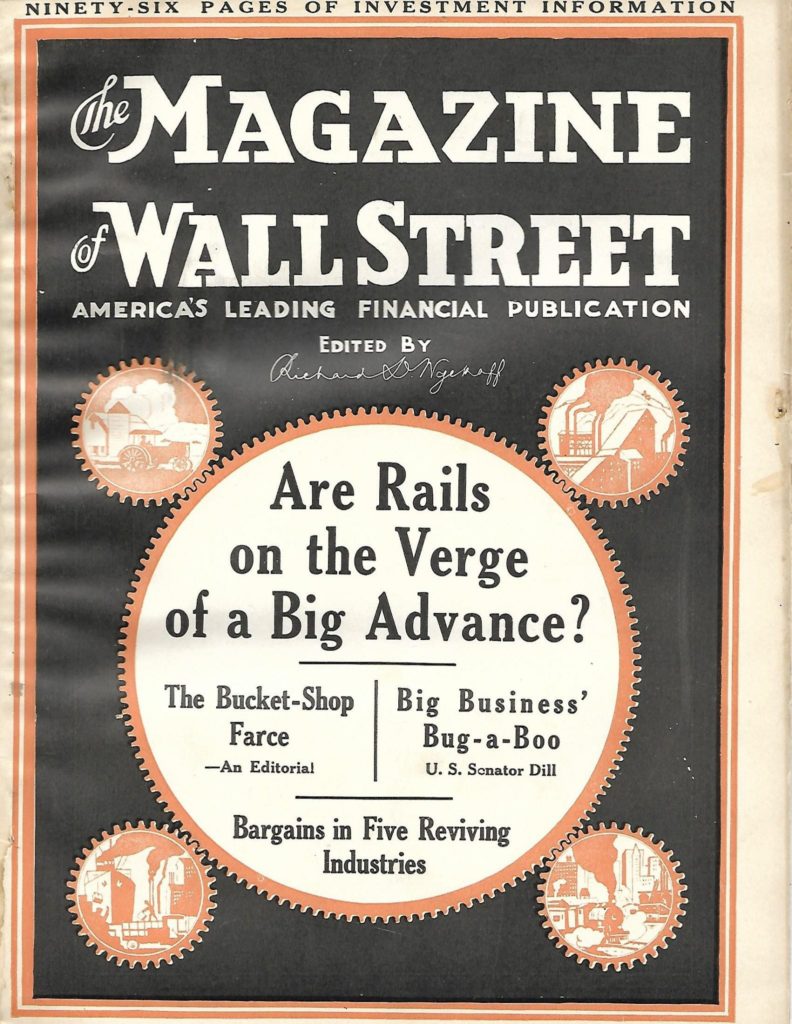
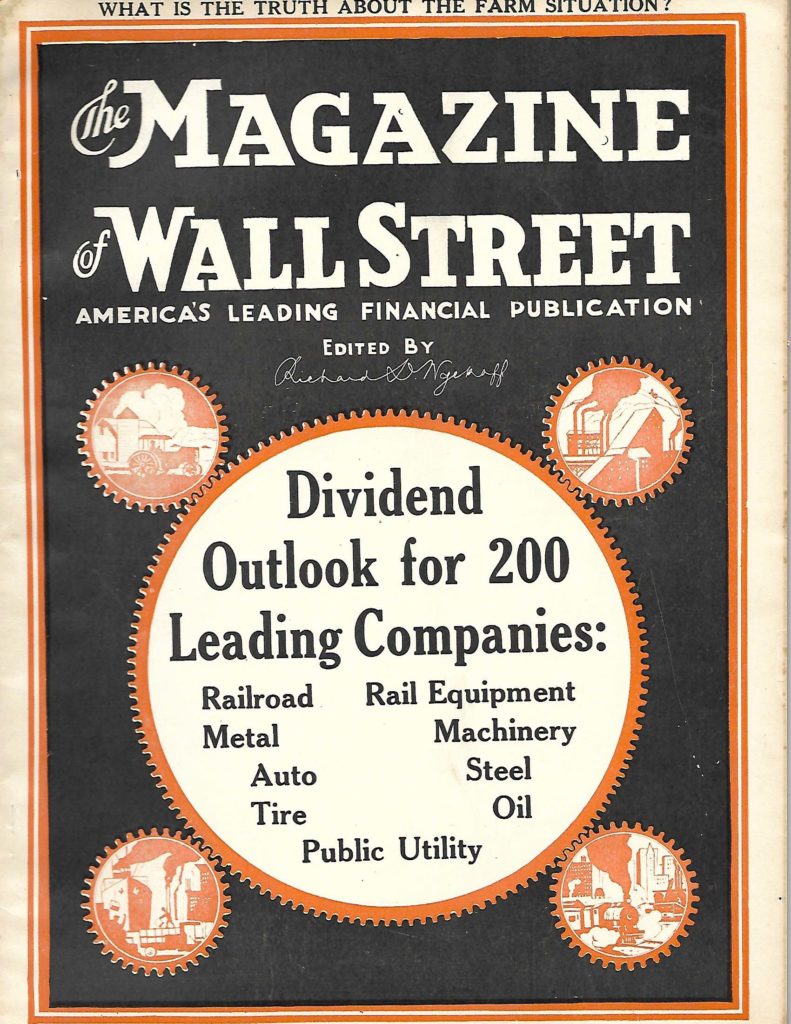
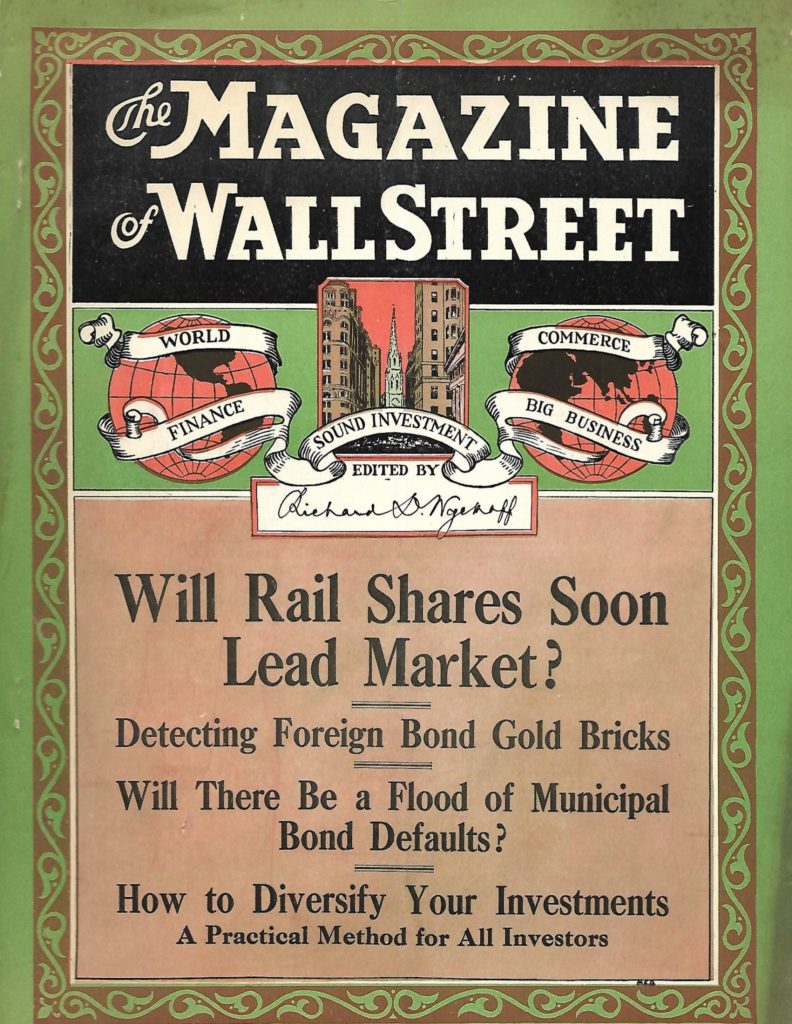
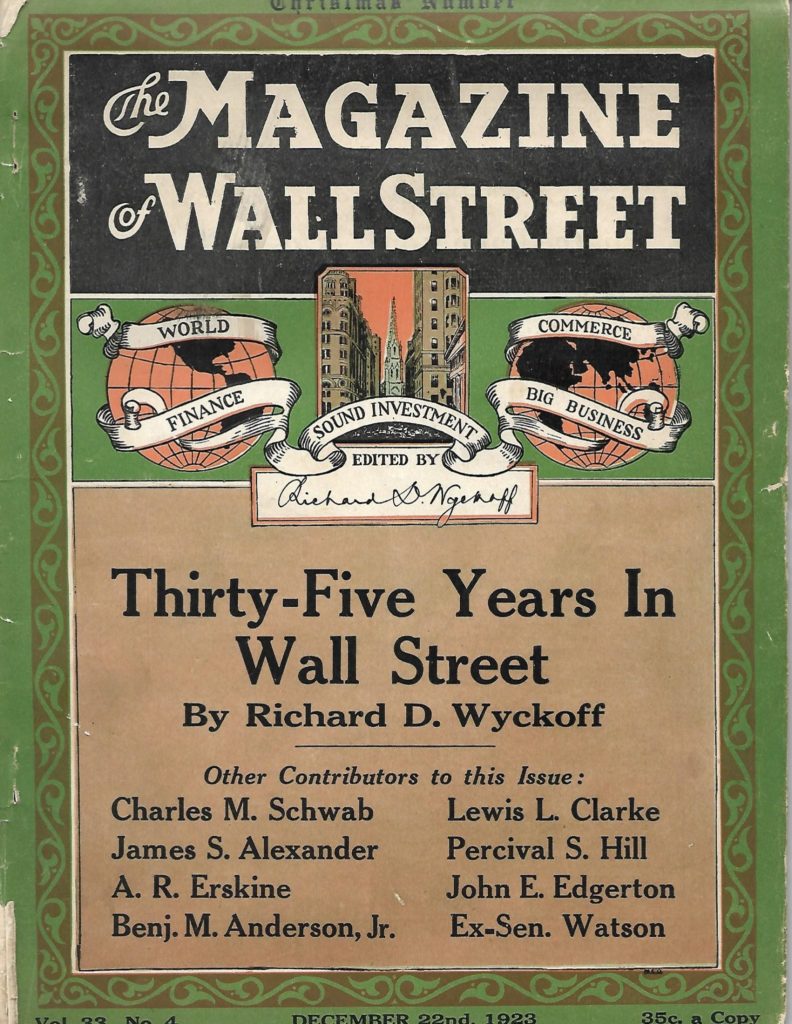
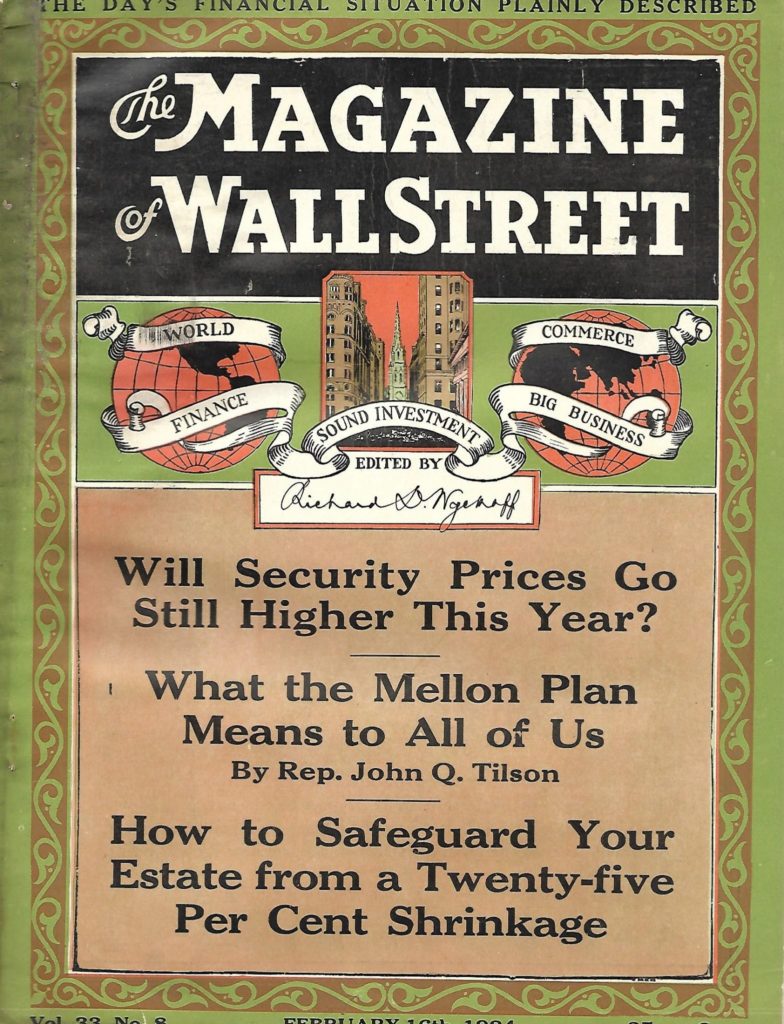
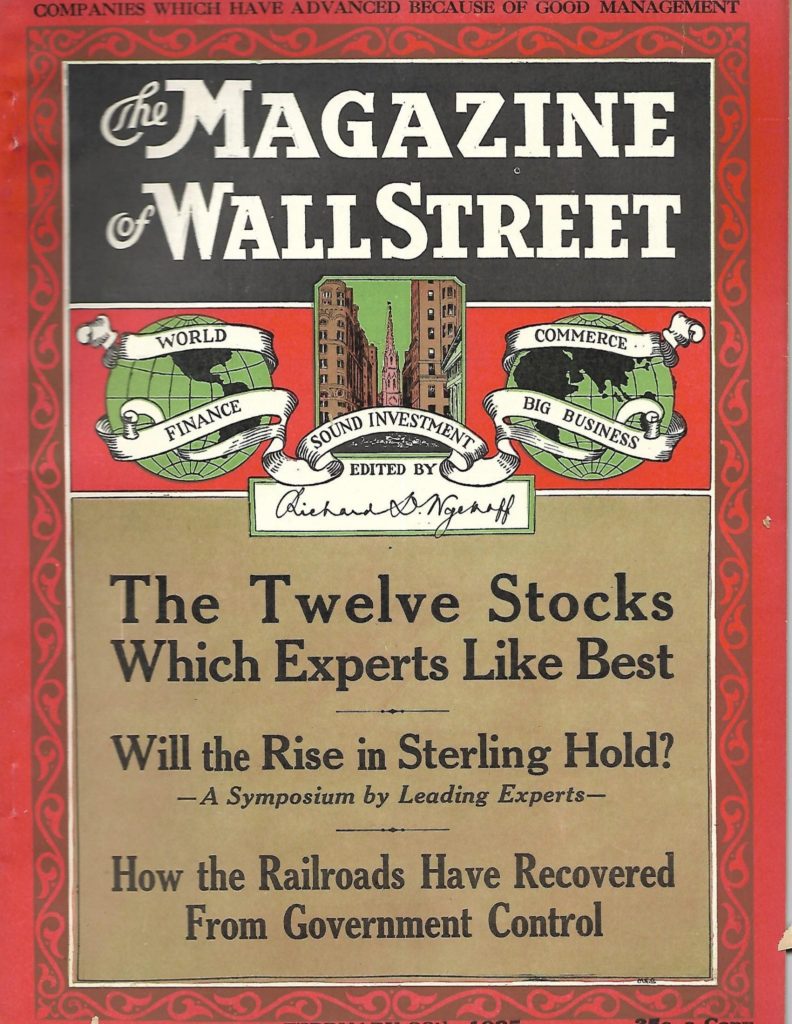
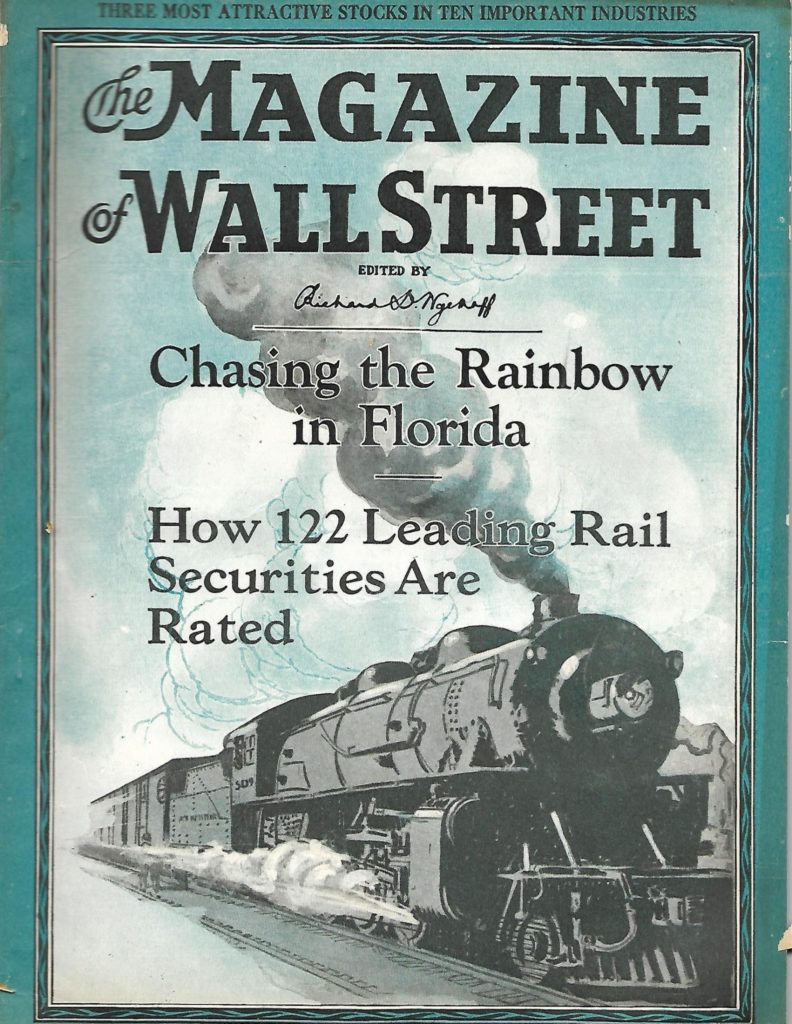
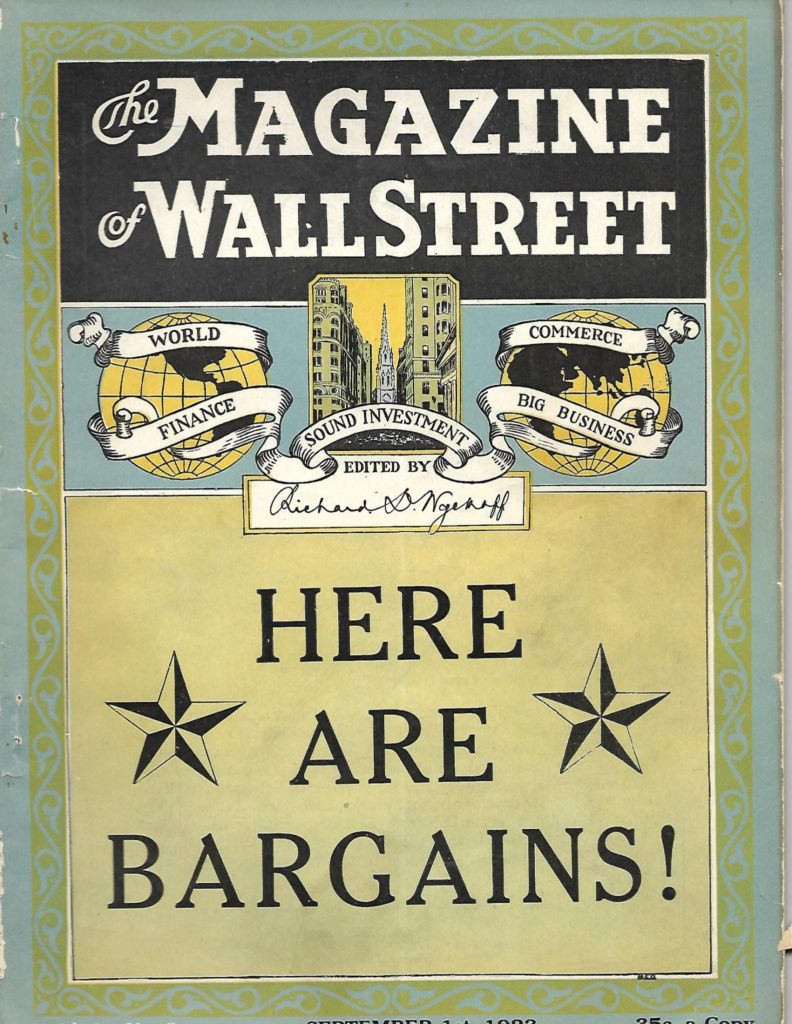
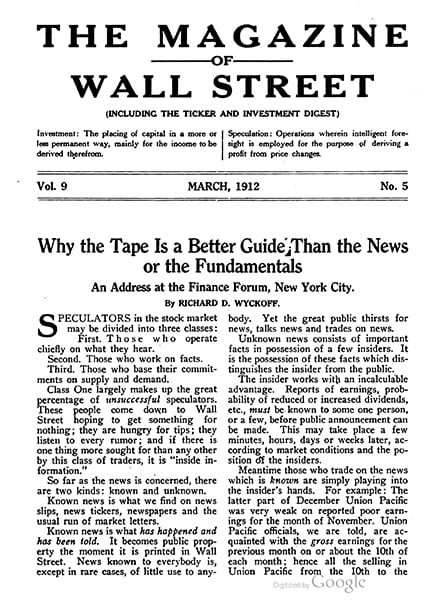
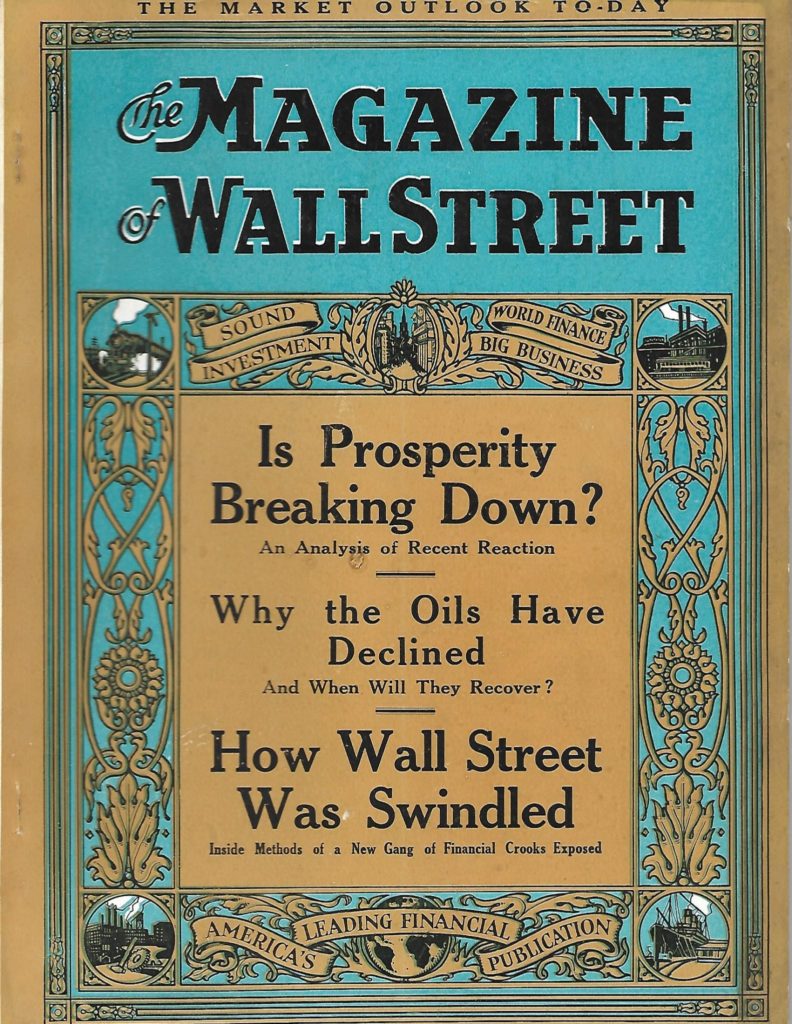
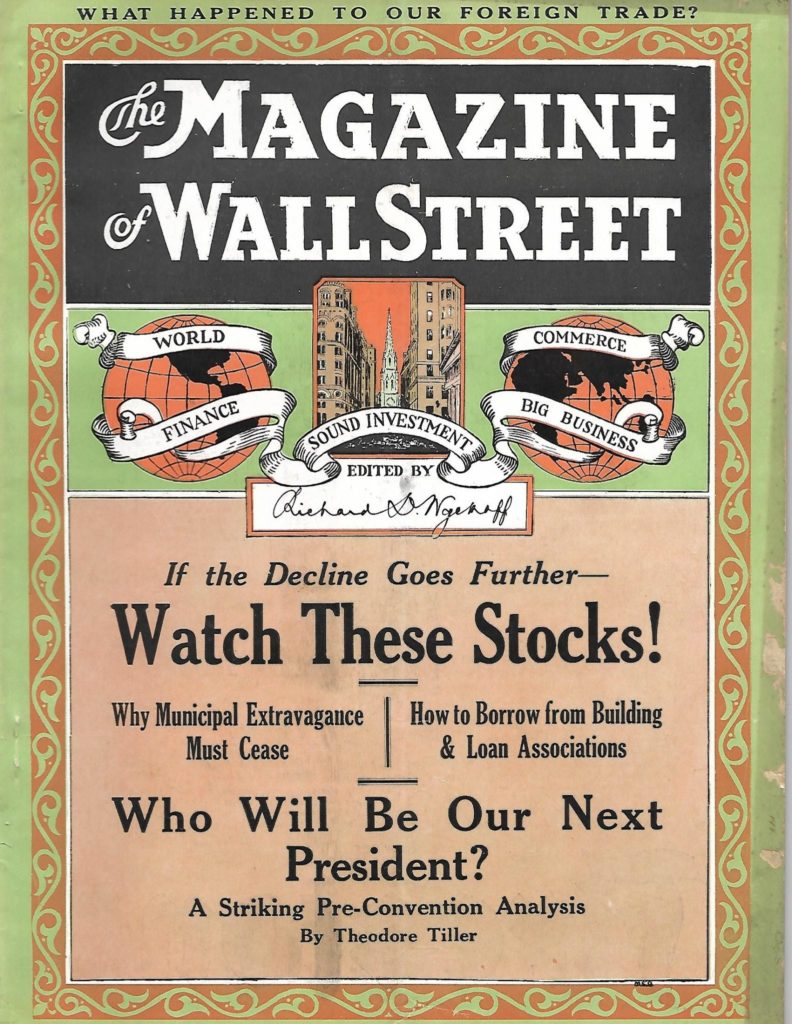
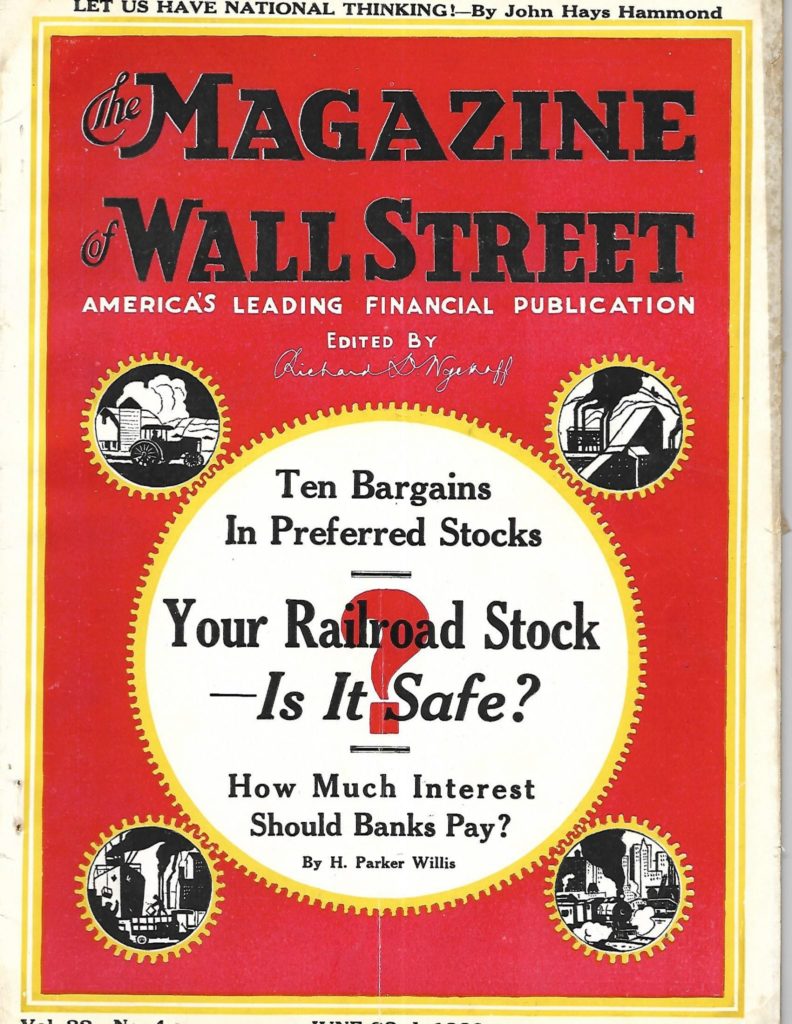
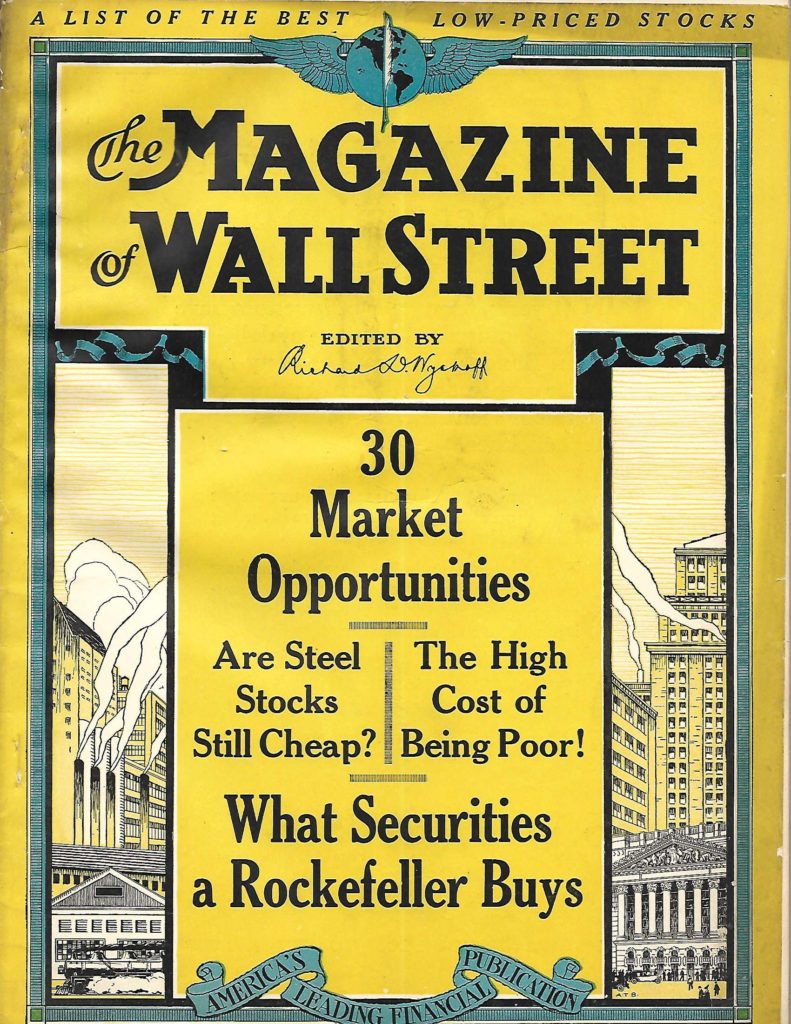
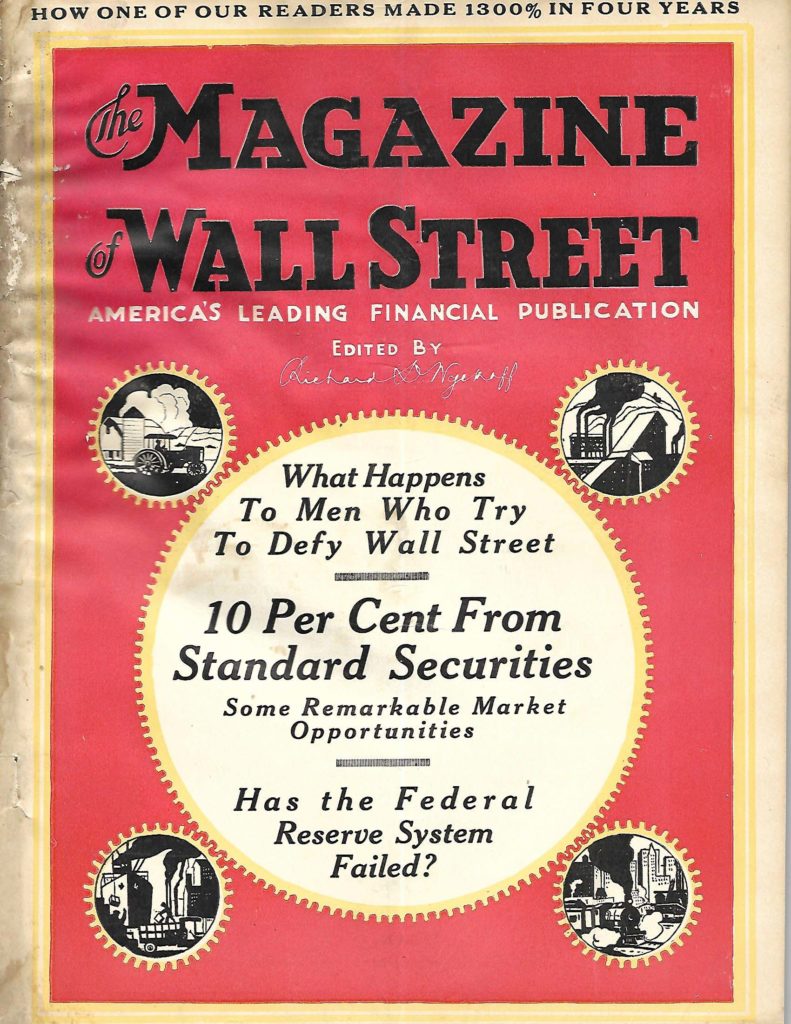
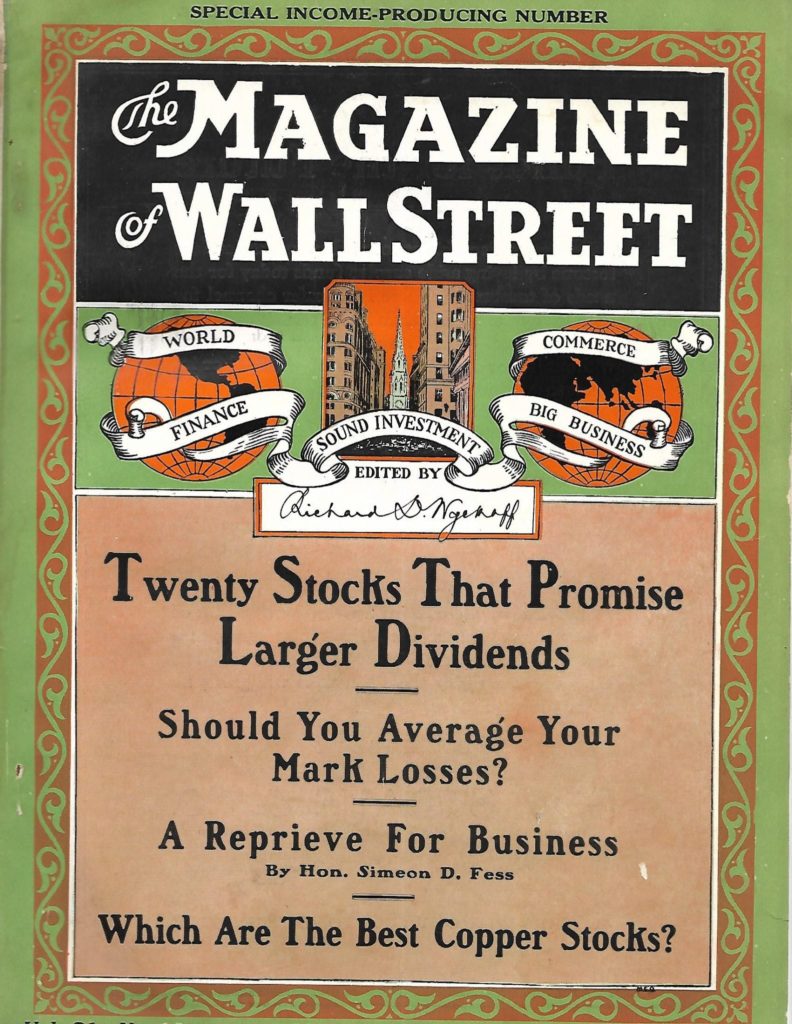
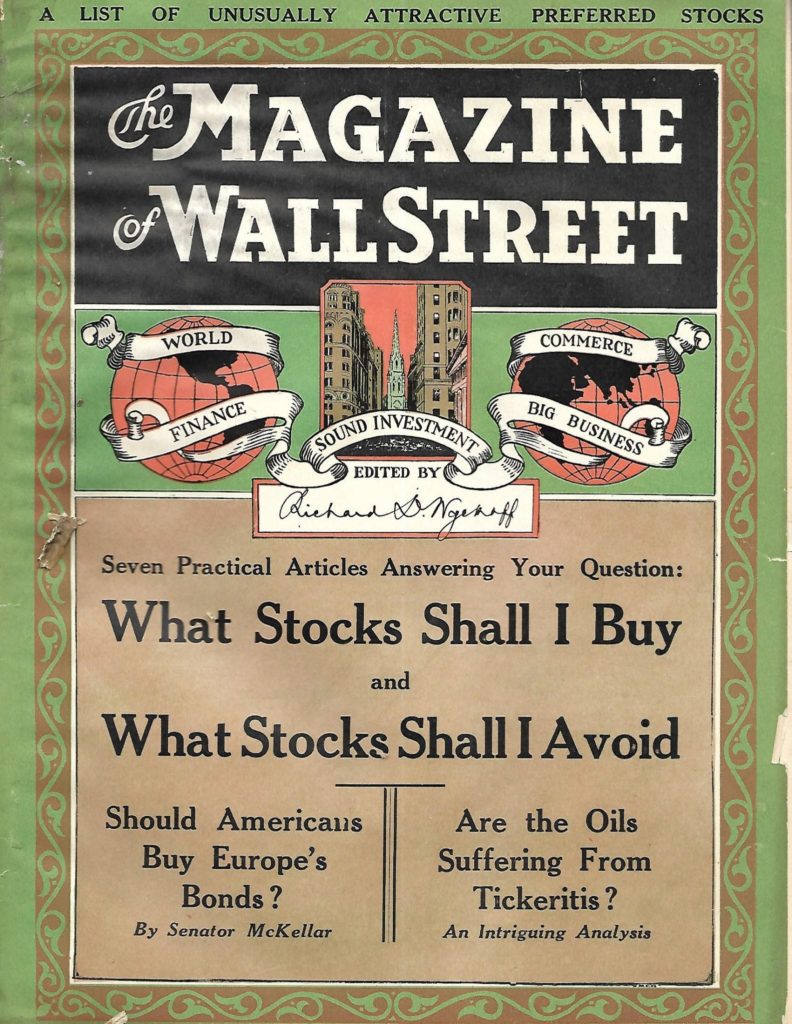
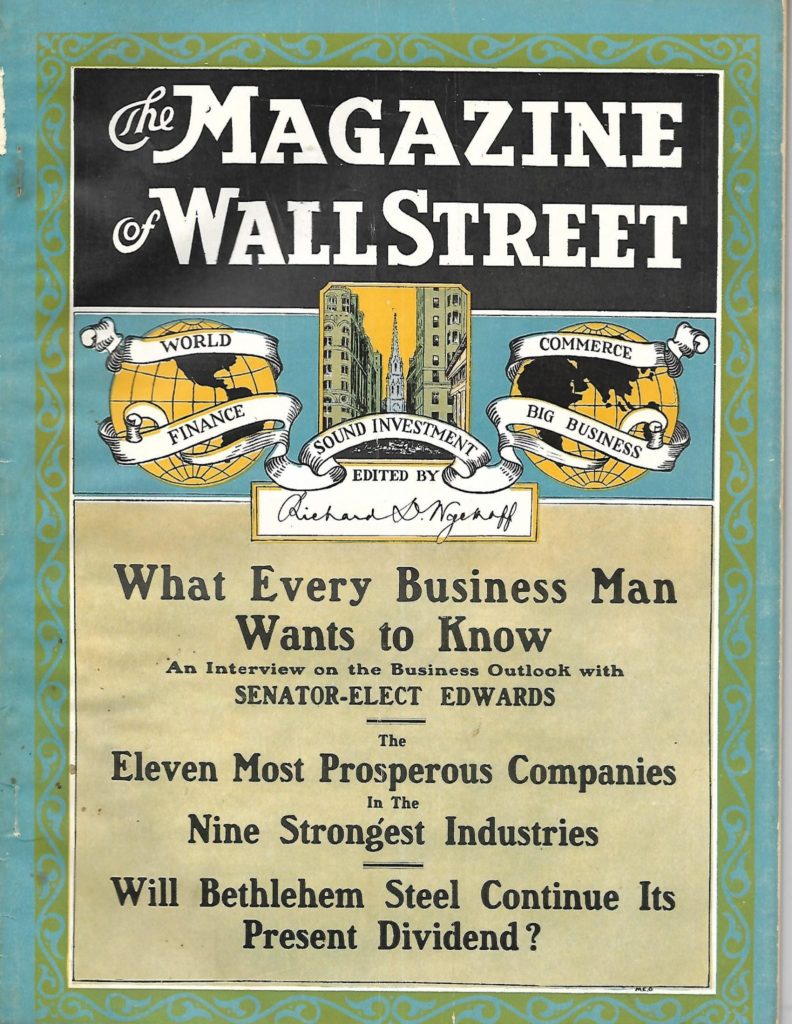
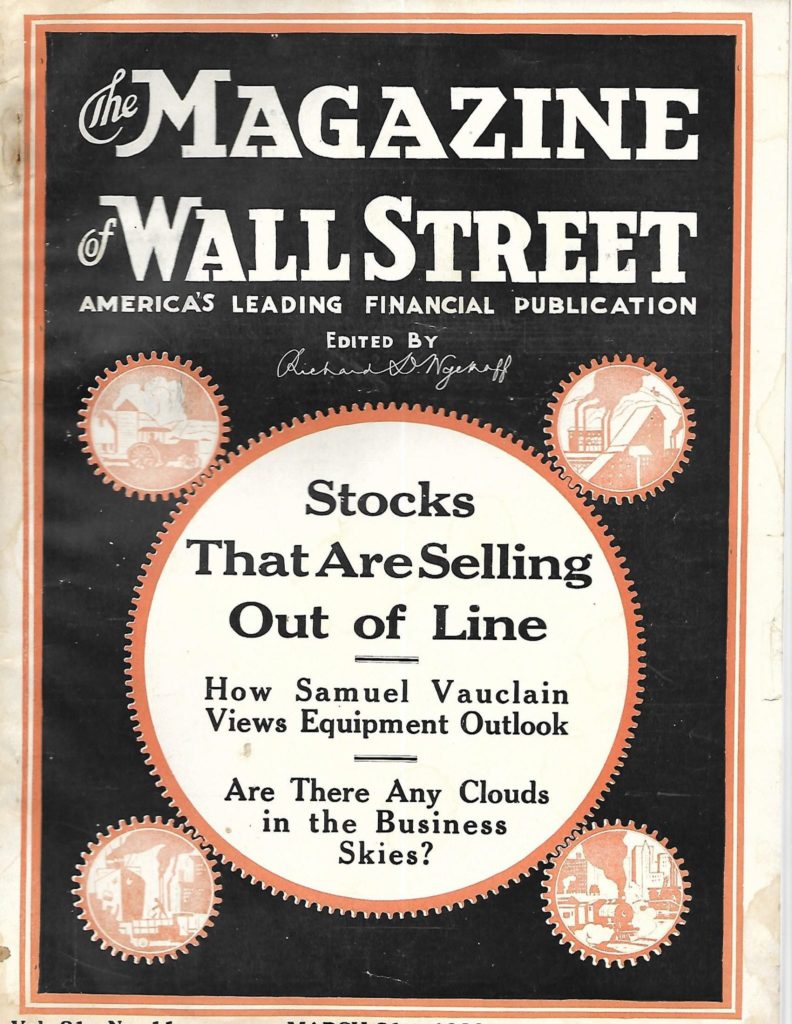
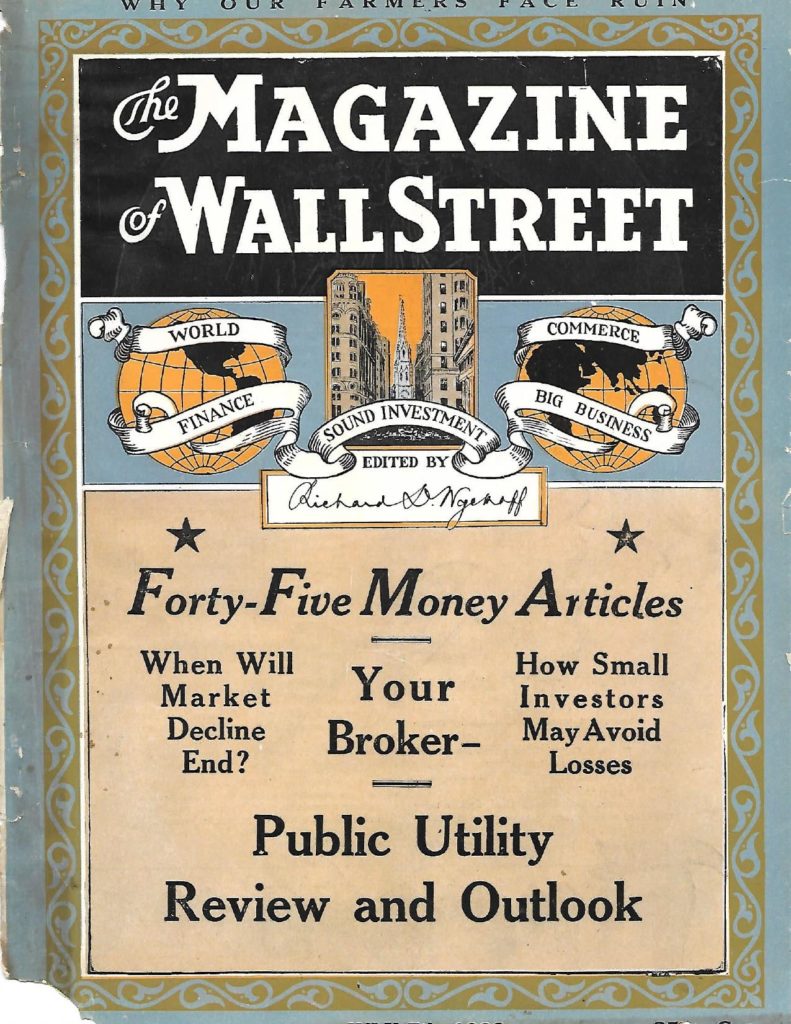
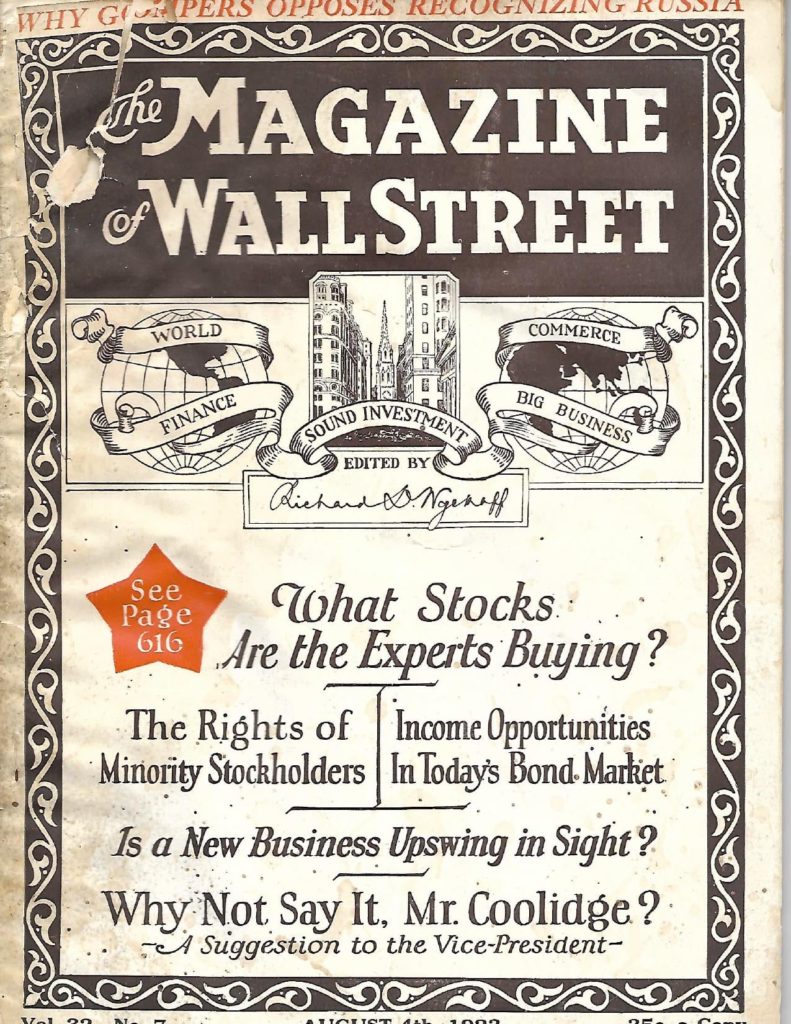
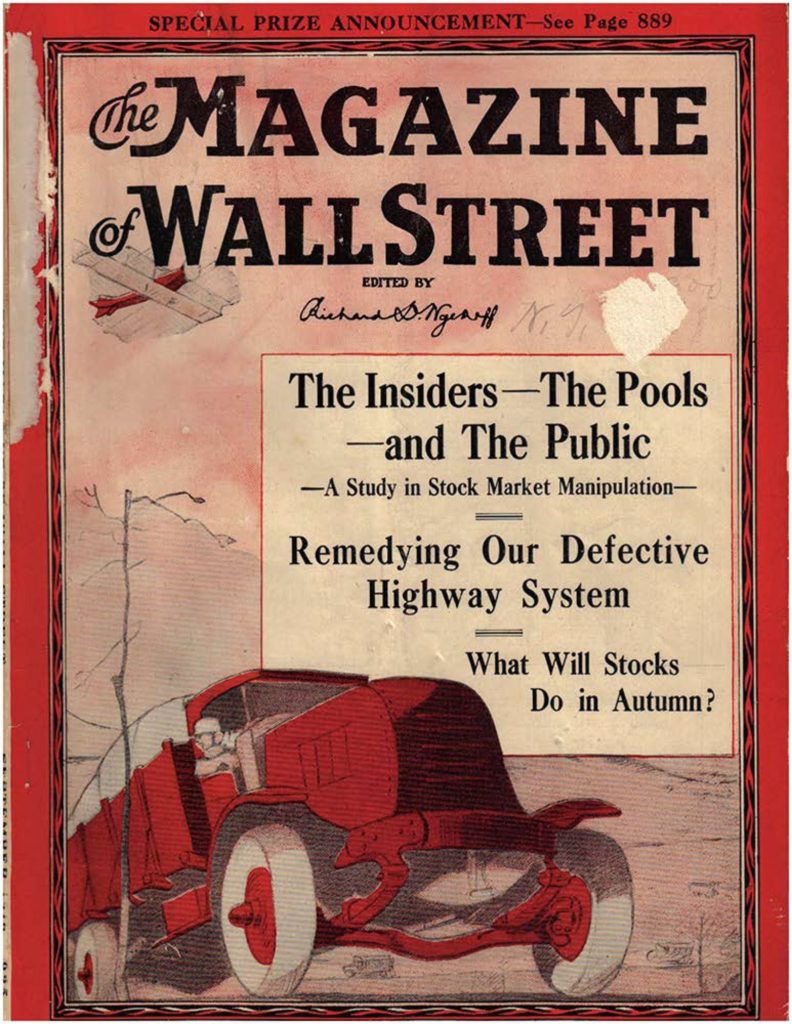
Richard D Wyckoff went to work in the stock market as a very young man and, through hard work, achieved great success and eventually owned his own brokerage firm. He established his own market letter and published the prestigious Magazine of Wall Street which was the first financial magazine in the country.
He also ran a very excellent financial advisory service and in the 1920s set up the finest stock market analytical staff in New York City
In the late 20s, the pressures of the job and some unfortunate personal issues led to some significant health problems. Mr. Wyckoff stepped away from Wall Street and took up residence on the French Riviera. He did continue to pay attention to the stock market and in 1929, realized that the market was about to crash.
He came back to the United States and tried to encourage some friends and former clients to get out of the market. Influenced by the market euphoria, they didn’t believe him. After liquidating his assets, Wyckoff returned to France.
Needless to say, what Richard D Wyckoff foresaw was the crash of 1929. I believe he actually forecast the bottom of that crash within 50 points on the New York Times stock average, which was the prevailing index of the day.
By 1931 his health had recovered to the point where he could work a few hours each day. Wyckoff decided to start a company dedicated to teaching stock market investors and traders the techniques that had made him so successful.
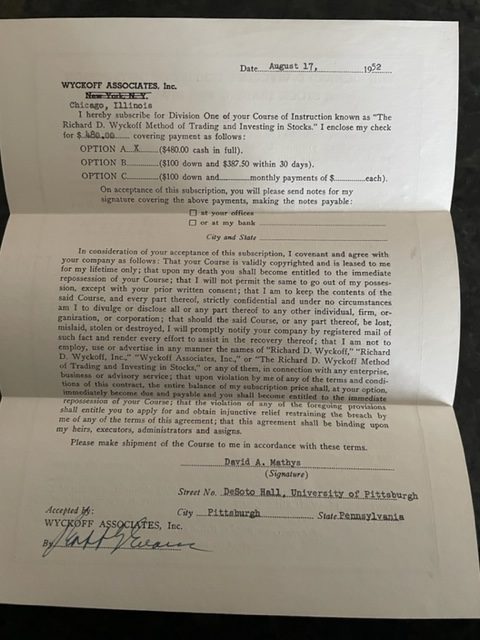
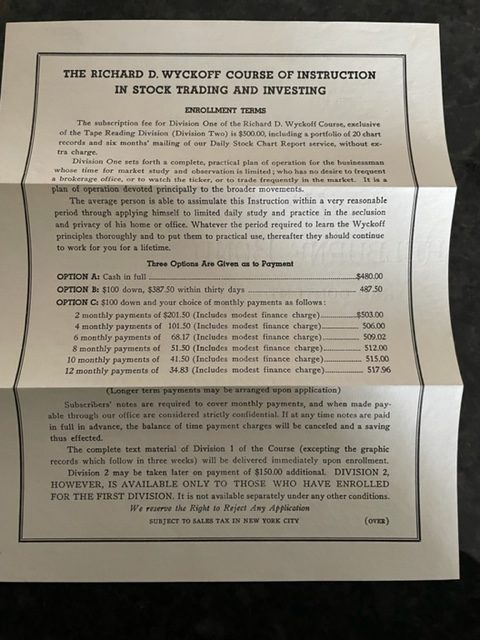
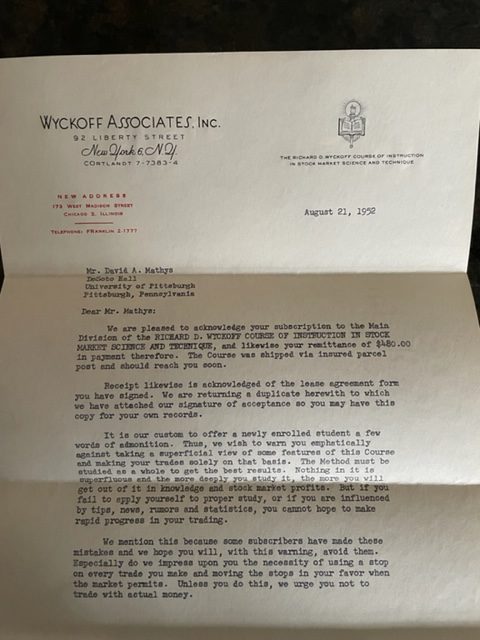
He opened his investment teaching business in 1931. The firm’s initial name was Richard D Wyckoff, Inc. It then became Wyckoff Associates, Inc. Later on the name was changed to Wyckoff Stock Market Institute. In the 1950’s the name was shortened to Stock Market Institute. Fifty five years later, in 2009, the business was brought online as WyckoffStockMarketInstitute.com and now is known as Wyckoff SMI and can be found on WyckoffSMI.com
The teaching enterprise was an instant success. Wyckoff sold an extremely large number of courses during its first year in existence. In fact, that annual course sale record was not eclipsed until the 1960’s.
The fascinating point is that today, WyckoffSMI.com is still teaching, the same strategies and techniques that were developed by Mr. Wyckoff some 100 years ago.
During his time on Wall Street, Richard D. Wyckoff was considered an investing giant. He not only developed the strategies and techniques, but with great success, tested them with his own capital. This was unlike other important Wall Street figures, like Charles Dow, who never owned a share of stock in his life.
Dow and Wyckoff had lunch together every Wednesday. Wyckoff was very interested in the Dow Theory and applied his volume studies to many of Dow’s concepts.
Wyckoff wrote the original one volume text on Stock Market Science and Technique in 1931. The original Tape Reading course was written in 1932.
Mr. Wyckoff died in 1934. Ownership of the firm was transferred to Robert Stanlaws. Stanlaws was an engineer by training, but his first love was the stock market. He had worked with Wyckoff for many years and was an outstanding stock market analyst.
He was president of the company from 1934 to 1951. This was a particularly difficult time as, during the 1930’s and 1940’s, the stock exchange almost went out of business. During the depression and World War II, very few shares were traded and the New Your Stock exchange became a very quiet place. There were even antidotes about passing a football around the floor of the exchange, as there was nothing else to do.
Stanlaws held the organization together and made several extremely important contributions. In 1937 he expanded Wyckoff’s single one volume course and it became a two-volume course. He was also responsible for vertical line chart studies and its coordination with the point and figure chart. It was also during his time that the Trend Barometer came into being. The Trend Barometer, now known as the Wyckoff Tools, was invented by Toby Weary in 1938
Initially there were two indexes. The speculative index, which was later renamed the Momentum index and Investment index which was later renamed the Force Index. The Technometer was added in 1941.
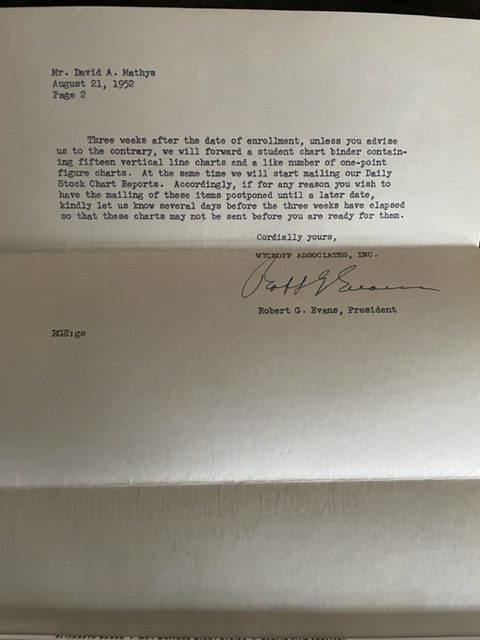
In 1951 Stanlaws died of a heart attack. Mrs. Stanlaws sold the company to Robert Evans, who at the time was the Midwest representative of Wyckoff Associates, Inc.
Mr. Evans led the firm from 1951 to 1967. Evans had purchased his initial course from Mr. Wyckoff in 1933. He had enjoyed an excellent relationship with both Wyckoff and Stanlaws.
In 1951, Mr. Evans moved the company from New York City to the LaSalle financial district in Chicago. Seven years later, Stock Market Institute moved again to Park Ridge, Illinois.
Bob Evans created the Evans Echoes lecture program. He also developed the Optimism – Pessimism Index and several teaching analogies including the Spring, the Jump across the Creek, the Fall Through the Ice and several other delightful analogies that have been extremely helpful to Wyckoff students over the years. He also developed the count guide which became an integral part of the investment decision-making process, as it forecast the distance a stock would rally or react after the move began.
When Evans purchased the firm it was almost ready to go out of existence. When he moved to Chicago there were only three people on the staff. When he sold the business to Bud Andrews, in 1967, it was profitable and employed 10 people.
Andrews purchased the company in 1967. He sold it to Elba Systems in 1972. He reacquired the business in 1973. Elba Systems reacquired the organization in 1974.
Several very important improvements were made under Mr. Andrew’s tenure. During the mid 1960’s the operational climate was changing. Government regulations became more stringent, especially in the educational field.
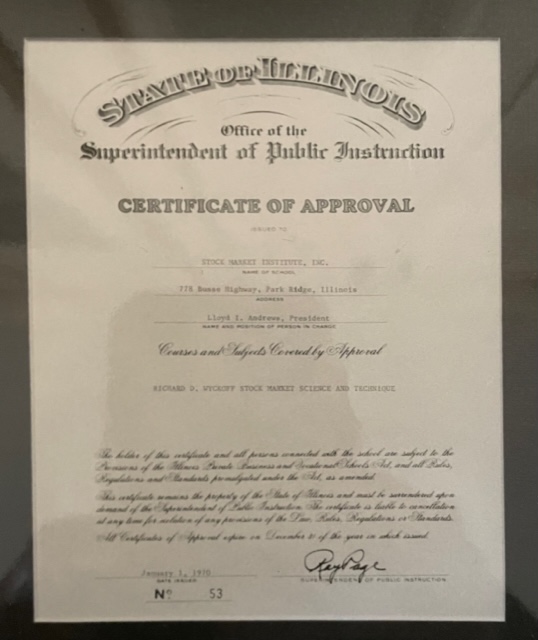
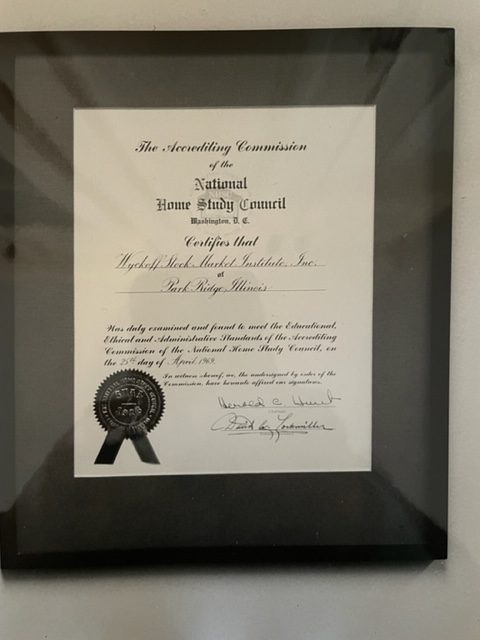
One of the first things Andrews did was to revamp the Wyckoff course and improve the teaching. He expanded it into a three volume text with exams. SMI became accredited with the Home Study Council. He also registered the company with SEC and became approved by the Veterans Administration. This allowed Stock Market Institute to sell courses to veterans under the G.I. Bill.
Bud Andrews’ leadership helped Stock Market Institute rapidly expand, but by 1972 it was a bit overextended and retrenching. This led to the 1972 sale to Elba systems.
Two years later, A. Ray Freeman purchased Stock Market Institute and moved it to Phoenix Arizona. Mr. Freeman handled sales and advertising and was involved in computer development. Long time associate David Mathys continued to operate the Park Ridge Illinois office.
Stock Market Institute was eventually purchased by Craig Schroeder and Gary Schuber. Both had worked under Robert Evans at the Illinois office, but joined Mr. Freeman in Phoenix.
Schroeder and Schuber continued the teaching services and published a weekly set of charts. They continued the Stock Market Institute tradition by continuing to market the courses and provide teaching assistance to those students who needed help.
They also published and mailed charts to students through their weekly Pulse of the Market Charting Service.
During the 1990’s the traditional hand posted charts and ticker tape market information was being replaced by computers and online services. The Stock Market Institute had to make some major changes to adjust to the new technology.
Around the turn of the century, Jim O’Brien, who owned a marketing and communications company, called the Jamison Group, Inc., began to work with Craig Schroeder. Together they began developing a new website with an online charting service.
O’Brien, who successfully completed the basic Wyckoff course in 1972, under the G.I. Bill, had enjoyed trading success using the Wyckoff strategies and techniques. He wanted to make sure Wyckoff would live on and continue to help traders and investors worldwide.
In 2008, as they were working together to develop the online charting service, Craig Schroeder succumbed to cancer. Jim O’Brien completed the project and launched WyckoffStockMarketInstitute.com
In addition to offering the basic Wyckoff courses and the timeless Evans Echoes lectures, O’Brien offered daily commentary on the stock market and a weekly review of market action.
In late 2014 Jim O’Brien met with another Wyckoff graduate Todd Butterfield. Todd Butterfield graduated from Wyckoff Stock Market Institute in 1982 and has traded in the markets, and owned and operated a successful registered investment company since completing the Wyckoff Stock Market Course. During this meeting Jim O’Brien and Todd Butterfield discussed thoughts regarding the transfer of leadership of Wyckoff Stock Market Institute due to Mr. O’Briens need “to slow down and reflect on the wonderful life God has given me” as he entered his mid 70’s. While these initial conversations didn’t lead to an immediate change of control, it did lay the foundation for what would come in the next year and a half.
In 2015 while Jim O’Brien continued to operate WyckoffStockMarketInstitute.com Todd Butterfield began building a new and improved Wyckoff Charting software that would improve on many aspects of the existing software that Wyckoff Stock Market Institute had been offering up until this point. Mr. Butterfield’s new software was not initially built to be a public offer but to be a personal trading tool for himself. Some of the amazing features he introduced specific to the Wyckoff Charting service are
- Wyckoff Sector Charts
- Compare Holding Charts
- Wyckoff Tools Spreadsheets
- The 5 Minute Intra-Day Line Chart with the corresponding Wyckoff OP Index for all symbols
- Rolling Technometer (Which allows the Technometer to update every 5 minutes during the trading session)
- 100% Browser Support Including Mobile Devices
- Twitter Snapshot allowing users to post their charts to Twitter Instantly
- Various New Wyckoff Sectors including the Wyckoff Gaming, Tape Reading, New & Unweighted
In late 2015 after more conversations with Jim O’Brien, Todd Butterfield relaunched a new website that would eventually become the future home of Wyckoff Stock Market Institute. Over the next year Todd and his team worked long hours on refining and testing the new platform. During this time in 2016 Jim O’Brien published his first book entitled Wyckoff Strategies & Techniques. It was a condensed version of the entire Classic Wyckoff course, but with up-to-date charts and graphics. The book, was the first new Wyckoff publication in many years.
In June 2016, Jim O’Brien officially closed WyckoffStockMarketInstitute.com and redirected all web traffic over to the new platform and website WyckoffSMI.com. All students, users and subscribers were transferred over to control of Todd Butterfield and the WyckoffSMI.com staff. It was at this time that Mr.Butterfield made the decision to make his charting software available for public use to Wyckoff students and members. During the months that follow Jim O’Brien would continue to publish his nightly “Pulse of the Market” and weekly “Week In Review” newsletter to subscribers from the new website and platform. Initially it was planned for Jim O’Brien to be head of ongoing educational studies however due to health reasons he wasn’t able to fulfill these duties. It was at this time that Todd Butterfield decided that it was in the best interest of Wyckoff Stock Market Institute to update the Wyckoff Stock Market Institute Course and offer it online. In early November 2016, Wyckoff SMI launched the Wyckoff Unleashed Course. The Wyckoff Unleashed Course includes over 40 lessons, over 100 updated charts, 8 hours of lectures and many videos.
On November 27th, 2016 Jim O’Brien announced during his final “Week In Review” newsletter, “As I approach my mid-70s, it is time to slow down and reflect on the wonderful life God has given me. I sincerely appreciate all the wonderful friends I have made over the past several years. Thank you so very much for all your support. Writing these blog posts have been a wonderful experience and genuine pleasure.”
Todd Butterfield has since taken over the role of author of both the “Week In Review” and “Pulse of the Market” newsletters.
In early 2017, Mr. Butterfield started LearnCrypto.io to teach the Wyckoff Method to those people interested in trading Bitcoin and other Cryptocurrencies. This website offered a condensed version of the original course by Mr. Wyckoff and has been purchased by hundreds of traders. Mr. Butterfield then began building trading software for Crypto’s that he had previously had built for the traditional stock market.
In April 2022, Mr. Butterfield launched WyckoffsmiChina.com to better serve our China family.
In 2024, Mr. Butterfield launched our Wyckoff charting indicators on the popular charting software TradingView. You can now access our Technometer, Force, and Optimism-Pessimism indicators for any symbol at TradingView that has volume.
WyckoffSMI.com and LearnCrypto.io look forward to continuing the legacy that our founder Mr. Richard D. Wyckoff would be proud of !!
About Richard D. Wyckoff
There are those who think they are studying the market- what all they are doing is studying what somone has said about the market…. not what the market has said about itself
Richard D. Wyckoff
Who was Richard D. Wyckoff and why is he important to all of us.
Richard Demille Wyckoff (November 2, 1873 – March 19, 1934) was a stock market authority, founder and onetime editor of the Magazine of Wall Street (founding it in 1907), and editor of Stock Market Technique.
Wyckoff implemented his methods in the financial markets, and grew his account such that he eventually owned nine and a half acres and a mansion next door to the General Motors’ Industrialist, Alfred Sloan Estate, in Great Neck, New York (Hamptons).

As Wyckoff became wealthier, he also became altruistic about the public’s Wall Street experience. He turned his attention and passion to education, teaching, and in publishing exposés such as “Bucket shops and How to Avoid Them”, which were run in New York’s The Saturday Evening Post starting in 1922.
Continuing as a trader and educator in the stock, commodity and bond markets throughout the early 1900s, Wyckoff was curious about the logic behind market action. Through conversations, interviews and research of the successful traders of his time, Wyckoff augmented and documented the methodology he traded and taught. Wyckoff worked with and studied them all, himself, Jesse Livermore, E. H. Harriman, James R. Keene, Otto Kahn, J.P. Morgan, and many other large operators of the day.
Wyckoff’s research claimed many common characteristics among the greatest winning stocks and market campaigners of the time. He analyzed these market operators and their operations, and determined where risk and reward were optimal for trading. He emphasized the placement of stop-losses at all times, the importance of controlling the risk of any particular trade, and he demonstrated techniques used to campaign within the large trend (bullish and bearish). The Wyckoff technique may provide some insight as to how and why professional interests buy and sell securities, while evolving and scaling their market campaigns with concepts such as the “Composite Operator”.
Wyckoff married three times: first in 1892 to Elsie Suydam; second to Cecelia G. Shear, and third to Alma Weiss. Wyckoff charged in 1928 that his second wife, Cecelia G. Wyckoff, whom the media dubbed a Prima Donna of Wall Street, had wrested control of the Magazine of Wall Street from Mr. Wyckoff by “cajolery.” The media celebrated separation ended in an agreement where he received half a million dollars of the magazine company’s bonds.
Source: http://en.wikipedia.org/wiki/richard_wyckoff
As one who is actively interested in the stock, options, or commodity markets, you are likely to find the life and teachings of Richard D. Wyckoff to be of great interest and value. In 1931, after a long and distinguished career, Mr. Wyckoff wrote a unique course on how to invest and trade in securities and concurrently he founded a teaching organization to help people to learn to use his successful methods. That course is the Richard D. Wyckoff Course in Stock Market Science and Technique.
Financial Editors of Leading Newspapers and Magazines Have Answered This Question: How was Richard D. Wyckoff qualified to establish a Course of Instruction in Stock Market Science and Technique?
Mr. Wyckoff was in turn – runner, clerk, customer’s man, head of his own brokerage house, market expert, founder and long time editor of The Magazine of Wall Street. At one time, as market advisor, he commanded one of the largest individual followings in the history of Wall Street. Mr. Wyckoff was known as one of the most accomplished tape readers of his day. –Journal Of Commerce, Chicago
Mr. Wyckoff carved out for himself a career and a fortune. His book “Wall Street Ventures and Adventures” gives lifelike portraits of many of Wall Street’s legendary figures and an expose of the inner workings of the stock market; also it contains much practical information on judging the trend of the stock market. –Barron’s Weekly, New York.
Richard D. Wyckoff was a pioneer in the study of the tape, and of the technicalities of the market itself. At one time his “buy” and “sell” following was so numerous that it became unwieldy. His own clients and the horde of parasites who had access to his tips, “made” and “unmade” the market for the Wyckoff favorites. Not the least interesting of these personalities is that of Wyckoff himself. –Nation’s Business, Washington.
Mr. Wyckoff, as nearly everybody must know, is found of the Magazine of Wall Street and edited it until 1926. As a broker, speculator, editor and financial advisor, he has been intimately acquainted with famous players in that greatest of games. –Post Dispatch, St. Louis.
Mr. Wyckoff was always a serious student of the market. But he was essentially a speculator rather than a buyer for the long pull. Unlike most speculators, however, he made a fortune and a success. –Chronical, San Francisco.
No one can describe that spectacle with more authority than Mr. Wyckoff who went through every stage of the Street from a boy employed in a brokerage house, to a successful speculator, a giant in the battle, and as editor of The Magazine of Wall Street. –World Herald, Omaha.
Richard D. Wyckoff is best known in Washington as editor of The Magazine of Wall Street. In his younger days he made a close study of the methods used by the leaders in the market. –Star, Washington.
Richard D. Wyckoff is a name familiar in itself. His span of experience in things financial has been important and varied. Mr. Wyckoff’s contribution to the dignity, advancement and science of stock transactions has been a valuable service to his country. –Daily Journal, Flint, Michigan.
He started away back in 1988 as a cog in the big stock market machine and had an ambition to learn and to tell others what made it go around. This was the life objective of Richard D. Wyckoff. –American Banker, New York.
Throughout Mr. Wyckoff’s business career, his increasing absorption with the problem of how to bring accurate and first-hand information to the buy of stocks bore fruit in the various methods of financial service which he developed. –News, Portland, ME.
It is a long road which stretches between that first Wall Street job and his later successes, culminating in the founding and ownership of The Magazine of Wall Street. Such a career could not fail to bring him into contact with some of the outstanding figures of the times. –Daily Investment News, New York.
He has known intimately for two score years the greatest of our national games, high finance. Mr. Wyckoff has been less perhaps an operator in a sensational way than a student of finance. Financial men will remember him as editor of The Magazine of Wall Street, a periodical for which he had been chiefly responsible for from its beginning, more than twenty years ago, to the time of his retirement in 1926. –Commercial Tribune, Cincinnati.
Mr. Wyckoff does not want the hard bought experience of forty years to lie idle. Therefore, he is endeavoring to pass on some of his accumulated wisdom to others. –Spokesman-Review, Spokane.
This Overview Of The Life Of Richard Wyckoff Is Maintained and Authored By Wyckoff SMI President Todd Butterfield

The following summary of his life and these comments about Richard Wyckoff and his work, explain why he was so uniquely qualified to establish this program.
Chronological Record of the Life and Wall Street Experiences of Richard D. Wyckoff (Condensed from his autobiography “Wall Street Ventures and Adventures Through Forty Years.)

April 1926 issue of
“The Magazine Of WallStreet”.
The magazine was founded by Richard Wyckoff in 1907
Click Here To View Our Entire Collection Of The Magazine Of WallStreet Issues!
1888 His first job – A Wall Street Runner
1890 Learning the rudiments of investing.
1891 Brokerage house cashier at seventeen.
1892 A change of base-on the stock exchange floor-bearing the bucket shops.
1896 From assistant to head purchase and sales clerk.
1897 Broadening activities-learning about bonds-from paper trading to “plunging” in one share lots.
1898 Running a speculative venture from nothing to $1,000-doubling his capital-supervising seven branch offices of a stock exchange firm.
1899 Handling deals in insurance stocks and Spanish War loan bonds.
1900 Trading over-the-counter and curb market securities-floating himself; Harrison & Wyckoff-his first stock exchange firm-handles manipulative orders for Jay Gould and Harry Content.
1901 Obsersving operations of John W. Gates and James R. Keene from the inside-successfully forecasting the Northern Pacific panic.
1902 Studying manipulative forces and the methods of large operators.
1903 A change of partnership-Mallett and Wyckoff.
1904 Buying U.S. Steel at 8 5/8, within one quarter of the lowest.
1905 Studying the big fellows-Wasserman, Kessler, Canfield, Morgan.
1906 Developing a trading method-starting in the bond business.
1907 Working for James R. Keene-contacting George W. Perkins, Thomas Fortune Ryan, August Belmont, Charles W. Morse-founding the Magazine of Wall Street.
1909 Testing mechanical systems-studies in market action-perfecting his method.
1911 Getting a reputation-trading from a private office.
1913 Special partner in Alfred Mestre & Co., members of the New York Stock Exchange-forecasting future melon cuttings.
1915 Financing an enterprise.
1916/8 Taking money out of Wall Street-breaking the market in U.S. Steel-a large personal following.
1919 Crusading for great public protection in securities markets.
1920 Organizing the Richarad D. Wyckoff Analytical Staff.
1921 Founder member of New York Curb Exchange-dealings with Jesse L. Livermore-his methods.
1922 Exposing and killing the bucket shops.
1923 Bringing the magazine to its goal-business with Otto H. Kahn.
1924/5 A personal clean up-besting Livermore-vacation in Europe.
1926 At the top of the heap-planning to retire-the country home that profit built-a final market coup-neighboring with Sloan, Sinclair-ill health.
1927 Market interests closed-convalescing in Florida, California-a relapse.
1928 European sojourn-dream of a Wall Street College.
1931 Back in Wall Street-a lifelong ambition realized-a national educational institution in the heart of the financial district.
1934 Death takes a hand.
Richard D. Wyckoff, Author
Studies in Tape Reading (1909)
How I Trade and Invest in Stocks and Bonds (1920)
Wall Street Ventures and Adventures Through Forty Years (1930)
The Richard D. Wyckoff Course in Stock Market Science and Technique (1931)
Stock Market Technique, Volumes 1,2, & 3 (1933)


































































The Wyckoff Wave Looking Like A Possible Test Of 63,000.
https://youtu.be/WN6mp1LWw-4 The Wyckoff Wave traded lower for the week as expected, on average low volume. We have been talking about a selloff to the 63,000

The Wyckoff Wave Overbought, Still Looking For Possible Test To 63,000.
The Wyckoff Wave traded sideways for the week, on slight increase in volume due to expiration. We was looking for lower, and still the same

The Wyckoff Wave Still Looks Lower In The Coming Week, To Possibly Test 63,000.
https://youtu.be/t1lfv547C5Q The Wyckoff Wave traded lower for the week, on low volume. We was looking for lower, and got just that. It appears we still
The Wyckoff Wave Testing The Highs, Ready To Turn Lower.
The Wyckoff Wave traded higher for the week, on very low volume. We was wanting a couple day rally to upthrust the highs as shown
The Wyckoff Wave Appears To Still Look Lower In The Week Ahead.
The Wyckoff Wave traded only slightly lower for the week, on very low volume. Our Technometer was oversold to begin last week, so we thought

The Wyckoff Wave Corrected As Expected, Now Oversold.
The Wyckoff Wave traded lower for the week, on low volume. We was expecting a correction for a backup to the previous creek. We did
Looking For The Wyckoff Wave To Move Lower In The Week Ahead.
The Wyckoff Wave traded slightly higher for the week, on low volume. We are expecting a correction for a backup to the previous creek. We
The Wyckoff Wave In The Midst Of A Correction.
The Wyckoff Wave traded slightly lower for the week, on lower volume. It appears we are correcting for a backup to the previous creek. We
The Wyckoff Wave Continued Higher Once Again For The Week.
The Wyckoff Wave traded higher for the week once again, on lower volume then the week before. We were looking for a pullback soon, but
The Wyckoff Wave Continued Higher But Nearing Overbought.
The Wyckoff Wave traded higher for the week, on an increase in volume. We was looking for a pullback last week, but instead got further
The Wyckoff Wave Tested The Highs, Looks Lower Next Week.
The Wyckoff Wave traded slightly higher for the week, on average low volume. We was looking for an opportunity to enter longs early in the
The Wyckoff Wave Holding Near The Top Of Its Trading Range.
The Wyckoff Wave traded slightly lower for the week, on low volume. We was looking for a successful test of the upthrust, because of the
The Wyckoff Wave Testing It’s Upthrust.
The Wyckoff Wave traded higher for the week, on low volume. Last week we began the test of the recent upthrust. Thus far it is
The Wyckoff Wave Still Looks A Little Lower After Last Week’s Selling Pressure.
The Wyckoff Wave traded lower for the week as expected, on low volume. We did upthrust resistance as I mentioned, and came off nicely. Volume
The Wyckoff Wave Looks Lower After Friday’s Reversal To The Downside.
The Wyckoff Wave traded higher for the week on average volume, then reversed lower on Friday, on an increase in volume. We are upthrusting resistance
The Wyckoff Wave Bumping Its Head On Resistance, Sideways To Lower In The Coming Week.
The Wyckoff Wave traded slightly higher for the week, on a slight decline in volume. We are back at resistance that has stopped the Wave
The Wyckoff Wave Saw Increased Volume To The Upside To End The Week, But Appears We Could Work Sideways To Lower In The Coming Week.
The Wyckoff Wave traded sideways early in the week, then finished strongly higher, on an increase in volume. We was wanting a little more weakness
The Wyckoff Wave Could Continue Trading Sideways/Lower In The Week Ahead.
The Wyckoff Wave finished the week lower as expected, on average volume. We was expecting sideways/lower last week, and could see more of that this
The Wyckoff Wave Looks Lower In The Week Ahead.
The Wyckoff Wave finished the week slightly higher as expected, on average volume. We are not impressed by the lack of solid upside action last
Wyckoff Wave Tested The Previous Week’s Low, And Appears Ready To Move Higher Once Again.
The Wyckoff Wave finished the week slightly lower, and tested the previous weeks low, on lower volume. We liked last weeks action, as we appeared
Wyckoff Wave Pulled Back As Expected, And Rallied Strongly Off An Oversold Technometer.
The Wyckoff Wave finished the week slightly lower after rallying strongly on Friday, on average volume. We as looking for lower last week, which we
Wyckoff Wave Did Pullback To Previous Resistance at 59,400 As Wanted, Still Looks Like It Could Consolidate More.
The Wyckoff Wave finished the week lower as expected, on average volume. We had been wanting lower, and at least a pullback to $59,400 or
We Would Like To See The Wyckoff Wave Pullback To Previous Resistance at 59,400.
The Wyckoff Wave finished the week up ever so slightly once again, on average volume. We have been expecting lower, and still look for lower
The Wyckoff Wave Still Looks Slightly Lower In The Coming Week.
The Wyckoff Wave finished the week up ever so slightly, on average low volume. We have been expecting lower, and still look for slightly lower
The Wyckoff Wave Still Looks Like It Could Work Slightly Lower.
The Wyckoff Wave finished the lower, on average low volume. We have been expecting lower, and still look for slightly lower in the week ahead.
The Wyckoff Wave Now Overbought, Sideways To Lower.
The Wyckoff Wave finished the week strong, on average volume. We had been wanting a pullback and an oversold Technometer to buy. Instead, we have
The Wyckoff Wave Still Looks Lower Short Term.
The Wyckoff Wave finished the week only slightly higher, on much lower volume. We are still expecting lower in the coming week, and hopefully we
The Wyckoff Wave Price Action Not Looking That Bullish.
The Wyckoff Wave finished the week slightly lower, on an increase in volume. Last week we thought the Wave could meet some support, and it
The Wyckoff Wave Pulling Back To Previous Resistance And Near Oversold.
The Wyckoff Wave finished the week lower, on a sharp increase in volume. Last week we was wanting a continuation of the rally, before an
The Wyckoff Wave Should Continue Last Week’s Recovery.
The Wyckoff Wave finished the week higher as expected, on average low volume. Last week, we was wanting a slight correction to get our Technometer
The Wyckoff Wave Could Retrace Some Of Our Recent Losses.
The Wyckoff Wave finished the week lower once again , on low volume. We was wanting a slight correction to get our Technometer closer to
The Wyckoff Wave Sideways, But Looks Constructive.
MARKETS ARE CLOSED FOR MONDAY. The Wyckoff Wave finished the week ever so slightly lower again , on low volume. We would like to see
Why Choose Wyckoff SMI
Craig's Corner
Craig’s Corner is dedicated to the writings of the late Craig Schroeder, who passed away in 2009. Craig, a previous owner of the Stock Market Institute of Phoenix, AZ was an outstanding Wyckoff educator. Many of the articles listed here explain important Wyckoff principles and are invaluable to any serious Wyckoff student.
Craig Schroeder’s articles focus on the theoretical side of the Wyckoff approach to stock market trading. If you are new to the Wyckoff method, these articles form a basic Wyckoff primer to help you understand the enormous trading potential found by Wyckoff method students.
Perhaps you are a trader, unfamiliar with the Wyckoff method. You may have read articles or books about Wyckoff or interacted with others who profess to be knowledgeable about the Wyckoff strategies and techniques. However, you have never embarked upon a step by step course of study intended to result in a working knowledge of the Wyckoff approach to technical trading in the stock market.
Others that can benefit from these articles are more experienced Wyckoff students. You are traders and investors who have made a comprehensive study of the Wyckoff approach and who are using Wyckoff in your market operations.
Those of us in this group unfortunately have lapses in memory during which we forget to employ a tool that Wyckoff has taught us and frequently pay a price for not remembering.
Continuing re-enforcement of lessons previously learned is the best way to keep our memories sharp and to reduce those potentially costly lapses to a minimum.
I hope you stop by Craig’s Corner on a regular basis, and that these articles will provide some helpful ideas and concepts that will help increase your trading profits
INTRODUCTION TO
WYCKOFF ARTICLES
Analyzing Trends
Using the Wyckoff Method
PUTTING IT ALL TOGETHER
OTHER MARKETS
BUYING STOCKS: OPPORTUNITIES AND TESTS
Primary Buying Opportunities
Springs
Primary Buying Opportunities
Tests of Springs
Primary Buying Opportunities
Back Ups
SELLING STOCKS:
OPPORTUNITIES AND TESTS
Selling Opportunities
Normal Corrective Rallies
Selling Opportunities
Rally Back to the Ice
Selling Opportunities
Up Thrusts
Selling Opportunities
Tests of Up Thrusts
MISC. ANALYSIS
Measuring Relative Strength/Weakness
ARCHIVES
A Macro View of Boeing March 15, 2009
A Macro View of AT&T December 7, 2008
A Micro View of BAC December 14, 2008
MISCELLANEOUS ARTICLES
(ASSOCIATED CHARTS ARE NO LONGER AVAILABLE)
Analyzing the
Wyckoff Wave, O. P. Index and Trend Barometer – Trends
Analyzing the
Wyckoff Wave, O. P. Index and Trend Barometer – Trading Ranges
Analyzing the
Wyckoff Wave, O. P. Index and Trend Barometer – Points of Interest
Wyckoff's Corner
How to use the WyckoffSMI Technometer
How To Use The Wyckoff Method Part 1
Day Traders Bible,
My Secrets to Trading In Stocks 1919
Reminiscences of a Stock Trader, Jesse Livermore
Determining The Trend Of The Market By The Vertical Line Chart, Wyckoff Analysis 1930-1931
Wyckoff Stock Chart Example, 1982
How To Use The Trend Barometer Report
Trend Letters
Initially created by Richard Wyckoff in 1911 “The Trend Letter” contained information predicting the probable course of the market. The forecasts contained in this Letter were so accurate that a large following was developed. As a result of a series of successful campaigns he was not only overwhelmed with business but brokerage houses throughout the country passed along these advices to their clients. So many followers were thus gained that an undue effect was had on the quotations for the stocks in which he traded, and in certain cases the effect on the market was important.

Trends & Trading Ranges
Trends and Trading Ranges was a newsletter created by Craig Schroeder that was sent out Wyckoff Stock Market Institute students detailing the current market and stock trends. While this report currently isn’t actively being sent out today our team is currently exploring the possibility of bring back the Trends and Trading Ranges newsletter.
The Magazine Of Wall Street
Articles From This Issue

Judging The Market
A “HOW TO” manual on determining the present position and probable future trend of the market based on it’s own action as charted by the SMI Indexes.
Click Here To Download Pdf Version
Table of Contents
Fundamental Concepts and Basic Tools
What are the SMI Indexes
The Wyckoff Wave
The Optimism-Pessimism Index
The Trend Barometer
Individual Group Indexes
Using The SMI Indexes for Market Analysis
Determining and Analyzing Trends
Relating the Wyckoff Wave and the O-P
Analyzing the Level of Market Volume
Analyzing the Trend Barometer
Analyzing the Intraday Data
Analyzing the Market with Figure Charts
Analyzing the Market with Group Indexes
Using the Daily Stock Report
Tips on Trading
Final Thoughts
Selecting A Stock
HOW TO SELECT A STOCK AND ADVANCES IN MARKET TECHNOLOGY
The purpose of this volume is to focus on the processes involved in translating a correct analysis and interpretation of general market action into a profitable trade in an individual stock or stocks. The means to this end will include such established concepts as comparative strength and weakness, cause and effect, effort vs. result, the nine buying and selling tests, and selected new concepts that may be an aid toward better timing of trades.
Each investor or trader in stocks, bonds, options, or commodities is called upon to make a wide range of interrelated observations and conclusions. The result is a process that can be seen as being extremely complex. Unfortunately, many investors allow themselves to become so wrapped up in this apparent complexity that they are rendered incapable or unwilling to make the necessary decisions. When this happens, it represents a failure to recognize that what detail is involved, and it is substantial, can be approached in a predetermined step by step manner and that these steps are the building blocks of an investor’s most basic objectives.
Wyckoff Glossary Part I
Accumulation: from the Supply/Demand perspective is demand coming in to gradually overcome and absorb the supply and to support the stock at this level.
Automatic rally (AR): Following the Selling Climax one of two things may happen an Automatic rally (AR) or a lateral move. This is then followed again by one of two things either a Secondary Test (ST) of the Selling Climax or a continuation of the down move. To understand this we must go back to what happens on the Selling Climax: The Selling Climax is caused by panicky liquidation, panicky selling. The price is driven down too far and this creates a vacuum as soon as the down move has been stopped the stock should begin to rally. We call this the Automatic Rally (AR) because it occurs automatically. Generally, the (AR) lasts for only a few days to about a week. The rally may be weak or strong. It may be, however, so weak and the supplied press on the market so strongly that instead of being able to rally well the price simply moves sideways for a couple of days, or perhaps for as much as a couple of weeks and a lateral move will then continue the downtrend. If there is a simple lateral move the stock is FAR MORE LIKELY to continue the downtrend than if there is a good rally.
Automatic reaction (AR): Following the Buying Climax is the Automatic Reaction: As with the Automatic Rally, the time factor here is generally measured in days. The extent of the reaction depends on how completely the demand is exhausted and how extensive the first wave of short selling is. The (AR) will also be limited by renewed buying by those who see the reaction as a way of acquiring stock at bargain prices, and by the fact that the REACTION does not have any significant preparation in advance to sustain it.
Backup to the edge of the creek (BEC): is normally a potential (SOS), after jumping the creek the backup to the edge is usually the reaction of the jumping of the creek (rally) and comes to rest (find support) above the creek. The Backup to the edge is normally a potential Last Point of Support (LPS).
Minor Creek: lower branch, The minor creek very often occurs in the lower or the middle part of the T/R but is still somewhere in the T/R.
Major Creek: upper branch, The jump of the major creek is a larger move and it very often carries the stock above the old supply levels in the T/R often into new high ground.
Buying Climax (BC): The climax ending an uptrend is called a Buying Climax because it is the end of the condition where the buying is stronger than the selling. The buying gradually builds up & builds up and finally comes in with a RUSH and EXHAUSTS itself on the buying climax. The buying climax has increased volume and a widening spread as it moves up. Following a buying climax one of two things can occur, either a (AR) or a lateral move. This in turn is followed by one of two things: either a continuation of the uptrend or a Secondary Test (ST). If the supply is too weak to drive the stock down or demand too strong to allow it to go down instead of having the (AR) the stock will have the lateral move. Usually, however, it will have some form of an (AR). That (AR) may have increased volume, heavy volume, or no volume. It may have wide price spread, or relatively narrow price spread.
Climax: the peak, the extreme, or the end of something and as the point of highest dramatic tension or a major turning point in the action. Some synonyms are top, pinnacle, height, maximum, consummation, culmination, or turn of the tide. What does a climax do? A climax stops a trend either temporarily or permanently depending on the subsequent action. A climax is preceded by some sort of a trend.
Creek: relates to the flow of supply across the top of the trading range. The creek itself is a wiggly, squiggly trend line drawn freehand through the tops of the rallies within that trading range.
Cross or Jump the creek (JAC): either minor/major. To jump (rally) above the creek (drawn trendline) or flow of supply. This jump or crossing is a Sign Of Strength (SOS). Now, where is the creek? After much searching for the answer to this question, Mr. Evens finally reached the conclusion that the CREEK is WHERE the BOY JUMPED. Applying this to the market, the CREEK is WHERE the VOLUME CAME IN, where the EFFORT the PUSH the POWER came in. It is important to recognize that there is no one exact way of drawing these creeks. Do some experimenting with them, you may wish to draw the creek lightly in pencil on your chart and continue the creek as long as it is useful, then later, either erase the creek, or a branch of the creek, or perhaps remove it from your chart altogether. However, leave the important creeks on your chart as they can be EXTREMELY HELPFUL in drawing your attention to the MEETING of supply in a T/R and in assisting in defining the probable extent of the reaction, that is the BACKUP, which is likely to occur after a possible crossing of the creek. It will be especially helpful in drawing your attention to situations where a stock falls back into the edge of the creek, because every so often it does that and every so often that little old boy scout sort of drowns. Our problem and very often is NOT to drown with him.
Distribution: from the Supply/Demand perspective, Distribution area is where the Supply overcomes Demand and stops the upward move and eventually begins the downward move. Distribution refers to the elimination of a long investment or speculative position and often involves establishing a speculative short position by professional interests in anticipation of a decline of price. In the distribution area the professional investors or speculators who had previously had bought stock, sell there stock to the public. The public buys and it generally buys because of good news of various sorts. Good news on the company, its product, the economy or any news which will entice untrained people to rationalize there buying decision. The best news of all is the advancing of the price of a stock. Often the reason that untrained people buy is that they do not want to miss out on the anticipated profits they think there are going to get as the stock continues to move up. Or they may buy because the stock has reacted a few points from the top and they think they are getting a bargain. After having sold there long stock professionals have no reason to support the stock on reactions and so they cancel there bits under the market, they may not only cancel the bids but they may establish short positions in anticipation of a large decline in price. Distribution is usually accomplished in a relatively SHORT TIME, Whereas accumulation takes MUCH LONGER, sometimes over many years. MAJOR distribution occurs in only a few weeks or perhaps a few months very rarely over a several year period. Distribution is usually characterized by wide price movements and heavy volume and GREAT activity.
Effort versus Result (E/R): if you have an effort expressed the result should be in proportion to the effort. If a stock has been moving up every day with a two point spread every day with ten thousand shares and it breaks into the high ground with twenty thousand shares and a half point spread for a couple of days straight we know supply is coming in and is overcoming the demand. This is an effort that is not having an proportionate result, therefore the stock is likely to be in trouble and have a reversal in its movement.
Half-way-points (1/2): are used as a measurement of relative strength on a rally or reaction. Example, if a stock moves from $50 to $56 the distance of six points and then reacts, the half-way-point would be half of that six points or at $53. Reverse the process for calculating the half-way-point on a rally following a decline. Example, if a stock moves down from $30 to $21 a distance of nine points. The half-way-point would be at half of that distance and is $4 ½ points added to $21 gives a half-way-point of $25 ½. Do not expect the stock or index to go exact half-way-point at the exact 1/8th. It is sufficient to meet support or supply in the vicinity of that half-way-point. Always calculate Half-way-points mathematically do not guess, because your eyes will lead you astray.
Ice: The ICE is the FORMER SUPPORT AREA at the BOTTOM of the T/R which BECOMES a SUPPLY AREA. The ICE is shown by drawing a wiggley trendline across the various support points at the bottom of the range. In a manner similar to the creek which is drawn through the supply points at the tops of the rallies in the T/R.
Last Point Of Support (LPS): Should have a LACK OF SUPPLY indicated by a RELATIVE NARROWING of the SPREAD and a DECREASE IN THE VOLUME. The comparison is between the up move constituting the (SOS) and the REACTION FOLLOWING it, the (LPS). See the Back-up to the edge of the creek. What if the stock has a possible (SOS) indicated by a widening spread and increasing volume on the move up and is then followed by good supply on possible (LPS) indicated by wide spread and high volume on the reaction? This CANCELS the probability of the fist action being a (SOS) and the stock will probably continue in the trading range for additional testing.
Last Point Of Supply (LPSY): The (LPSY) is proceeded by the (PSY), (BC), (AR), (ST), (SOW) and then the (LPSY) occurs. The reaction preceding the (LPSY) must be a (SOW). any possible or potential (SOW) must be confirmed, denied or left in doubt by the SUBSEQUENT rally. If the rally has a relative lack of demand on IT, generally evidenced by a decreased spread and decreased volume, this would be CONFIRMATION and PROOF of a (LPSY). However, should demand still be strong on that rally as evidenced by good or increased volume as well as wide or widening spread, it is usually best to regard such action as a DENIAL of the (SOW) and such action may well leave the interpretation of the (SOW) and the (LPSY) in doubt. When this occurs DO NOT take a SHORT POSITION. It is better to miss a move then to run a great risk of being wrong. The (LPSY) rally will often stop just below the ½ way point. It is NOT particularly important where a (LPSY) stops on the rally, however, it very often turns in the vicinity of that that ½ way point. There is no one exact point in which to take a position. YOU MUST judge the (LPSY) as it occurs and attempt to establish a short position as close to the TURNING POINT as possible. Often you can tie this in with other principles, such as: The meeting of the supply line, The previous supply or support area and the ½ way point, Very often the (LPSY) will come in the same area as the (PSY) or the (BC).
Law of Cause & Effect (C/E): in order to have an effect you must first build a cause. The effect will be in direct proportion to the cause and cannot be separated from the cause. Very often the working of this law can be most easily seen in the figure chart.
Law of Supply & Demand (S/D): When demand is stronger than supply prices will rise. When supply is stronger than stronger than demand prices will fall.
Mark-down (MD): from the Supply/Demand perspective is, Supply that is greater than Demand.
Mark-up(MU): from the Supply/Demand perspective is, Demand that is greater than Supply.
Measuring Trends: At SMI we use three methods of measuring trends: Trend lines, which measure the angle, there are two types of trend lines: the normal use and the reverse use. Thrusts are used to measure each drive up & drive down. The third measurement is the Half-way-point which is an indication of comparative strength and weakness and the adequacy of the correction. When placing these measuring methods, do it with a great deal of exactness. However, do not expect the stock or index to observe or reach them perfectly .
Overbought (OB): the stock or the market goes through distribution.
Oversold: (OS) the stock or the market can go through accumulation.
Position Sheet: A tally sheet showing the trend positions of specific securities. The position within a trend shows where the price (position) is in the trend.
Preliminary Supply (PSY): is the FIRST important SELLING (or meaningful reaction) which is part of the distribution area (this indicates the first important wave of supply or selling is being brought to market) and which comes in to stop the upward trend TEMPORARILY. Usually there’s some form of a Buying Climax which stops the move and that is followed by a REACTION, (PSY), which has pronounced WEAKNESS or volume or preferably both (wide spread & high volume). The buying climax (BC), is part of the Preliminary Supply (PSY) this NORMALLY HAS LESS VOLUME THAN THAT ON THE FINIAL BUYING CLIMAX. The price reached on the (LPSY) after a sign of weakness very often is in the same area reached on the (PSY). Analytically the significance of the (PSY) is that if the entire area is distribution. That distribution may have begun in the area of the (PSY). Note: sometimes the (PSY) and the (BC) occur on the largest and longest leg of an upwards thrust of the uptrend.
Preliminary Support (PS): is a form of a selling climax and is an action in which important demand comes in to stop the down move even temporarily. The first important rally in a downtrend is the (PS) it may occur after the first oversold condition, and is especially likely as the stock or the market reaches its downside objective. The importance of the (PS) is as a warning that the end of the down move may be near. The significance of the (PS) is that if the entire base is accumulation the accumulation may have begun at the (PS) and continued throughout the base. Preliminary Support and the Last Point of Support (LPS) often occur at the same price level. The (PS) is sometimes obscured due to the violence of the price action and sometimes it is virtually missing. But usually on accumulation some form of (PS) is present.
Primary Growth Trend: sometimes it is a downward slanting trend. This is the general direction or rate of growth the market: an index, a stock, or the economy, or company is taking.
Price/down: There are two ways price can go down: price can go down and have an increased supply meet a superior force of demand at that point. Or price can go down and simply drift and drift and drift until it stops and ultimately rallies. Mentioned on tape #2 side B: along with reverse trend lines.
Principle: is a comprehensive and fundamental law, doctrine or assumption. It is an unchanging rule.
Profit/Risk Ratio: Should never be less than 3:1, This means that for every point below the purchase price the stop is placed, three points of profit are anticipated. So for a stop that is placed three points below the purchase price, nine points of profit are anticipated. It is BETTER PRACTICE to LEAVE your STOP underneath the PRIOR support area and IF NECESSARY GET-OUT BEFORE that stop is reached.
Rally: A short term advance in the price of any securities or class of securities. When rallies, or uptrends are stronger than the reactions, Demand is stronger than Supply. You will be able to judge the Supply & Demand on basis of the Price action, Volume and Time. There is a widened spread and an increasing volume on the rallies. On the reaction there will be decreased volume and a comparatively narrow spread compared to the rally, indicating less selling on the reaction then there was buying on the upside. In an up-trend you should not have prolonged price weakness or massive dumping of stocks on the reactions.
Reaccumulation: Takes place within a sizable upward trend when a stock goes into a trading range and in the process builds a count for a higher objective, usually confirming a prior base count. It goes into a resting stage and the professionals continue to absorb the supply. Also called a STEPPING STONE.
Reaction: A short term decline in the price of any securities or class of securities. When reactions, or downtrends are stronger than the rallies, Supply is stronger than Demand. You will be able to judge this on the basis of the Price action, the Time and the Volume. Volume should remain good, strong, on the downside, the rallies however should be relatively weak indicating a lack of Demand. There should not be wide spread or increased volume or sustained increased volume and it might take quite a bit of time on the rallies. The main point is that you have a unbalanced condition in the Supply and Demand with Supply good on the downside and a lack of Demand, weak Demand on the rally.
Secondary Test (ST): Immediately follows the (AR). There should be less selling than on the Selling Climax. Evidenced by the decreased price weakness, the narrowing of the Spread and especially by the Decreased Volume. At that point the down move has been stopped. The stock may go through redistribution, accumulation, or a trading range in which nothing of importance is going on. There may be repeated secondary tests depending upon the ability of the professionals to absorb the supply and the continued existence of that supply.
Self Reliance: learn to rely on yourself alone. This is a lone wolf business. Learn to make your own decisions, discuss them with no one. Stick to your guns and follow through until the commitment is completed.
Selling Climax (SC): A situation characterized by the highest intensity of speculative supply occurring within a downtrend. This situation occurs only after a move has been in effect for some time. This condition marks the end or the approaching end of a particular downtrend. This panic selling creates an extreme expansion of the price spread and an expansion of the volume, this action may occur over one day or over several days. If it does NOT HAVE THIS IT IS NOT A SELLING CLIMAX. The Wyckoff principle of the selling climax does not always occur at the end of every decline. All that the (ST) of the (SC) does is STOP the DOWNMOVE.
Sign Of Strength (SOS): is an ACTION which shows that DEMAND is in control. The (SOS) should have GOOD DEMAND on the UP MOVE, a WIDE SPREAD and INCREASING VOLUME on the UPSIDE. Now let us deal briefly with the (SOS). The Sigh of Strength and the Crossing of the Creek are often two ways of looking at the SAME ACTION and the BACK UP to the edge of the CREEK very often is the (LPS) Last Point of Support. This (SOS) is usually is preceded by a T/R and a stock can continue in a T/R until it either has a (SOW) or a (SOS). The (SOS) shows that DEMAND is in CONTROL the Price & Volume characteristics are that it has WIDENING SPREAD and an INCREASE in VOLUME evidence of the good DEMAND. This is PROVEN and followed by the REACTION to the (LPS), that (LPS) should have a NARROWING of the SPREAD and a DECREASED of VOLUME compared to the (SOS) indicating the LACK of SUPPLY on the REACTION
Sign Of Weakness (SOW): is an action which shows that SUPPLY is in control. The reaction will decline with a widening spread, increased price weakness, and increased volume, evidence of increased and heavy selling, this is BEARISH. The (SOW) is usually proceeded by a T/R. If the T/R was in an uptrend it would have been stopped by the (PSY), (BC), (AR), (ST). The T/R will end, on the far right hand side, it may end its move with a classic (UT) or (UTAD) or it may NOT. It may simply have a (SOW) and a (LPSY) with perhaps lower tops and lower bottoms. Any possible or potential (SOW) must be confirmed, denied or left in doubt by the SUBSEQUENT rally. The critical thing is NOT HOW FAR the stock rallies, the critical thing is HOW it RALLIES. If it rallies with a gradual decrease in demand, evidenced by a narrowing spread and decreased volume, and with a lower top this COMPARATIVE lack of DEMAND would PROVE and CONFIRM that the previous reaction was a (SOW). Thus DO NOT take a speculative position until you see an (UT) or an (UTAD), or where there is no (UT), the first place to take a position is on the (LPSY) after the (SOW) and aim to pyramid with the coming trend.
Spring: a spring is a refinement of Mr. Wyckoff ‘s concept of a Terminal Shake-Out and grew out of that concept. A spring is a penetration below a previous support area which enables one to judge that quality and quantity of that supply on that penetration. The CRITICAL thing that is shown by the SPRING or the TERMINAL SHAKEOUT is the AMOUNT of SUPPLY that COMES OUT on the DRIVE to NEW LOW GROUND and HOW WELL that SUPPLY IS ABSORBED. Remember this vital point, it is important. The main difference between the spring and the terminal shake-out is how far it penetrates into new low ground. Example: in a $50 dollar stock if the drive into new low ground is 4 or 5 points and then it turns around, we would call that a terminal shake-out. However, if it reacted or penetrated ¾ or a point, a point or a point and a ½ or a much shorter penetration we would call this a spring. Additional definitions: As the stock goes into new low ground one of two things will happen. Either overwhelming supply will come in or no supply. Overwhelming supply is a 1-spring, it is evidenced by a wide open break in price action and very heavy volume. A 3-spring is with no significant price weakness and low volume on the penetration into new low ground. There is a very large area between these two extremes. We call these number 2-springs and a 2-spring is very similar to a terminal shake-out in that both have supply and both must be tested by a secondary test. It is VERY IMPORTANT to understand that there is NO CLEAR CUT LINE of demarcation between a #1 spring and a #2 spring, a #2 spring and a #3 spring. The CRITICAL FACTOR is NOT the TERMINOLOGY, the CRITICAL FACTOR is YOUR UNDERSTANDING of the relationship of SUPPLY to DEMAND in the BASE area and on the SPRING.
#1 SPRING: The #1 SPRING has OVERWHELMING SUPPLY which is indicated by a EXTREME PRICE WEAKNESS and heavy selling. The PRICE and VOLUME characteristics are that there is a WIDE SPREAD and HEAVY INCREASE in VOLUME. This is EVIDENCE of an ABUNDANCE of SUPPLY. The stock goes through the T/R on the DOWN SIDE and continues DOWN until the DOWNTREND can FINELY be HAULTED. If the stock has been under accumulation, usually it will REQUIRE EXTENSIVE further PREPARATION before the stock is READY TO MOVE OUT of the accumulation area. Usually however, the #1 SPRING is PRECEDED by at least MINOR DISTRIBUTION and OFTEN, INTERMEDIATE or MAJOR DISTRIBUTION. The #1 SPRING is FAR MORE LIKELY to occur in stocks which are in MAJOR and SUSTAINED DOWNTRENDS then they are to occur in UPTRENDS. HEAVY SUPPLY and small demand a #1 spring.
#2 Spring: now there’s a VERY LARGE AREA in-between the #1 and the #2 SPRING in which there is SOME SUPPLY. We call this a #2 SPRING. The SUPPLY on the #2 SPRING is evidenced by SOME INCREASE in PRICE WEAKNESS, in other words SOME INCREASE IN THE WIDENING of the SPREAD as it goes INTO NEW LOW GROUND and SOME INCREASE in the VOLUME over the GENERAL level of TRADING. SUPPLY is not absent, it is NOT OVERWHELMINGLY ABUNDANT.
That SUPPLY will either be ABSORBED, in which case it will be a #2 plus SPRING, or a 23 spring, (supply on the #2 spring itself and then a LACK of SUPPLY on the S/T), or it will not be absorbed and SUPPLY will persist and persist and persist driving the PRICE DOWN and will have the SAME effect as a #1 SPRING. This alternative we call a #2 minus SPRING, or a 21 spring, (the weight of SUPPLY is increased & increased until the demand simply cannot handle it). The #2 minus SPRING has the SAME effect as the #1 SPRING in that the SUPPLY persists and persists and persists and DRIVES the PRICE of the stock DOWN, DOWN and DOWN until it is finally halted and has to start a NEW SUPPORT LEVEL all over again. SUPPLY DEMAND is more in balance with a #2 spring, hence the need for a secondary test. Incidentally the PRICE and VOLUME indications on a #2 SPRING are LESS LIKELY to be CLEAR CUT then on a #1 spring or a #3 spring. The classic illustrations are FEW and FAR in-between. This is why it is necessary to STUDY MANY EXAMPLES and to have examples from different periods of market history.
#3 Spring: The second alternative is that NO SUPPLY is DUMPED on the market. No INCREASE in SUPPLY can COME OUT on the DRIVE into NEW LOW GROUND we call this a #3 SPRING. The #3 Spring is evidenced by lack of a INCREASE in the general level of trading. Any INCREASE in volume if at all is very, very MINOR. And there is a lack of IMPORTANT PRICE WEAKNESS as it goes into NEW LOW GROUND and the SPREAD does NOT materially WIDEN. Small supply and HEAVY DEMAND a #3 spring.
(ordinary) Shakeout (OS): the DIFFERENCE between the Terminal Shakeout and a ordinary Shakeout is that the ordinary Shakeout occurs in an UPWARD trend. The Terminal Shakeout occurs at the END of the ACCUMULATION area and at the END of a TRADING RANGE or a SUPPORT AREA. While the ordinary Shakeout occurs in an UPWARD trend. An ordinary Shakeout maybe defined as a sharp DOWNWARD THRUST occurring in an UPWARD TREND without extensive previous preparation. It is executed for the purpose of buying all the stock possible from WEAK or VULNERABLE holders, it is PRECEDED By an UPWARD move. The ordinary Shakeout is characterized by PRICE WEAKNESS and usually an INCREASED VOLUME. In other words a WIDE SPREAD and some INCREASE in VOLUME. However, the VOLUME maybe HIGH, MEDIUM or LOW. When there is SUPPLY on the Shakeout itself it must be tested by a SECONDARY TEST. The secondary test should have a NARROW SPREAD and a DECREASED VOLUME compared to that of the ORDINARY SHAKEOUT. This indicates that there was less SUPPLY on the secondary test then there was on the Shakeout and the buyers then KNOW that the stock is AGAIN prepared to MOVE UP with relative SAFETY.
Taking a Position in a Stock: if important accumulation or distribution in a stock is going on it is very difficult to hide it, this will normally show up on the charts. When it is not clear stay out! When indications are clear take a position with the timing and the profit risk ratios in your favor. Your first job is to protect your capital, your second job is to obtain a profit when the risk is in your favor.
Terminal Shake-Out (TSO): is a sharp downward thrust through a previous support area. A spring is a refinement of Mr. Wyckoff ‘s concept of a Terminal Shake-Out and grew out of that concept. It is executed for the purpose of buying all the stock possible from weak or vulnerable holders. It is PRECEDED by a TRADING RANGE or a SUPPORT LEVEL or at the end of ACCUMULATION area. It is FOLLOWED by an attempted to begin the markup phase of the cycle. The Terminal Shakeout is a drive down through the support level for the purpose of SHAKING-OUT all of the people who can be scared-out or forced out of the market and forced to sell. The CRITICAL thing that is shown by the Terminal Shakeout is the AMOUNT of SUPPLY that comes OUT on that Shakeout and whether or not that SUPPLY is ABSORBED. Remember this vital point, it is important.
Thrust: measures the price progress the stock or index makes on each wave within the trend. The thrust is the price difference between consecutive tops in up trends, or between consecutive bottoms in down trends. To measure the thrust we draw a series of horizontal lines at the level the highs and lows are reached on the drives within the trend and connect them with a vertical line.
Trading Range(TR): a condition characterized by temporary price trends, which are offset by ensuing moves in the opposite direction, and by a persisting equilibrium in the supply-demand relationship. Behavior of: Generally in the first part of the trading range the price swings are rather wide. Then in the later part of the trading range the price action usually begins to narrow down. The stock gets dull. What happens to the volume or the general level of trading, usually in the early part of this range there is rather high volume sometimes rather erratic volume both the price and volume action maybe somewhat erratic and very difficult to analyze. Then in the latter part the closer you get to the end of the trading range or leaving the trading range the volume begins to dry up. As the floating supply or the flow of orders come into the market and begin to decrease the general level of the daily volume should decrease. Actually you do not know for certain that the T/R is distribution until it goes through the testing process as in 3rd area. the T/R maybe accumulation, distribution, or nothing, nothing being an area in which no one is preparing for a large move, thus a stock may remain in the T/R indefinitely until it has a (SOS) followed by a (LPS) indicating an Upward move, or a (SOW) followed by a (LPSY) indicating a Downward move. Furthermore the early part of the T/R maybe nothing and only the later part of distribution. This is why it is extremely important that you NOT establish a long or short position in the T/R unless the stock has clear indications of leaving the T/R and beginning a NEW TREND.
Trend: to have or to take a particular direction, it is the underlying or prevailing tendency of inclination of movement-a tendency to move in a particular direction. There are three primary types of trends classified as direction of movement: a upward trend, a downward trend and a sideways trend or treading range. Remember, that the longer that the trend is in progress and the nearer you are to the end of the trend the more risk attends buying, or selling short on the corrections around the ½ way area. Your greatest profit potential and your least risk will occur when the stocks are leaving the accumulation, or distribution areas or are very early in the trend, it is at this point where your profit risk ratio will be the greatest and you will be able to use liberal stops. A trend may be corrected by an ordinary shake-out.
Trend lines (TL): in an uptrend the bottom line is called the support line and the top line is called the supply line. In a downtrend the top line is called the supply line and the bottom line is called the support line. In a trading range the bottom line is called a support line and the top line is called a resistance line. The breaking of a trend line may result in establishing a slower or faster trend in the same direction or in a completely new trend. The Supply/Demand relationship will determine the continuing trend, it can change rapidly and must be watched closely. The price failing to reach one line in a trend channel during rallies & reactions leaves the other vulnerable to being broken. A helpful tool to use is to draw an arrow from a stopping point to the trend line to indicate the failure to reach that particular trend line.
Reverse Trend lines (RTL): There are two kinds of trendlines: the normal use and the reverse use. In the normal use of trendlines in an upward trend we draw the support line first through two consecutive reactions. The supply line is drawn second through the rally that is between the two consecutive reactions, and parallel to the support line. With the reverse use of trend lines used in an upward trend, we draw the supply line first, through two consecutive rallies followed by a support line drawn second through the reaction that is between the two consecutive rallies, and parallel to it. In a downtrend using the reverse use of trendlines the support line is drawn first through two consecutive support points and the supply line is drawn parallel to it through the top of the rally occurring between those two support points. The importance of the reverse use of trend lines is that it is determined by points a which the opposition came in to stop the move. The reverse use of trend lines is drawn through where it is stopped, where the opposition came in and actively stopped the trend, to stop it and reverse it even on a temporary basis. Later on demand might come in at the same angle to stop the move.
Trends of four primary kinds: the intraday, the minor, the intermediate, and the major
INTRADAY TRENDS: are caused by very small fluctuations those fluctuations occurring within a day. There maybe several of these occurring within one day. Intraday trends are usually a day or two in duration.
MINOR TRENDS: are made up usually of three or more intraday trends and are moves of up to approximately ten percent of the price of the stock. Usually they last up to a couple of days to a couple of weeks and are moves of up to approximately 10% of the price of the stock.
INTERMEDIATE TRENDS: which are made up of three or more minor trends and are movements of around fifteen to twenty percent of the stock. They usually run for a couple of weeks to a couple of months and are movements of around 15% to 20% of the stock.
MAJOR TREND: is made up of three or more intermediate trends and is a movement of over twenty-five percent of the price of the stock. Usually major trends will last for several months or perhaps much longer and is a movement of over 25% of the price of the stock.
Upthrust (UT): : An Upthrust is a sharp price movement ABOVE a prior supply level which does NOT HOLD, but immediately reacts below that previous level. Usually on the Upthrust the spread will be narrow and the volume will be increased, this is evidence of the supply overcoming demand. Suppose a stock moves up from $50.00 to $51.00 and it takes 10,000 shares to do it and then moves to $52.00 and it takes 20,000 shares to do it. The volume, the supply has increased in strength relative to demand. If the volume doubles the price progress should be double and when it does not the inference maybe drawn that the SUPPLY is OVERCOMING the DEMAND. Suppose a stock moves up one point on 10,000 shares and then moves up a ½ point on 20,000 shares, here the narrowing of the spread and the supply coming in to overcome the demand is much more emphatic. This usually is what occurs on a Upthrust. The confirmation that it is an Upthrust is in the promptness and in the manner in which it reacts, it should react promptly to show that the attempt to leave the T/R on the Upside has failed and generally it will react with either a lack of demand or with the pressure of supply coming in on the downside. The Upthrust itself is the sign of weakness (SOW) and the Last Point of Supply (LPSY) all in the same action. It is normally followed by a more important (SOW) and a (LPSY).
Upthrust After Distribution (UTAD): The Upthrust after distribution is a special type of distribution in which the stock goes up! Stops going up, builds a cause and then tries to leave that T/R on the upside, fails and then begins the downtrend. In applying the rules you must use some judgment and some flexibility. The Upthrust After Distribution is a special market phenomena or a principal which Mr. Evens defined through his Wyckoff studies. Perhaps the most important problem that you will have with the Upthrust After Distribution (UTAD) is that you must avoid looking for examples, or expecting examples of the (UTAD) to occur all the time, they simply DO NOT. However when they do occur the (UTAD) can be an extremely helpful and profitable tool. Let us read the rule itself. After a stock index or a commodity has moved up, has Climaxed, has then moved laterally and built a POTENTIAL cause and is then moved into new high ground on a increase in volume and a relative narrowing of the spread to then return to the AVERAGE level of closes would indicate that the entire lateral level was NOT accumulation, but was distribution instead. MEMORIZE THIS RULE, in Mr. Evan’s original rules he stated: it moves sideways for a period of four to twelve weeks. However, to put these constraints on the rule has proved to limit the understanding of this excellent rule. Therefore we have modified the rule and have used: “The building of a potential cause”. The only other change in the rule is that we now say that it has moved into new high ground on a “relative“ narrowing of the spread, we have added this word relative because a widening or a narrowing of the spread is RELATIVE to the VOLUME. The spread MUST BE COMPARED to the VOLUME. Every word in the rules for the (UTAD) had been designed for a purpose.
Volume: What is the difference between climax VOLUME and that which is known as BREAKOUT VOLUME or ABSORPTION VOLUME ? Both generally have an WINDENING SPREAD and INCREASED VOLUME. However, the CLIMAX VOLUME is stopping a trend which is out in open territory and has been in progress. ABSORBTION VOLUME ( progress/price action & push/volume) however, occurs with a WIDENING SPREAD and INCREASED VOLUME as the stock is breaking through a previous SUPPLY AREA and is simply absorbing ALL of the SELLING that takes place as it moves up to NEW HIGH GROUND. This process also occurs in reverse on the downside.
Volume Off The Bottom: Volume off the bottom is caused by the professional man simply absorbing all the supply thrown off the market and moving the stock UP. It usually indicates a turnaround.
Wave: Intraday, Minor, Intermediate, Long term, Fluctuations that build-up & build-down and form trends. Actually every upward or downward swing in the market whether it amounts to many points, or only a few points, or fractions of a point consists of numerous buying & selling waves. These have a certain duration, they run just so long as they can attract a following. When this following is exhausted for the time being that wave comes to an end and a contrary wave sets in. These waves represent the shifting relationship of Supply to Demand.
THESE TERMS ARE DEFINED IN RELATIONSHIP TO THE MANNER IN WHICH THEY ARE USED IN THE TEXT AND AT WYCKOFF SMI.
Absorption: The reduction of the floating supply caused by persistent longer term buying within a trading range.
Accumulation: The establishment of an investment or speculative position by professional interests in anticipation of an advance in price.
Advance: A rise in price or an upward movement in a stock, index, security, etc.
(Short) Against the Box: A protective action in which one sells short a security which he currently owns. The purpose of this action is that of eliminating risk during a period of market uncertainty.
Angle of Advance: The inclination of a rising price trend.
Angle of Decline: The inclination of a lowering price trend.
Apex: The focal point of converging support and supply lines. (See dead center, hinge, pivot, wedge).
Average: A numerical representation which purports to reflect the mean (average) price of a particular class of stocks.
Averaging:
(1) Dollar Averaging: a periodic investing of a definite number of dollars irrespective of the number of shares involved;
(2) Share Averaging: periodic purchases of the same number of shares irrespective of the number of dollars required.
(3) Averaging Up: periodic purchases on a rising scale whose purpose generally is to pyramid profits; and
(4) Averaging Down: periodic purchases as a price declines, which has the general purpose of lowering the mean cost of the stock.
Bear: A speculator who concludes that the probable future trend will be one of declining prices.
Bear Market: A market condition characterized by declining prices.
Breakthrough: A price movement above/below a previous supply/support area.
Bulge: A sudden expansion of price or volume. (However, bulge generally is used in reference to volume.)
Bull: A speculator who concludes that the probable future trend will be one of advancing prices.
Bull Market: A market condition characterized by advancing prices.
Buying Climax: A situation characterized by the highest intensity of speculative demand occurring within an uptrend. This situation occurs only after a move has been in effect for some time. This condition marks the end or the approaching end of the particular uptrend.
Campaign: An organized market operation for the purpose of moving the price of a stock.
Close: The last price of a security, issue, index, etc. for a specific time period. Generally, the last price of the day.
Commitment: A market position in a stock or other trading medium.
Common Stock: Securities which represent an ownership interest in a corporation. If the company has also issued preferred stock, both common and preferred have ownership rights, but the preferred normally has prior claim on dividends .and, in the event of liquidation, assets. Common stockholders assume the greater risk but, generally, exercise the greater control and may gain the greater reward in the form of dividends and capital gain.
Composite Average: An index composed of a number of stocks which is used to represent the general market. Normally constructed by adding the prices of a limited but fixed number of stocks, adjusting for splits, etc., then dividing by the number of stocks making up the average.
Composite Man: The term used to refer to the sponsors or large professional interests in the stock market, also called composite operator.
Corner: A condition in which the available supply of stock is held by a single speculative interest for the purpose of effecting a controlled price rise. The purpose of a corner is that of forcing those who have sold the stock short to pay an inordinately high price to cover their short position.
Cover: The act of buying a security previously sold short. (See short sale, short covering).
Culminating: The ending of a move.
Day Order: An order to buy or sell which is good only on the particular day on which it is made.
Dead Center: The focal point of converging support and supply lines. (Also, apex, hinge, pivot wedge).
Deduction: The form of logic or reasoning which proceeds from the general statement to the specific case.
Distribution: The elimination of a long investment or speculative position.
Dividend: The payment designated by the Board of Directors to be distributed pro rata among the shares outstanding.
Down Tick: A transaction with a price lower than that of the last preceeding transaction.
Ex-Dividend: (Without Dividend) The condition of a stock in which the purchasers are not entitled to the most recently declared dividend. (Abbreviated xd)
Figure Charts: A chart of a stock, commodity or index, which takes into consideration price movements and fluctuations. Volume and regular time intervals are not generally used in the construction of figure charts.
Floating Supply: The supply of stock that is normally available for purchase during a given period of time.
Force Index: An index developed by the Stock Market Institu te to portray the investment factors during continuous periods of market history.
G.T.C. (Good ’til Cancelled): A customer’s order to his broker to buy or sell securities at a specified price. The order remains in effect until it is either executed or cancelled.
Hedge: A condition in which both long and short positions are maintained by the same interests.
High: The highest price of a security, issue, index, etc., for a specific time period. Generally , the highest price of the day.
Hinge: The focal point of converging support and supply lines. (See apex, dead center, pivot, wedge).
Hypodermics: A deliberately forced, fast mark-up in the price of a common stock. The purpose of hypodermics is the stimulation of uninformed buying in order to facilitate distribution.
Index (Price): A statistical instrument which is used to determine the trend of a particular class of security. This is not an average.
Induction: The reasoning process or logic which begins with specific cases and proceeds to a broad generalization.
Inside Day: A day for which the high and low prices are, respectively,lower and higher than those of the preceding day.
Institutional Investors: Generally, large corporate investors such as banks, insurance companies, investment trusts, mutual funds, pension funds, colleges and universities, and charitable foundations.
Intermediate Trend: A price movement which has two basic characteristics. These are (a) a move of approximately 15% of its value and (b) a duration of two weeks to two months.
Intra-Day Wave Chart: A continuous line chart reflecting the price swings occurring entirely within a single day’s trading (IDWC).
Investment Position: Securities holdings established for investment purpose only.
Law of Supply and Demand: The basic economic law used to explain the cause of all price changes.
Limit Order: An order to buy or sell only at a specified price or at one more favorable than the specified price.
Line of Least Resistance: The trend of security prices, whether it be advancing or declining.
Liquidation: The process of converting securities and/or other property into cash.
Locked-In: A psychological state of mind which exists when an individual believes that he cannot afford to liquidate a security position.
Long: The ownership of securities.
Long-Sale: The sale of a long security position.
Long Terms: Financially , it is considered to be a five year investment; the tax definition is six months.
Low: The lowest price of a security, issue, index, etc., for a specific time period. Generally, the lowest price of the day.
Maintenance Margin: The minimum margin required in order to maintain a previously established position.
Margin: The amount of money deposited by a customer when he uses credit to buy securities, the balance being financed or advanced by the broker.
Mark-Down: A sustained downward price movement.
Market Order: An order to buy or sell at the best price available at the time the order is received at the appropriate trading post.
Mark-up: A sustained upward price movement.
NYSE: New York Stock Exchange.
Odd Lot: An amount less than the established round lot for any class of security.
Option: A contractual right to buy or sell a security at a specified price within a specified period of time.
Optimism-Pessimism Index: An index developed by Wyckoff SMI which reflects the optimism due to buying and pessimism due to selling during any specific period of market history.
Overbought: A condition in which the supply – demand relationship for a particular class of securities is such that normal equilibrium between economic forces exists only at a price below that at which the current trades are being made.
Oversold: A condition in which the supply – demand relationship for a particular class of securities is such that normal equilibrium between economic forces exists only at a price above that at which the current trades are being made.
Preparation: Transactions designed to affect the supply – demand relationship for a security order to facilitate its future price move.
Pressure: Sustained selling of a security.
Primary Distribution: The initial liquidation of a long position.
Process of Rotation: The principle that all securities of a class do not prepare, advance, or decline at the same time. Some stocks lead the various stages while others lag.
Puts and Calls: Options which give the right to buy or sell a fixed amount of a certain stock at a specified price within a specified time. A put gives the holder the right to sell and a call gives the holder the right to buy.
Pyramid: The use of accrued profits to enlarge a speculative position.
Rally: A short term advance in the price of any securities or class of securities.
Reaction: A short term decline in the price of any securities or class of securities.
Resistance: Opposition to advancing prices caused by an increase in the available supply.
Round Lot: A unit of trading. On the New York Stock Exchange the unit of trading is, generally, 100 shares in stocks and $5,000 par value in the case of bonds.
Secondary Distribution: The liquidation of a long security position occurring after primary distri bution but prior to the next mark-down phase. A plateau in a big down move.
Securities: Stocks, bonds, commodity futures contracts, or other issues which may be traded.
SEC: The Securities and Exchange Commission established in 1934 by Congress to regulate the investment industry.
Security Position: Securities held long and/or short by investors and/ or speculators.
Selling Climax: A situation characterized by the highest intensity of speculative supply occurring within a downtrend. This situation occurs only after a move has been in effect for some time. This condition marks the end or the approaching end of the particular downtrend.
Shakeout: A deliberately forced price reaction, whose purpose is that of stimulating pu blic selling in order to facilitate the accumulation of speculative positions.
Short Covering: Buying stock to eliminate or close out a short position.
Short Position: Securities and/or commodity future contracts sold short.
Short Sale: Sale of a borrowed stock by a person who believes the price will decline. i.e. You instruct your broker to sell short 200 shares of XYZ. Your broker borrows the stock so he can deliver the 200 shares to the buyer. The monetary value of the shares borroweu is deposited with the lender. You are later required to cover your short sale by purchasing the same amount to return to the lender.
SMI: Wyckoff SMI
Speculation: To assume a market risk in expectation of gam; especially, to buy or sell m expectation of profiting from market fluctuations.
Springboard: A condition in the price movement of a stock that has completed preparation and has been brought to a point where the stock may move into a mark-up or a mark-down period.
Stop Limit Order: An order to buy or sell which becomes a limit order as soon as the stock’s price reaches or sells through a specified stop price.
Stop Order: An order to buy or sell which becomes a market order as soon as the price of the stock reaches or sells through the specified price.
Straddle: Going long in one security or option and short in another.
Strength: A security or class reflects strength when its price shows the ability to advance.
Strong Technical Position: Condition in which normal available demand exceeds floating supply.
Supply Line: In a downtrend a line connecting at least two important points of supply.
Support: Opposition to declining prices caused by the increase in available demand.
Tape Reader: A person trained to determine the characteristics of market fluctuations, using data which he derives from the ticker tape.
Technical Position Barometer: A chart which graphs the number of stocks in the various positions as determined by the Wyckoff Position Sheet.
Technical Rally: A technical rebound. A part of a typical selling climax. (Automatic rally)
Technical Reaction: Opposite of technical rally-part of a typical buying climax.(Automatic reaction)
Technometer: An index developed by the WyckoffSMI for the purpose of indicating normal extremes in the supply – demand conditions.
Terminal Shakeout: A sharp downward thrust through a previous support area. Executed for the purpose of buying all the stock possible from weak or vulnerable holders.
Terminal Thrust: A temporary bulge through the top of a trading range which fails to hold.
Thrust: The price difference between consecutive tops in uptrends or between consecutive bottoms in downtrends.
Thrust Movement: A sharp run-up out of an area of distribution; or a temporary bulge through the top of a trading range which fails to hold (Synonym: upthrust).
Trade: To buy or sell stocks, securities, options, etc.
Trading Range: A condition characterized by temporary price trends, which are offset by ensuing moves in the opposite direction, and by a persisting equilibrium in the supply – demand relationship.
Trend: The line of least resistance. It is the direction in which a price is moving.
Trend Barometer: A statistical tool which is portrayed graphically and consists of the Momentum Index, the Force Index and the Technometer. This was developed by the WyckoffSMI.
Trend Charts: These are charts which graphically depict the trend of the market, an index, or an individual stock.
Turning Point: The place at which a security price trend reverses its direction.
Upthrust: A sharp price movement above a prior supply level, which does not hold, but immediately reacts below that previous level.
Vertical Line Charts: Charts which graph the volume, high, low, and closing prices for the day, week, month, or year of any security or class of securities.
Warrants: Rights to buy a stock at a specific price. Generally, issued for longer periods of time than ordinary stock subscription rights.
Weakness: The ability of price to decline.
Weak Technical Position: A condition in which normal available demand is exceeded by the floating supply.
Wedge: The focal point of converging support and supply lines. (See apex, dead center, hinge, pivot.)
Whipsawed: A situation in which a speculator is repeatedly wrong no matter what he does. It usually results from buying at the tops and selling at the bottoms.
Up-Tick: A transaction where the price is higher than that of the previous transaction.
Zero-Minus Tick: A transaction price identical to the preceding price(s) which itself had been a down-tick.
Zero-Plus Tick: A transaction price identical to the preceeding price(s) which itself had been an up-tick.


