Looks Like A Spring
Technical Analysis of Stock Trends, The Wyckoff Wave – Week in Review October 14, 2016
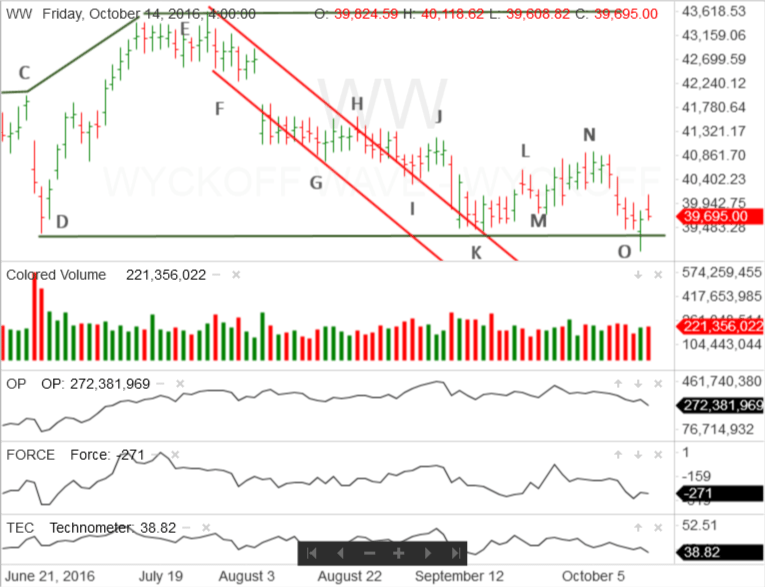
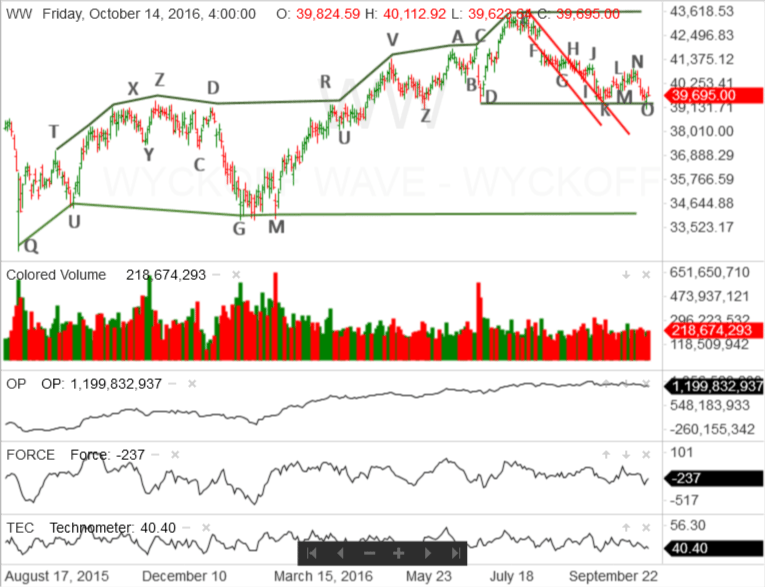
On Thursday, the Wyckoff Wave reacted through the support line drawn from point D. This support line marks the latest phase in the trading range that began last August. A vertical line chart showing the entire trading range can be found at the end of this post.
A Spring occurs when an index or stock reacts through an important support point of a trading range or a phase of the trading range. It is called a Spring because once it penetrates the support, demand returns and the stock Springs up and rallies back into the trading range.
That means the Spring is confirmed, when strong demand comes into the index or individual stock.
In this case, while demand came into the market and the Wyckoff Wave rallied, it was not overpowering. If the Spring was going to be confirmed on Friday, demand needed to continue. The Wyckoff Wave needed to rally on increased price spread and volume.
That didn’t happen. Instead, the Wyckoff Wave experienced an intra-day failure to the upside. After a nice gap opening, the Wyckoff Wave continued to rally, but quickly encountered supply.
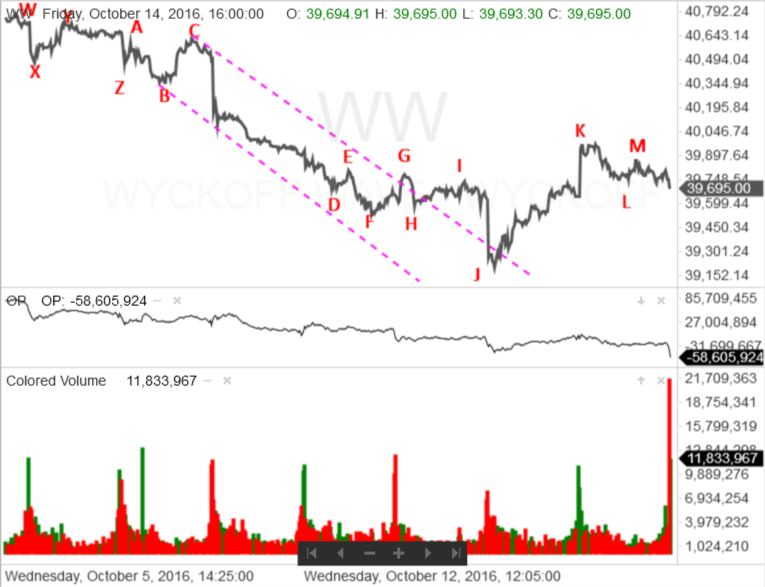
The day’s market action is shown on the intra-day line chart. Point K marks the end of the morning rally, which included the gap opening. Then the Wyckoff Wave reacted for the rest of the trading day.
A Spring is completely confirmed when there is a successful Secondary Test. This would mean that after the initial rally, an index or stock reacts back towards the support. In order for the test to be successful, supply needs to dry up. Therefore, it is important to see reduced price spread and volume on the reaction. In addition, the reaction needs to end above the Spring’s low.
Although the Wyckoff Wave did not rally as strongly as one would like and supply did come into the market on Friday, there is still a good probability that the Secondary Test will be successful.
The supply that came into the market was not overly strong and, as one can see on the intra-day line chart, the Wyckoff Wave did not make a great deal of progress to the downside.
The Technometer is in an oversold condition. In addition, it is slightly more oversold than it was on Thursday. However, the Wyckoff Wave is at a slightly higher level. It is a bullish indication when the Technometer becomes more oversold at a higher level than it was at its previous low.
In addition, if the Wyckoff Wave continues to react, the Technometer is expected to become even more oversold. This would make it difficult for the Wyckoff Wave to react through the Spring.
The Optimism – Pessimism Index is noticeably lower than it was at point K. However the Wyckoff Wave is slightly higher than it was at point K. This is a short-term positive divergence. More importantly, the Wyckoff Wave is in a positive inharmonious action with its O-P Index when compared with point D.
All this suggests that the Wyckoff Wave has put in a significant effort to the downside, but is not obtaining the desired results. This makes the Wyckoff Wave vulnerable to rally and is another indication that the Secondary Test should be successful.
All this suggests that the Wyckoff Wave will probably continue to react on Monday. However, the reaction should be on narrower price spread and lower volume.
If that happens, the Wyckoff Wave could put in a successful Secondary Test and begin to rally back towards, and quite possibly through the top of this phase of the trading range.
It is quite possible this long and rather boring trading range is coming to an end and we will see a nice move to the upside.
Responses