Our New 5 Minute Intraday Line Chart with Corresponding OP
We are pleased to show our new chart for all symbols that shows a 5 minute line chart with the corresponding volume as shown by the OP. Just one of the tools to help the technical trader!
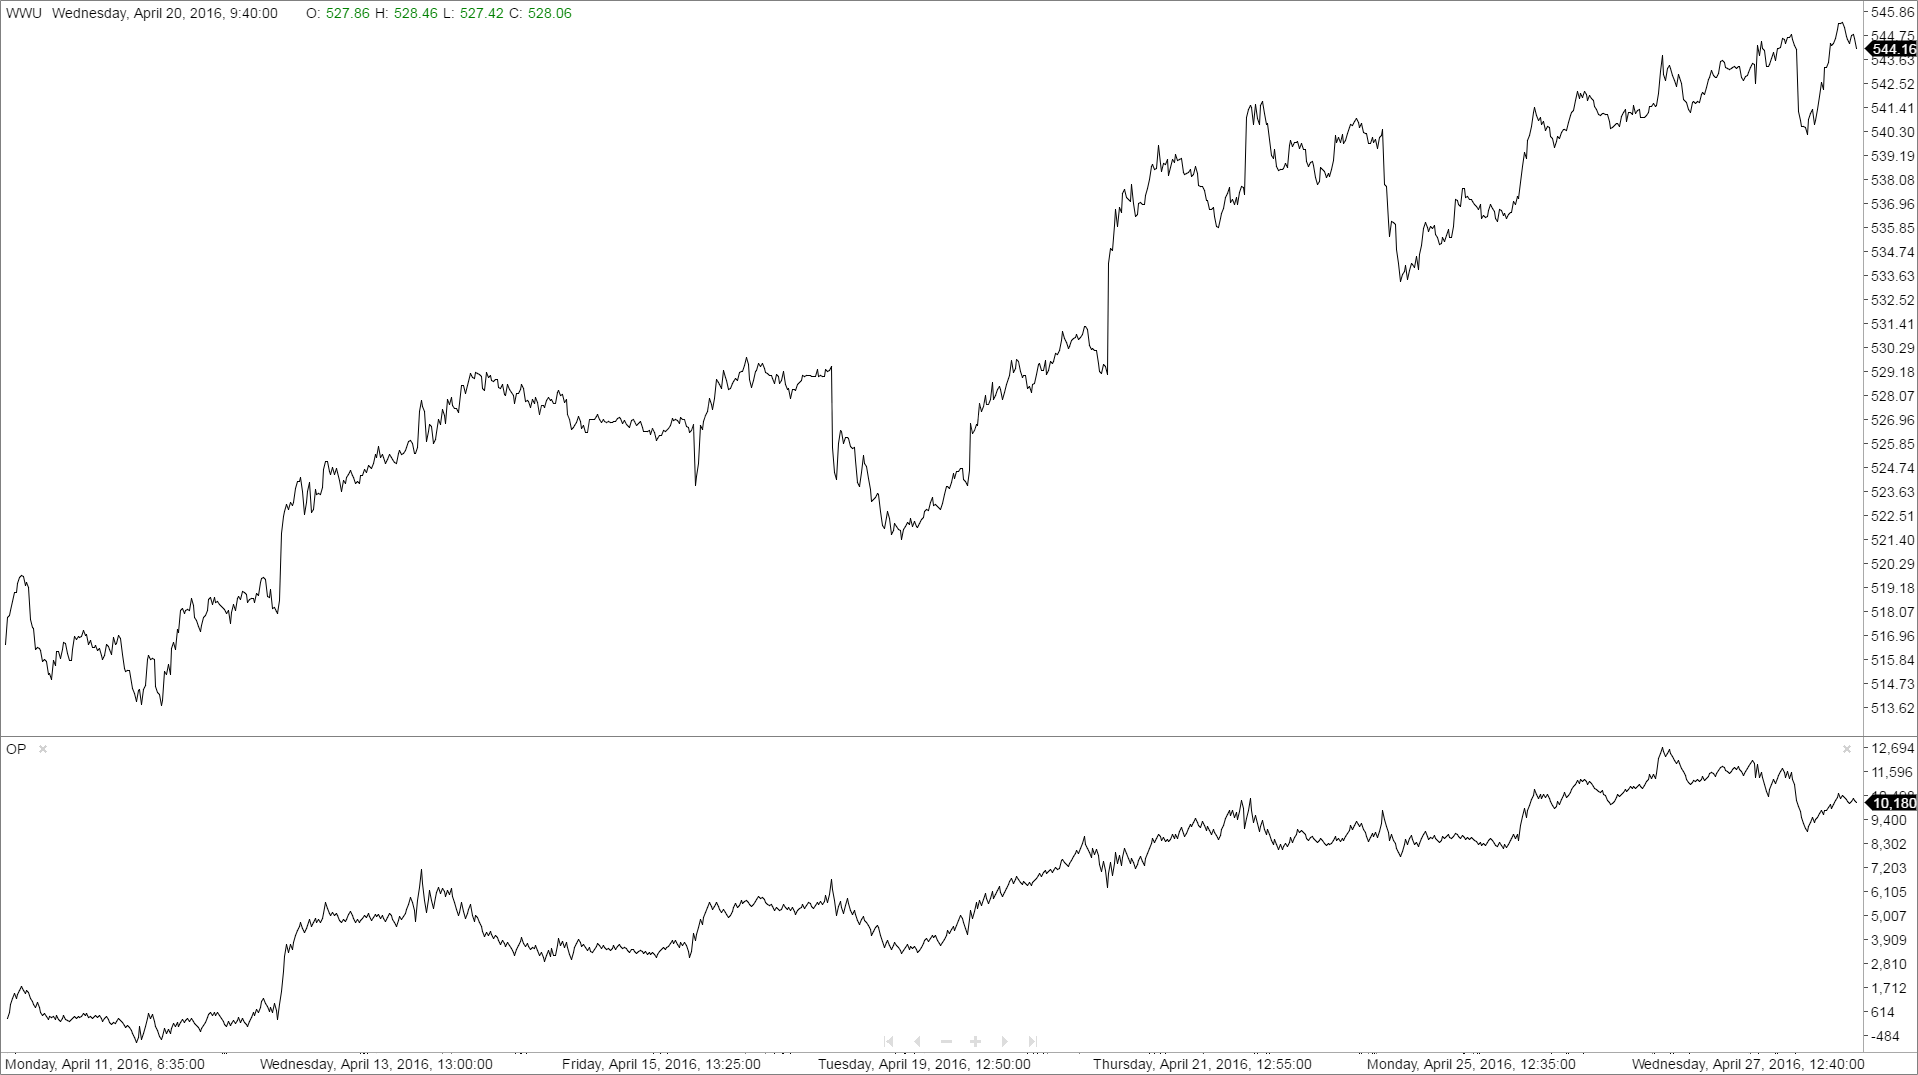
We are pleased to show our new chart for all symbols that shows a 5 minute line chart with the corresponding volume as shown by the OP. Just one of the tools to help the technical trader!
Click Here For Wyckoff Wave Chart 06-27-11 Our last post ended with the Wyckoff Wave at point Y. The Wave was in an overbought position…

The Wyckoff Wave closed the week down sharply, on low volume. For the last week and a half, the Wave had met resistance at its…
As you know, we think TLT which is the 20 yr Treasury ETF, will continue to work lower, which will keep interest rates rising. We…
We want to show an example on why the Optimism-Pessimism Index, which is a part of our “Pulse of the Market” charting software, is so…
Click Here For Wyckoff Wave Chart 11-24-11 Ever since I began writing my Weekly Market Reports, to post on the blog, and my daily Pulse…
Please confirm you want to block this member.
You will no longer be able to:
Please note: This action will also remove this member from your connections and send a report to the site admin. Please allow a few minutes for this process to complete.
Responses