Does News Move The Market?
Technical Analysis of Stock Trends, The Wyckoff Wave – Week in Review November 11 2016
On election night, when it first appeared that Donald Trump could win the presidency, the S&P 500 futures crashed. The uncertainty of what might happen during a Trump presidency caused many futures traders to liquidate assets.
This panic was just what the market need. On Wednesday, the stock market, as measured by the Wyckoff Wave opened slightly lower. Then, strong demand returned and the Wave rallied strongly on wide price spread and noticeably increased volume.

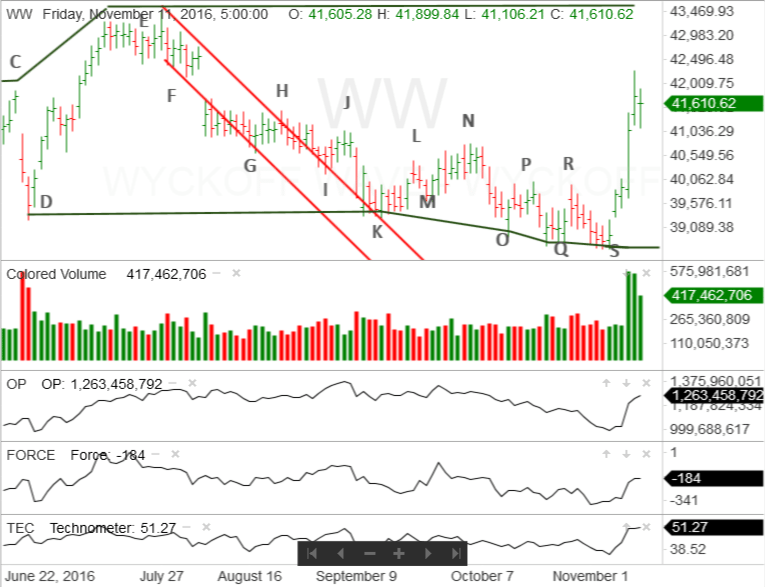
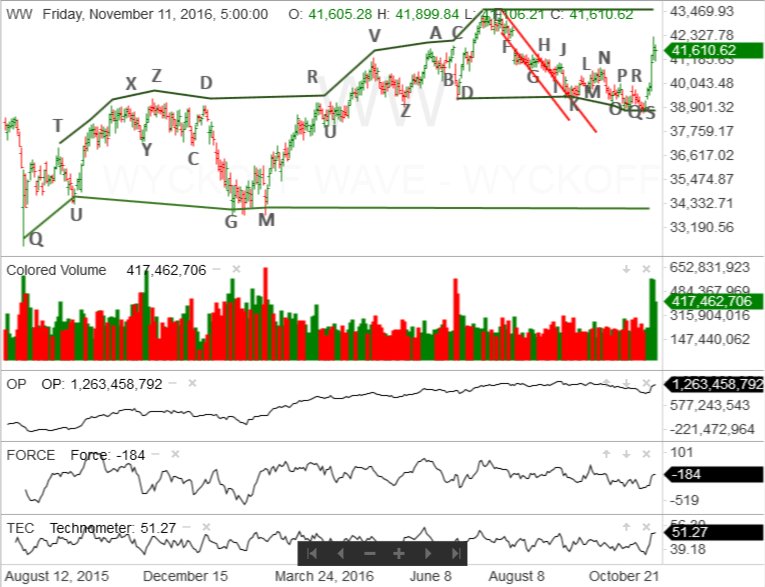
For quite some time, it appeared the Wyckoff Wave was going to rally off the support created by the latest phase of the 15 month trading range that began back in August 2015. However, that pesky overhanging supply created a sideways movement which started at point K, on the vertical line chart.
However, even though the rally attempts stalled, the Wyckoff Wave was ready to move and test the trading range highs at point E. At some point, that rally was going to begin and the Wyckoff Wave would move back to the top of the trading range and even attempt to leave the range to the upside and enter into new high ground.
An old Wyckoff axiom says, “News doesn’t move the market, it simply takes it to where it was already going to go”. It appears that is what happened this week.
It is quite possible that the aftermarket futures trading created enough panic that took in the overhanging supply. It is quite probable that buyers were happily waiting to buy stocks being dumped into the market. That accounts for the strong demand that came into the market on Wednesday.
The Wyckoff Wave did not Spring the trading range. While a Spring is usually the start of ending action, another form is a Sign of Strength, which lies within a trading range. It appears that the Wyckoff Wave is doing just that.
This week’s rally has taken out the earlier highs from points R through H. The Wyckoff Wave has encountered some resistance at the support area marked as point F.
On Thursday, while the volume stayed relatively high, price spread noticeably narrowed. This is an indication that supply is coming into the market. On Friday, the Wyckoff Wave reacted on narrowing price spread and lower, but relatively high, volume. This suggests the Wyckoff Wave may be beginning a corrective reaction, within the trading range,. This could result in a Last Point of Support.
The Wyckoff indicators seem to be supporting the reaction scenario. The Optimism – Pessimism Index is in a negative divergence with the Wyckoff Wave when compared with points J and H.
The Technometer is in an overbought condition. In addition, the Force Index is producing moderately negative readings. This suggests that there is enough supply in the market to fuel a small reaction.
If the Force Index was producing low negative, or positive, readings the Wyckoff Wave could rally through the overbought condition. These moderate negative readings suggest that it will not.
If the Wyckoff Wave reacts this week, as expected, it will be important to watch the price spread and volume. If the Wave is going to put in a Last Point of Support, both price spread and volume need to be reduced. In addition, it would be helpful for the Wyckoff Wave to complete the reaction at or above the halfway point of the rally off point S. In this case, that is right in the area of points P and R.
Points P and R have become an area of support and this would be a normal place for the reaction to end.
If the Wyckoff Wave puts in a Sign of Strength and a Last Point of Support, within the trading range, it will have an opportunity to rally through the top of the trading range into new high ground.
The rally would be a second Sign of Strength and in Wyckoff terminology a ” Jump Across The Creek”.
If these scenarios play out, the Wyckoff Wave could move into new high ground and begin an important intermediate, or even long-term move to the upside.
I’ll bet those folks dumping futures, during after-hours trading, wish they had them back.


Responses