That Pesky Supply. When Will It Dry Up?
Technical Analysis of Stock Trends, The Wyckoff Wave – Week in Review September 30, 2016
Books and lectures, including mine, that describe the ongoing battle between demand and supply, have a tendency to show relatively simple examples. For example, when defining a Sign of Strength, the base example shows good demand coming into the market and, most often, the top of a trading range or sideways movement is penetrated. After continuing to the upside, demand is withdrawn and a reaction begins. The reaction is usually on reduced price spread and volume, which indicates that supply is drying up. Once the supply has dried up, the rally continues.
While that is a great way to explain an important stock market occurrence, the real world is often, a bit more complicated. While the basic concept that supply needs to be dried up, before an advance can continue, is absolutely correct, it doesn’t have to happen as described above.
The important point is that a stock or index will advance once supply is no longer present in enough force to prevent an advance. If the world is perfect, it happens on one reaction. However, as we know, perfect it isn’t. This means that an index or stock, in this case the Wyckoff Wave, may need to make several attempts to advance and then react before all the supply is finally taken in.
That is why one of the scenarios after a “Jump Across the Creek” is a sideways movement or new trading range. This is simply because there is still unknown overhanging supply that must be dried up, before any advance can continue. This appears to be what is happening to the Wyckoff Wave as it attempts the “Creek Jump” that is shown on the intra-day chart.
Let’s review this past week’s market action. Initially, it appeared the Wyckoff Wave had taken in most of the available supply and was prepared to rally.
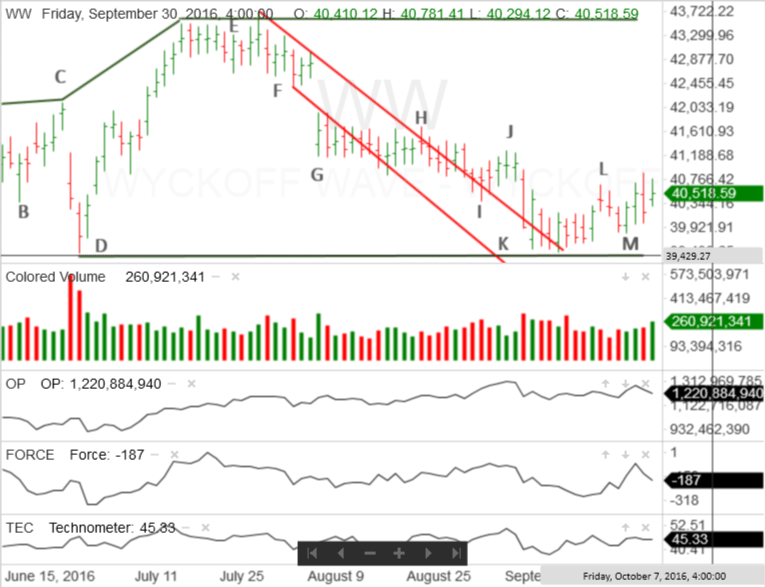
There was some demand present as the Wyckoff Wave rallied to point L, on the three-month vertical line chart. The subsequent reaction to point M was on reduced price spread and volume. While volume was slightly higher on the second day, that was because, on Monday, demand returned to the market.
The Wyckoff Wave responded with two up days (Tuesday and Wednesday) and was continuing the rally on Thursday, when it ran into more supply. This market action is best presented on the intra-day line chart.
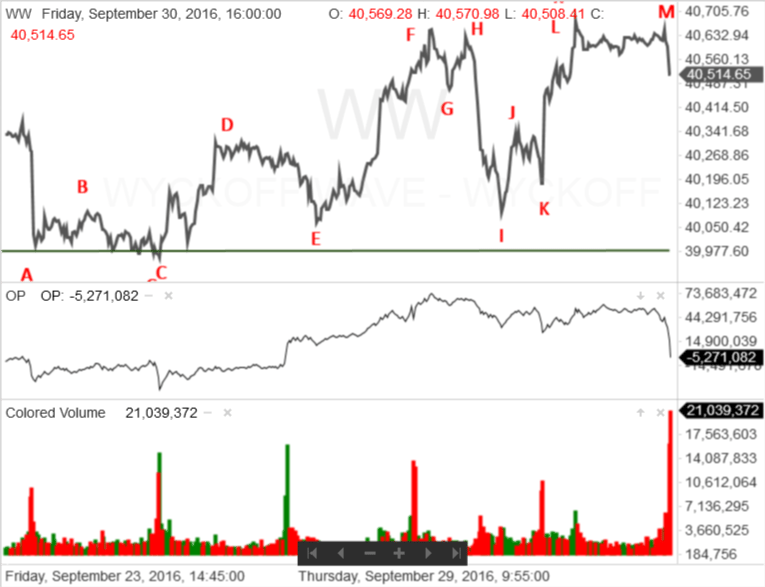
After an intra-day failure to the upside, supply drove the Wyckoff Wave down to its relatively poor close. Tuesday’s market action is shown as point D on the intra-day line chart. Wednesday’s rally moved the Wyckoff Wave to point F.
Thursday’s intra-day failure is the quick rally to point H and the strong reaction to point I.
The Wyckoff Wave made another attempt to rally on Friday, but this was rather short-lived and demand was quickly withdrawn. The rally top is point L on the intra-day line chart.
Then, the Wyckoff Wave moved sideways for the next several hours. Suddenly, during the last 20 minutes of the trading day strong supply came into the market and the Wyckoff Wave reacted.
While end of day volume is always abnormally high, Friday’s volume was even higher.
Notice the intra-day Optimism – Pessimism Index. While the Wyckoff Wave did react, it also moved into an intra-day positive inharmonious action with its O-P Index when compared with points K, I, and E.
While intra-day O-P Index comparisons, especially when using end of day volume, are not overly reliable, it is helpful to note that the effort to the downside, as shown on the O-P Index, did not match the results shown by the Wyckoff Wave.
Regardless, there is still a fair amount of overhanging supply present. This would suggest that the Wyckoff Wave will react back towards the green support line, on the daily vertical line chary, which marks the top of the intra-day trading range.
Let’s return to the three-month vertical line chart. The inability of the Wyckoff Wave to continue its rally off point M and its running into supply at the same area as point L, suggest the continued presence of supply. The Wyckoff Wave needs to take in that supply before it can rally and test the high at point E.
The reaction from points L to M suggests the drying up of supply process has already begun and it is unlikely the Wyckoff Wave will react past the support line drawn in green. However, some additional sideways movement may be required before enough supply can be taken in and allow the expected rally to begin.
This bullish observation also takes into consideration that Thursday’s high was slightly higher than point L and Tuesday’s low was slightly higher than point K.
The Wyckoff Wave is expected to react next week. That reaction could be anywhere from a half a day to three or four days. It will be important to watch the quality of the reaction. Reduced price spread and volume are the watch words for the bulls.
Responses