A Possible Last Point of Support
Thursday, October 27, 2016
What To Do?
Short Term:
Short-term bulls should continue to maintain their positions.
There are no short-term positions to the downside.
Intermediate & Long Term:
Intermediate and long term positions to the upside should be maintained.
There are no intermediate or long term opportunities to the downside
Market Trends:
Intra-day: Up
Short Term: Neutral.
Intermediate Term: Neutral
Long Term: Neutral
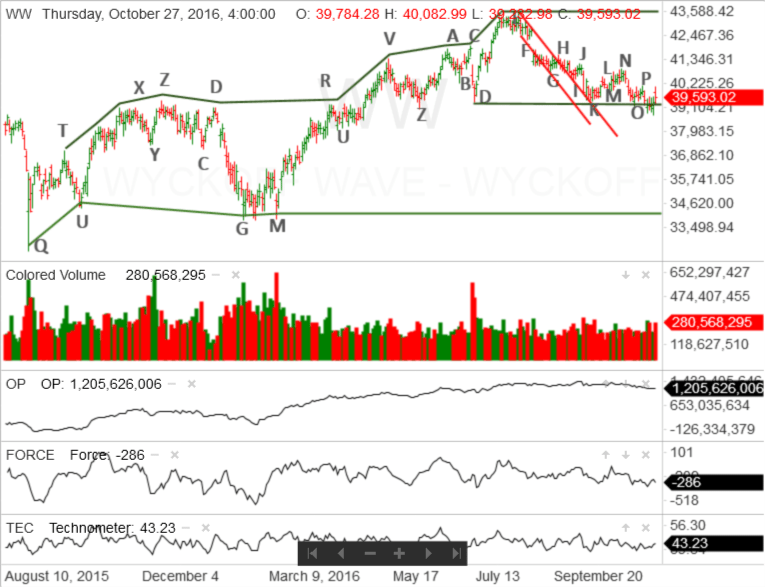
The stock market, as measured by the Wyckoff Wave, traded higher on increased volume. It closed in the middle of a slightly narrower price spread, in a low neutral condition relative to the Technometer. The price spread and volume suggest the presence of supply.

A review of the intra-day waves indicates that today was a demand day. After a nice gap opening to the upside, demand remained and the Wyckoff wave rallied to point D.
After a brief, 15 minute. reaction, demand returned and the Wyckoff Wave continued its rally to point F. There, demand was withdrawn and the Wyckoff Wave put in a long, slow, three hour and 55 minute reaction until the end of trading. The reaction took the Wyckoff Wave to the halfway point of the portion of the rally that began at point E, or the top of the intra-day trading range.
The intra-day O-P Index is in a positive inharmonious action, with the Wyckoff Wave, when compared with point E.
The rally from point C to point F appears to be an intra-day Sign of Strength. The Wyckoff Wave jumped the Creek (marked in green) on the rally to point D. The rally from point C was on good price spread and volume.
Price spread and volume decreased during the afternoon as the Wyckoff Wave reacted. So far, the reaction has the characteristics of a backup to the creek. At the market’s close, Wyckoff Wave was at the halfway point of the move from point E (top of the intra-day trading range) to point F. This is the area where one could expect a Last Point of Support..
While volume increased during the last hour of the trading day, the price spread narrowed. This suggests some demand is already coming back into the market.
There is a good probability the Wyckoff Wave will put in a successful Last Point of Support and continue to rally.
The Optimism – Pessimism Index reacted. It has returned to a short-term positive divergence with the Wyckoff Wave, when compared with point K.
The Force Index also reacted and continues to produce moderate negative readings.
Tomorrow, the Technometer will open in a neutral condition.

Today the Wyckoff Wave continued its rally off the support line drawn from point D. Because the Spring scenario has been eliminated, the support line has been adjusted to reflect the support areas in this phase of the long trading range.
The Wyckoff Wave is in the process of testing the high at point P. It is expected to move past point T and test the next time at point N.
Like yesterday, today’s intra-day observations best describe the actions of the Wyckoff Wave. It certainly appears the Wyckoff Wave is in a position where it will rally back towards the top of the trading range and test the highs at point E.
Responses