Stocks To “BUY” Watch List
As Wyckoff Principles teach, you want to time your trades with a turn in the Wyckoff Wave. We have been mostly bearish for the last few months, but we want to be prepared if we get a buy signal on the Wyckoff Wave.
When looking at stocks to purchase, you want to buy those stocks that are stronger than the Wave, as those will be the ones that should lead it higher. You also want to buy those that have built a large count. We have a few stocks below that we think fit this criteria.
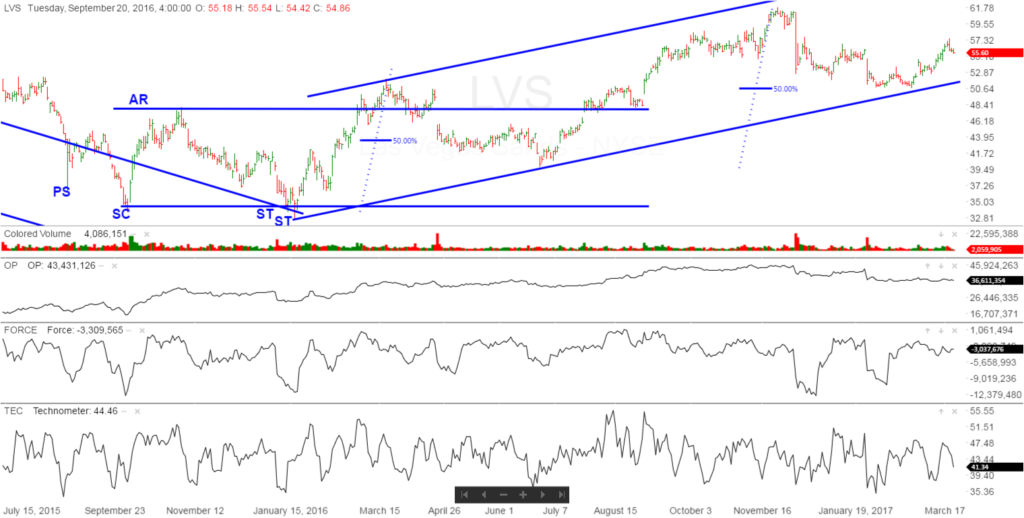
First one is Las Vegas Sands (LVS, $55.59). As you can see from the following chart, the stock has been in an uptrend, after spending considerable time building a large upside count. The O-P Index has most recently been in a downtrend for the last 8-10 weeks, but price has worked higher. The Force Index tried to bring in selling the last three months also, and has had very little success. The recent low at $51 experienced an oversold Technometer and looks like a good low to trade off of.
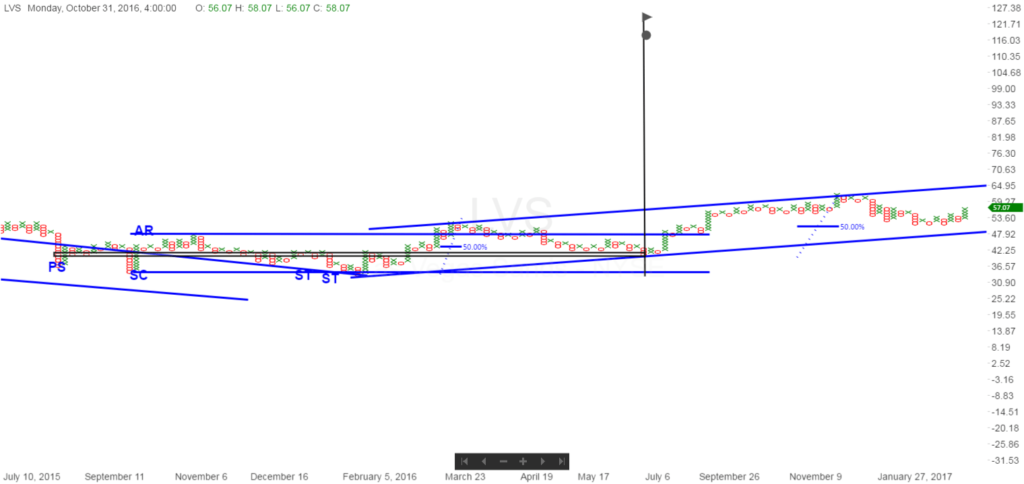
The maximum upside count from Las Vegas Sands point & figure is large and to much higher prices. First count objective would be approximately $80, then as high as $123. We do not want to get to far ahead of ourselves, but there is for sure upside counts for us to trade off of.
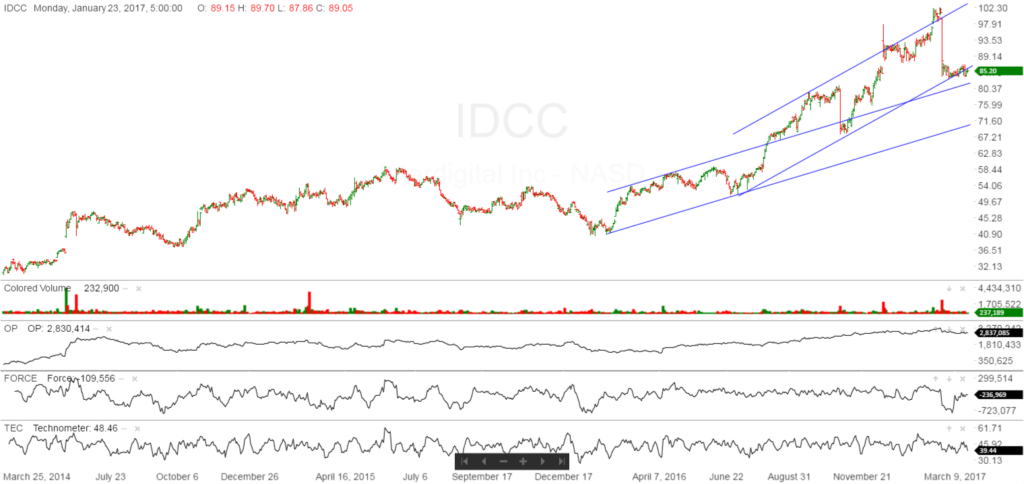
The next stock is Interdigital Communication (IDCC, $85.20). This stock has been in a long-term uptrend, and could be in an interesting position on a short-term basis. We would like to buy this stock once we get a buy signal on the Wyckoff Wave, so as to hopefully keep our risk to a minimum.
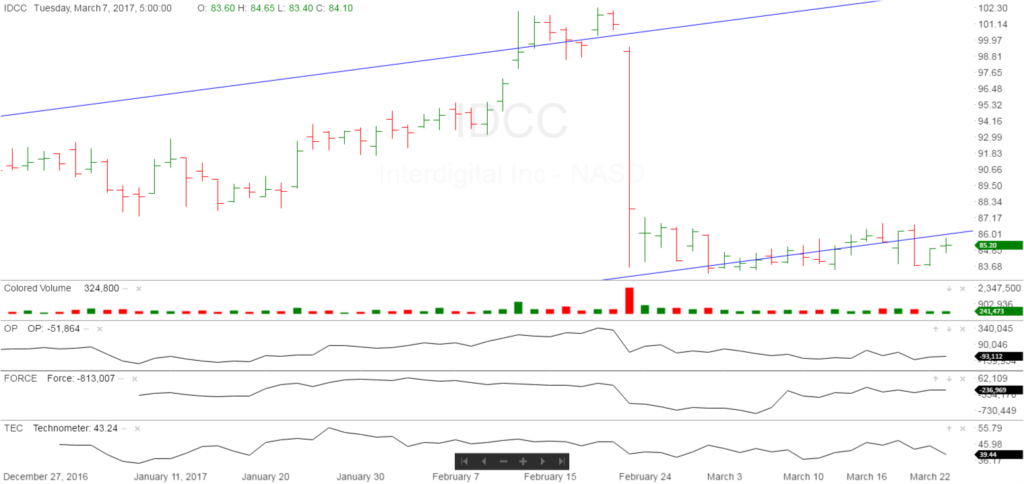
As you can see on the three month chart, the stock had a massive down day on huge volume, but since then has worked sideways in a narrow range. Recently while the general market has shown some weakness, the stock has managed to hold steady. We are anxious to see how this stock acts in the next few days/weeks if the Wyckoff Wave works a little lower.
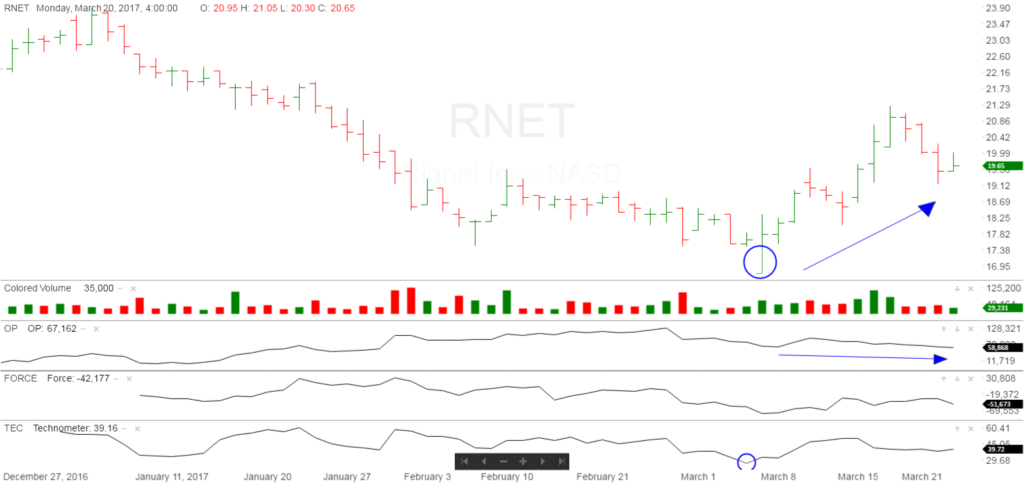
Next stock is Rignet Inc. (RNET, $19.65). Just recently on the three month chart it had a nice bar which we circled in blue. Opened lower while the Technometer was oversold, then reversed higher and closed plus on the day. We think this day is very important to the long side. Since then it had a nice rally for the last three weeks, and most recently the O-P Index hit a new low, as shown by the blue arrow, and the price was much higher than the previous low. We like this action….
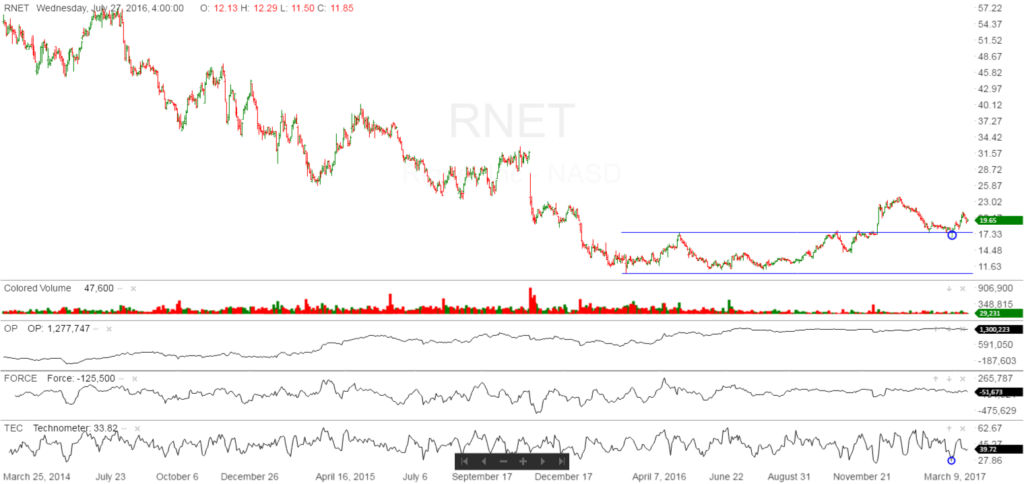
The stock had experienced a sharp selloff the last three years, and then had ending action consisting of Preliminary Support/Selling Climax/Automatic Rally/Secondary Test. Its interesting if you then take that blue circle point off of the three month chart we spoke of above, and then expand out to the three year chart, that point now looks like a successful backup to the creek. We like this…
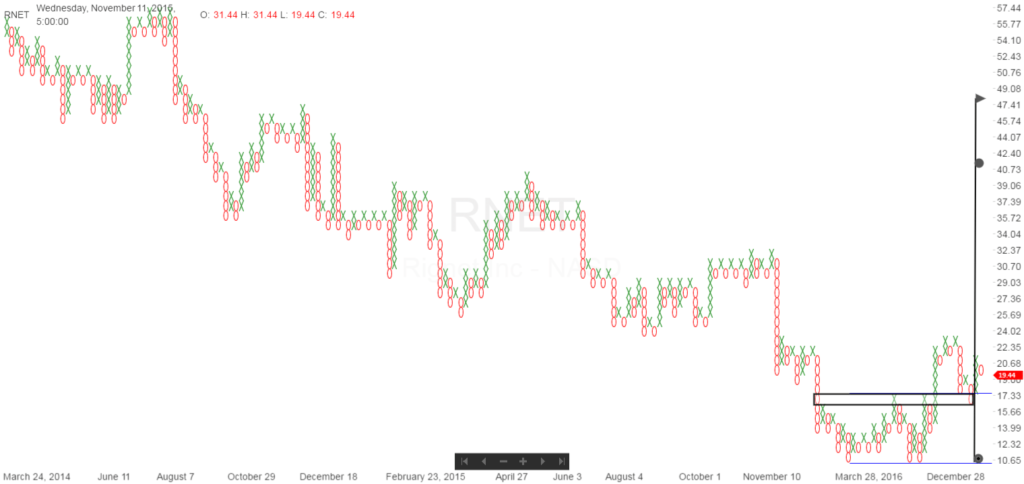
The point and figure chart gives you much higher upside objectives… The stock is trading near $20 and upside objectives are as high as $48.
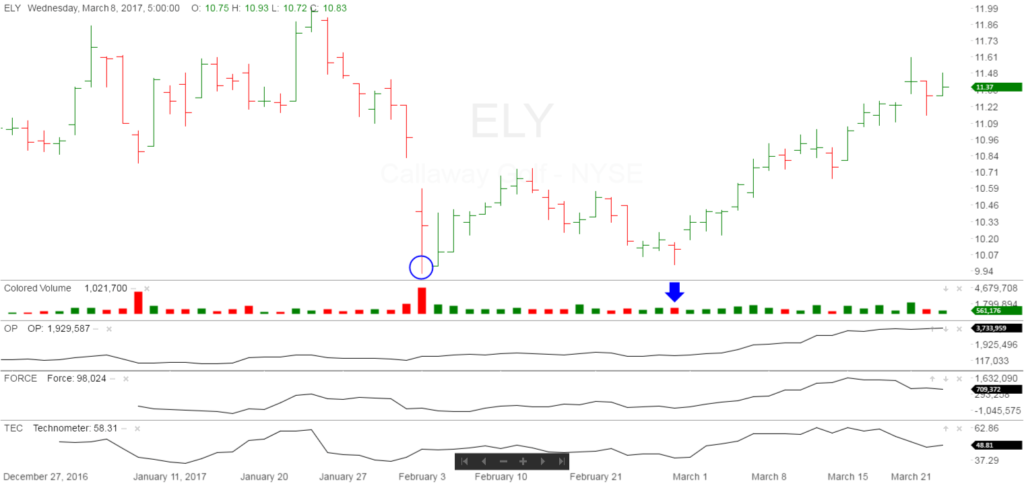
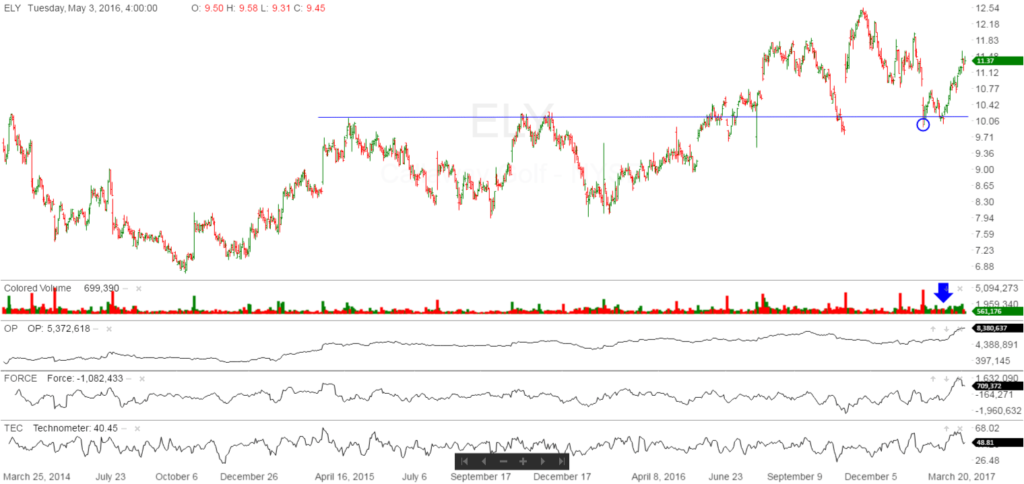
Next stock is Calloway (ELY, $11.37) This stock also had an interesting day six weeks ago which we have circled in blue. Selloff on large volume, then a low volume test a month later which we show by the blue arrow. Then a consistent rally off of this area, while the general market has come under some weakness. We like that action….
If you expand out to the three year chart, the area we circled in blue above, once again looks like a backup to a creek. Much higher prices possible here.
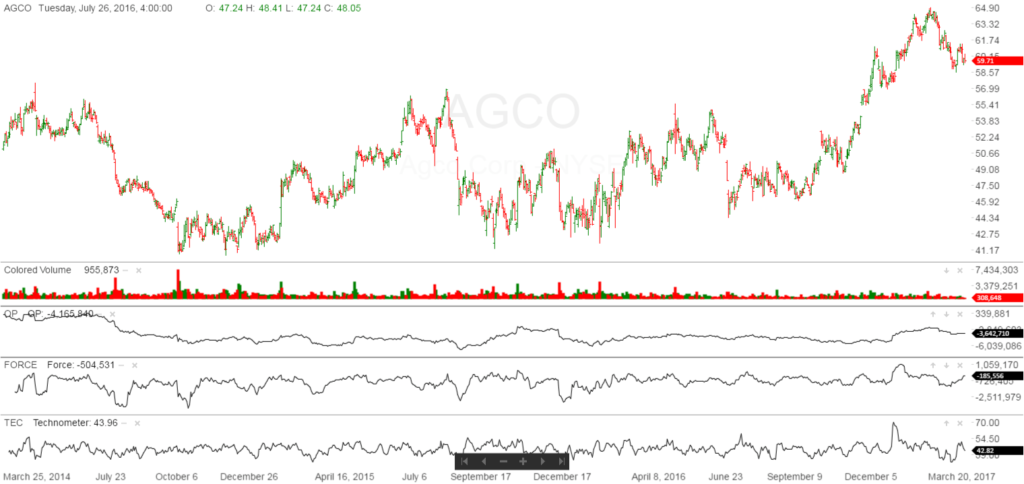
The last stock we want to discuss is AGCO Corp, (AGCO, $59.71) We think this stock could be a long term play, as grain prices have been under pressure, as well as farming income for like the last 3-4 years. All of this should have kept this stock under pressure, but it appears to be under accumulation. One to keep on your radar screen…..
Good Trading,
Todd Butterfield


Responses