Supply and the Force Index
Technical Analysis of Stock Trends, The Wyckoff Wave – Week in Review November 4, 2016
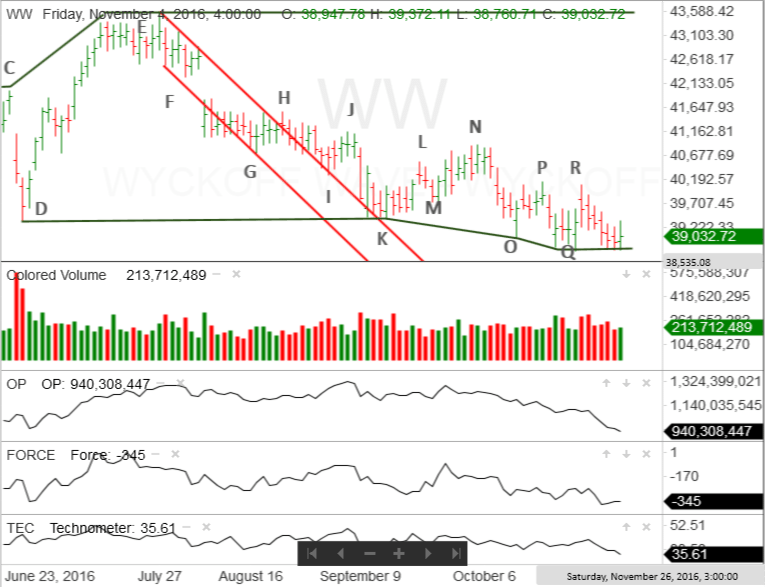
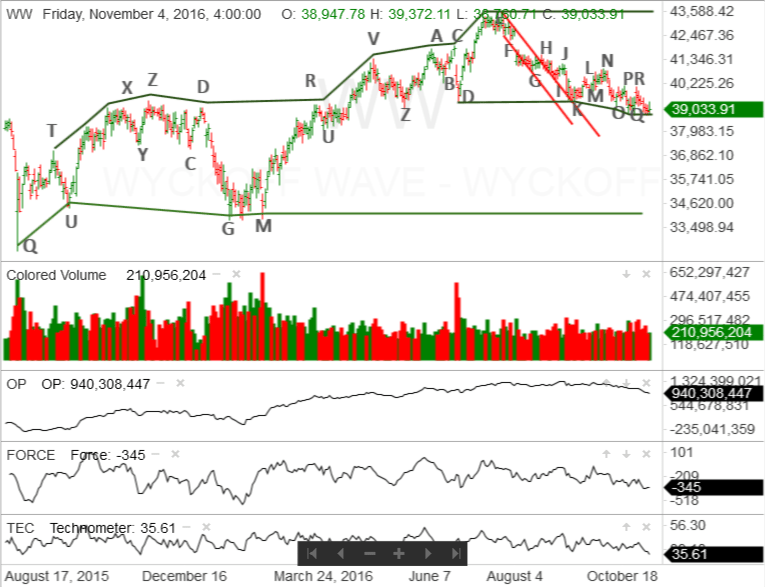
This past week the stock market, as measured by the Wyckoff Wave, tested the support line of the latest phase of the trading range, that began in August 2015. The phase began with climactic action at point D.
Since then, support has been found at points K, O and Q. This support is identified by the green line drawn from point D. Resistance was established, back in July, when the Wyckoff Wave put in a high at point E. That resistance line is also drawn in green on the vertical line chart.
At point Q, the Wyckoff Wave attempted to Spring the support as it reacted below point O. However, while some demand came into the market, it was not particularly strong, or sustained. This caused the Wyckoff Wave to react back to the support line and continue moving sideways.
After reacting to point K, the Wyckoff Wave has moved sideways, in a relatively narrow range, for the past 2 1/2 months. The question is when will it be able to rally and test the highs at point E?
An important part of the answer will probably be found in the Force Index. The Force Index measures the amount of pressure being exerted in a given direction. If the market is trying to move one way, but the pressure being applied is in the opposite direction, it will be difficult for the market, or an individual stock, to continue that move.
If the pressure on the market, or an individual stock, is in step with the direction of the price movement, the likelihood that the move will continue his increased.
As the Force Index often produces negative readings, I look at it as a measure of the amount of supply that is presently in the market, an index or individual stock.
While, by itself, the Force Index can identify this pressure, it is most useful when used in conjunction with the Technometer. If the Force Index is producing positive or slightly negative readings and the Technometer is oversold, there is a high probability the expected rally will be successful.
However, if the Technometer is oversold and the Force Index continues to produce higher negative readings, it now has a mitigating impact on the expected rally signal given by the oversold Technometer. This would suggest that any rally will have a difficult time gaining momentum.
The day before point O, the Wyckoff Wave’s Technometer moved into a slightly oversold condition. The Technometer reading was 40.20. The Force Index reading was -306. Even though the Wyckoff Wave attempted to Spring the support at point K, unless strong demand came into the market, the Spring had a low probability of success.
That’s what happened. Demand came into the market on the Spring, but was withdrawn at point P and the Wyckoff Wave reacted to point Q.
Once again, the Technometer was slightly oversold at point Q. The reading was 40.85. The Force Index reading was -259. While the Technometer indicated a rally was in the offing, the Force Index suggested it would not be particularly strong or sustained.
Again, that’s what happened as the Wyckoff Wave rallied quickly to point R. There, it was unable to make any additional progress to the upside. The Wave reacted and, this past Wednesday, was testing the support line at the bottom of this latest phase of the trading range.
As of Friday’s close, the Wyckoff Wave’s Technometer was in a clearly oversold condition, at 36.61. This suggested the Wyckoff Wave was ready to rally.
However, the Force Index reading was -345. This meant there was a mitigating impact on the clearly oversold Technometer and, unless the Force Index readings improved, it would be difficult for the Wyckoff Wave to put in a sustained rally.
While, on Friday, the Wyckoff Wave did put in a small move to the upside, it probably will be unable to make much additional progress until the Force Index readings become noticeably less negative.
The good news for the bulls is that it is extremely difficult for an index or stock to react in the face of a clearly oversold Technometer. Therefore, while the Wyckoff Wave may not immediately rally strongly, back towards the top of the trading range, there is a low probability it will react strongly through the support line.
As the Wyckoff Wave rallies and reacts back to test this important support area, it will be important to watch both the Technometer and the Force Index. Once they are in sync, we can expect the Wyckoff Wave to rally back towards the top of the trading range.
Responses