The Wyckoff Wave Continues The Correction
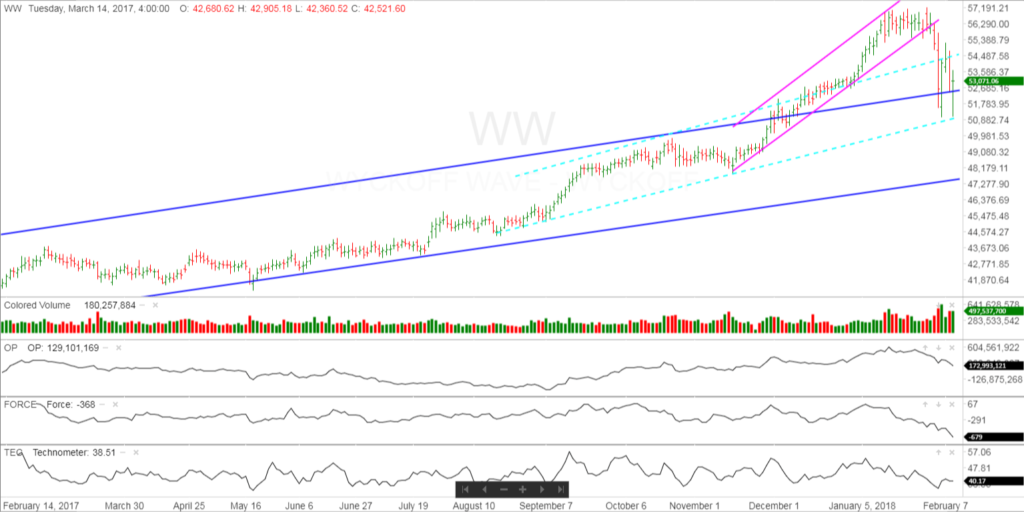
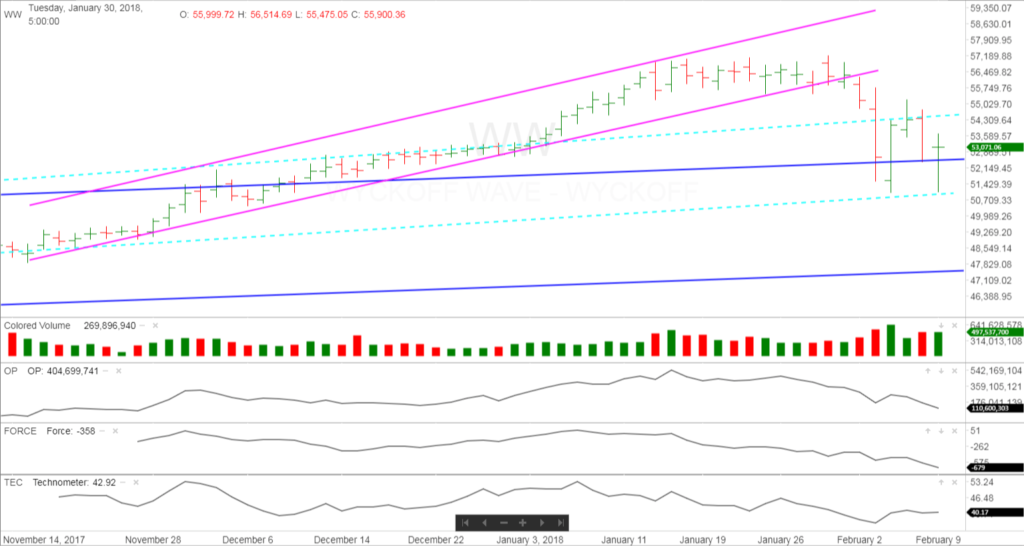
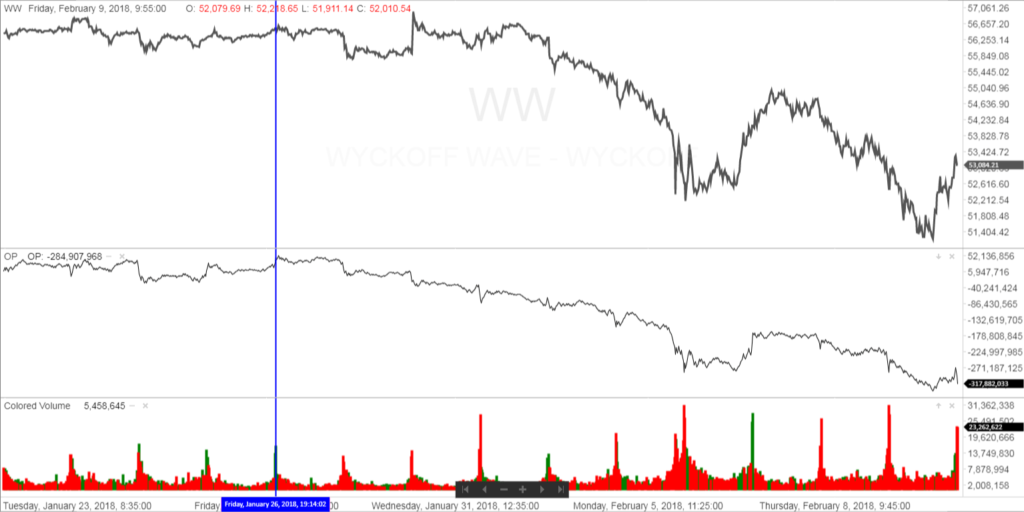
This past week the Wyckoff Wave continued probing lower levels of this volatile correction. Volume has increased as well on the selloff.
The Technometer reached oversold levels on Mondays sharp selloff but relieved the condition somewhat as the week progressed.
For the week the S&P was down 5.18%, and the Nasdaq 5.06%.
The Wave spent the week continuing to correct the early gains of 2018, and taking the major market averages negative for the year.
The O-P has returned to trading in correlation to the Wyckoff Wave and spent the week correcting as well.
The Force Index continues to show relative weakness to the Wave and continues to apply pressure to the downside.
The Technometer began the week trading near oversold, and finished the week slightly off oversold levels.
The one year daily chart shows the Wyckoff Wave breaking the support line of the accelerated uptrend in pink, and swiftly falling to the support line of the light blue uptrend. At this level, it did find some support and stopped the down move for now. The Wave did work out the distribution count at the 56,700 level, and could have a larger downside count building. We now have a downtrend in place and we would expect still lower prices in the foreseeable future.
We had been looking for a correction as many sentiment readings were at 30+ year extremes. This widespread bullishness is what lead to this swift decline.
As everyone knows, the VIX exploded last week and caught many traders off guard which had been selling volatility successfully for years.
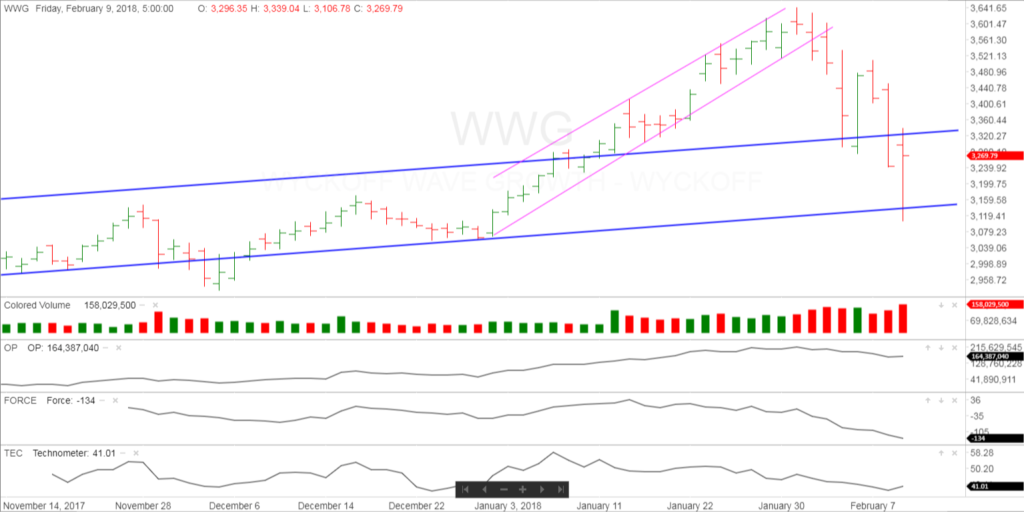
The Wyckoff Wave Growth Index (WWG) continued to trade sharply lower as we expected. Volume continued heavy on the selloff.
The Technometer is trading near oversold levels which lead to Friday’s late bounce. Once this condition is relieved somewhat, we would expect lower prices here as well.
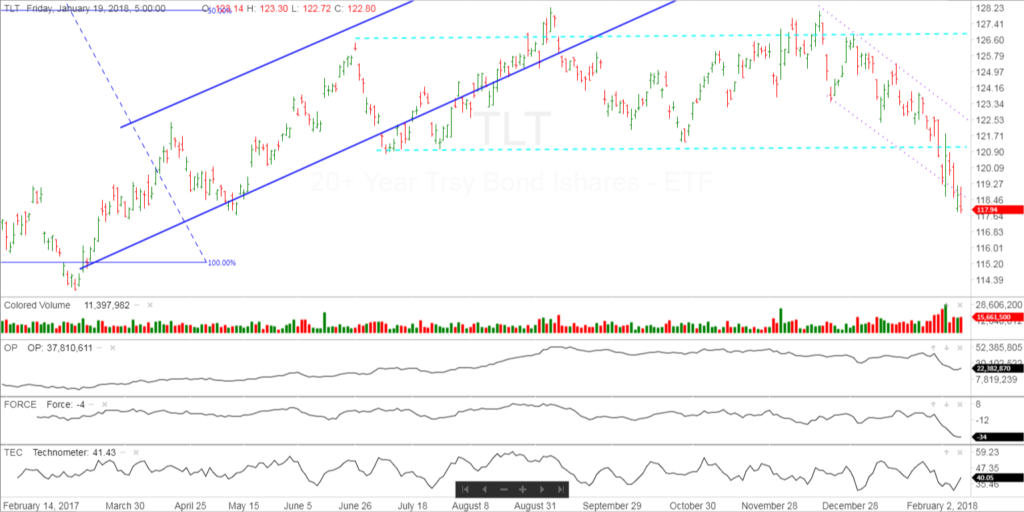
The bond market continued lower for the week as we expected. The OP and Force continue to hit new lows with the TLT index, and continue to provide downside pressure. The Technometer was extreme oversold Thursday, but thus far has not lead to any short covering.
TLT continues hugging its oversold line of its downtrend shown in purple. We have lower objectives from the point and figure chart so we are staying short this market, but would allow for a short term bounce. Stay short….
IMPORTANT ANNOUNCEMENT: This week we will be launching our “Pulse of The Market” for Cryptocurrrencies. This software will have consolidated volume for the Crypto’s which will be most important when applying Technical Analysis.
Due to the demand for Bitcoin/Cryptocurrency information and trading knowledge, we released a Cryptocurrency and Wyckoff Trading Course at our site, LearnCrypto.io This course is now being offered at an affordable $299.99. We have had 875 students enroll in the last 30 weeks.
If you are interested in Cryptocurrency news and Wyckoff chart analysis, search “Crypto News” or click this link https://www.youtube.com/channel/UCDxK2PwEDvoaHZgjPV_WgcA
Please subscribe and click the bell to be notified of our upcoming broadcasts.
Our current schedule is Monday-Friday approximately 11:30 a.m. CST, as well as Monday-Thursday 6:30 p.m. CST and they usually last approximately one hour. We will also broadcast at additional random times since we want to satisfy our international subscribers as well.
If you would also like to follow us on twitter for news and trade ideas, follow “WyckoffonCrypto”. We have given numerous profitable trades to our subscribers on the Youtube channel, as well as Twitter.
Good Trading,
Todd Butterfield


Responses