The Wyckoff Wave Correction Continues As Expected
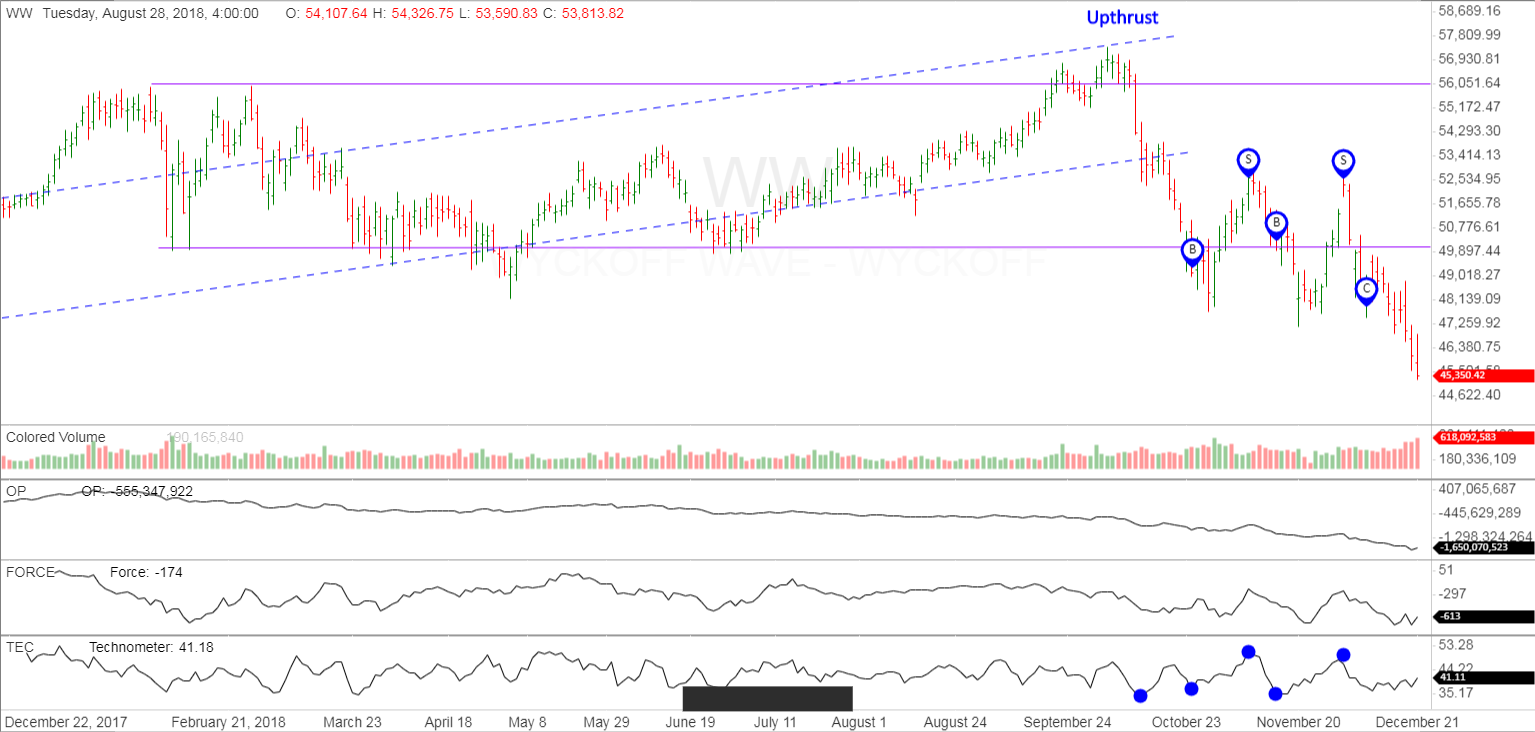
The Wyckoff Wave continued its correction this week. Volume increased to the downside as the week progressed.
The O-P continued hitting fresh new lows for the correction.
The Force Index was slightly lower for the week.
The Technometer trading near oversold levels.
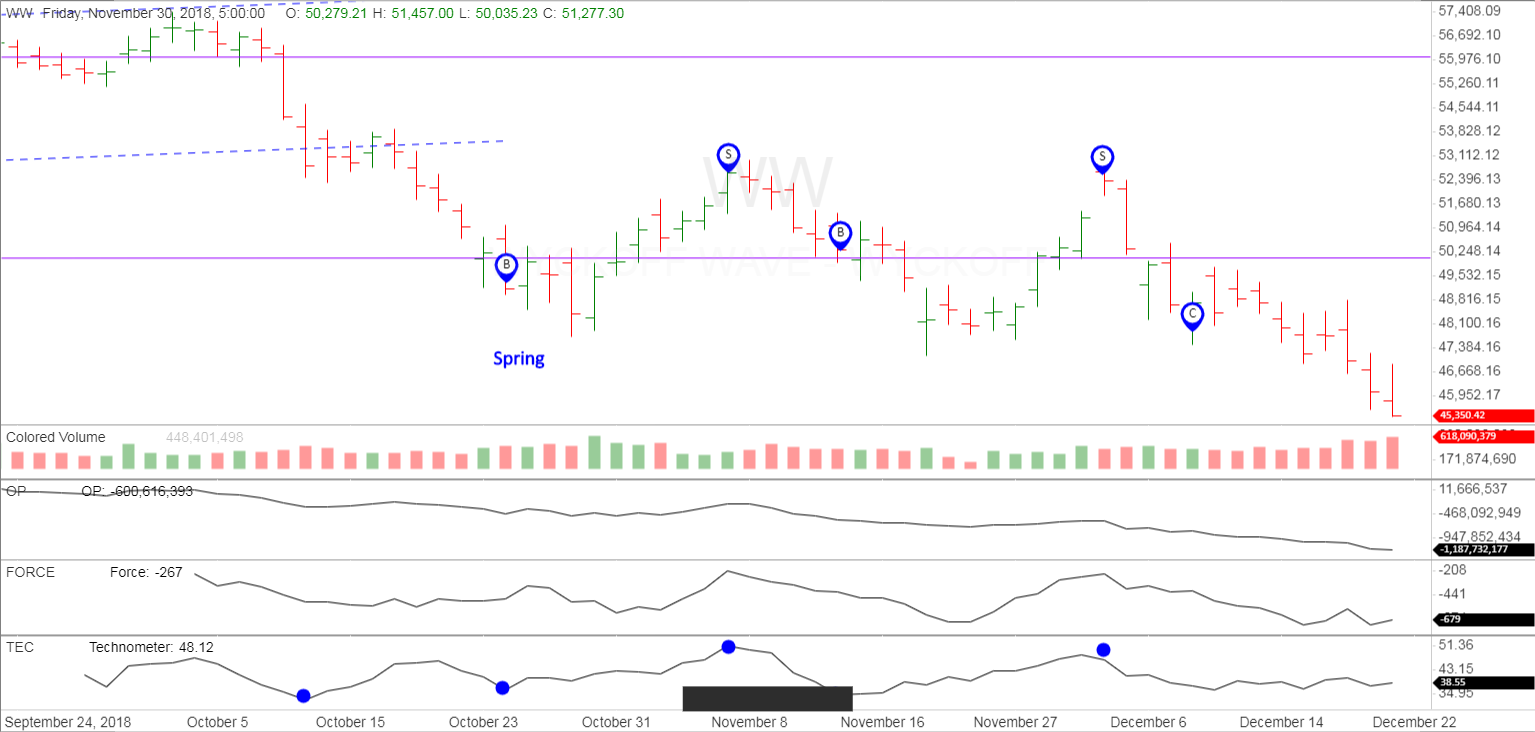
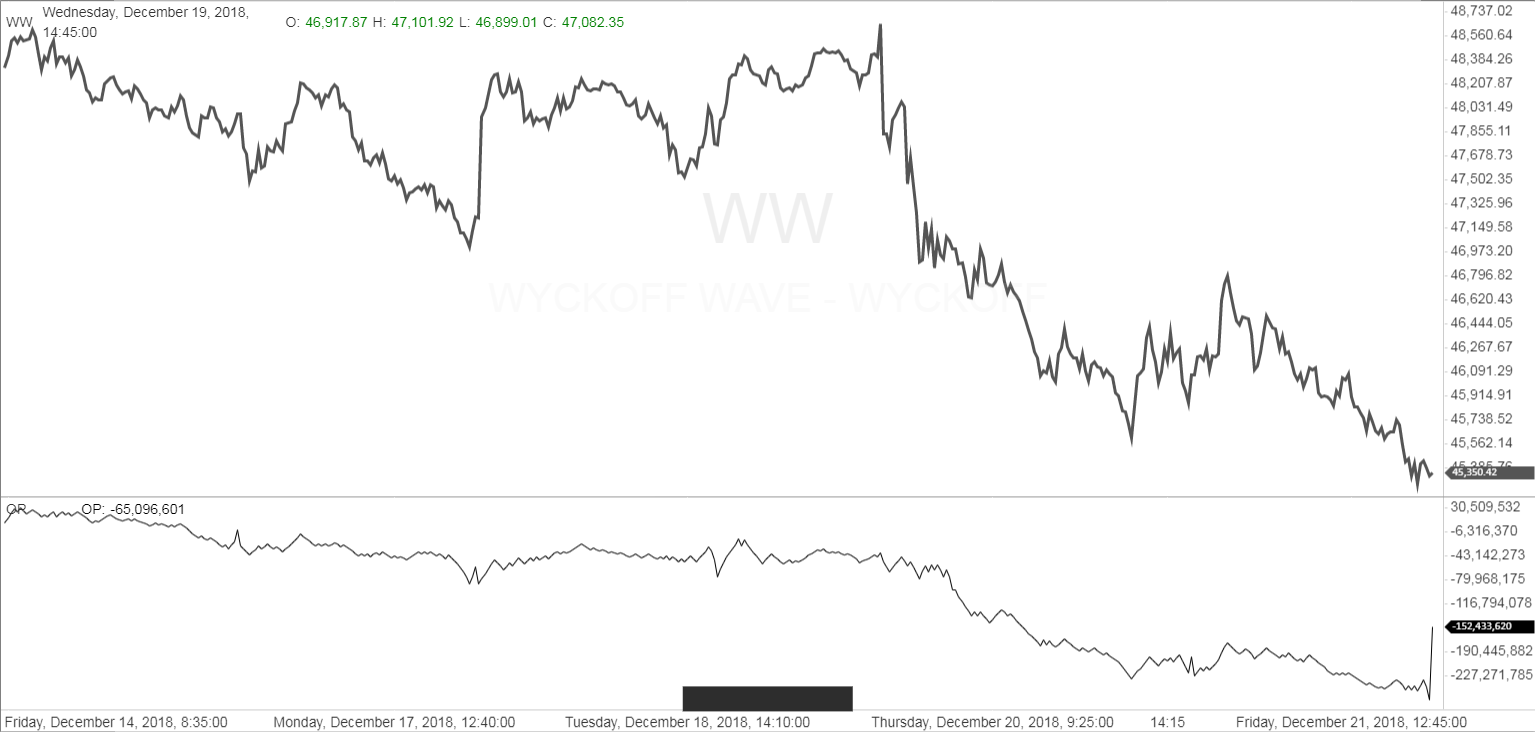
The OP has continued with its out performance to the downside. It closed on its lows for the week except for the last 5 minutes of Friday’s session.
We was hoping for a bounce early in the week to sell short, but Mondays opening was to the downside and put that idea to rest.
We then continued to expect stocks to deteriorate below the previous lows and break the 47,000 support level. Any subscriber to our software has been getting quick video updates that we do for our Pulse of the Market report. We had warned all week to look for lower prices, and we closed on the low for the week. We also discussed this on our nightly Youtube channel, Monday thru Thursday.
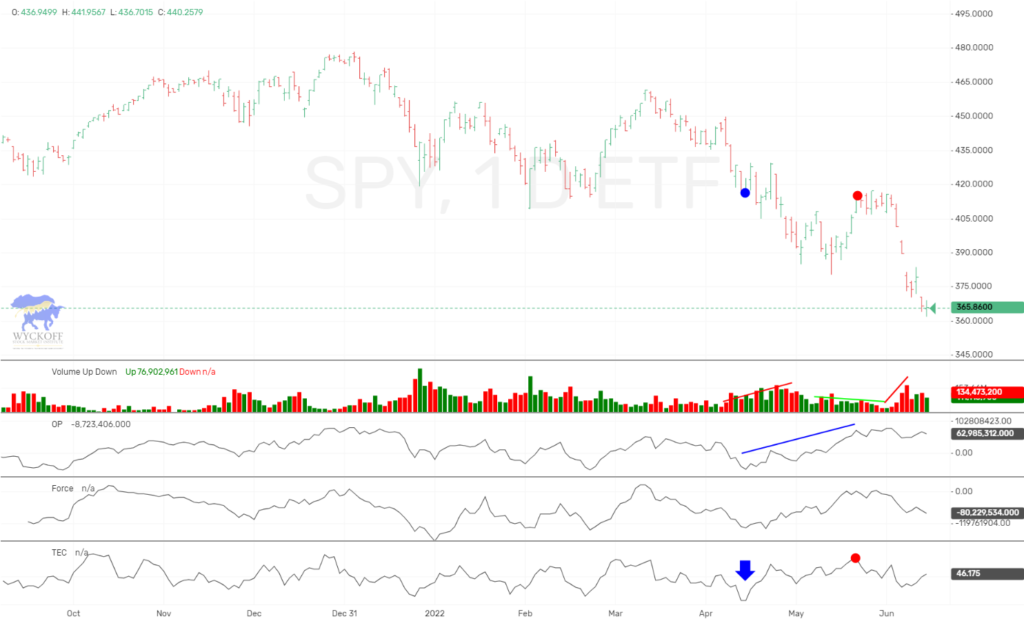
We now feel that we could make a short term low here, but the reasoning is not solid. We had shown a downside point and figure count objective on the SPY, which we are entering that area quickly. So for short term traders, I think early in the week you could be looking for those individual stocks that are showing relative strength, for possible purchase.
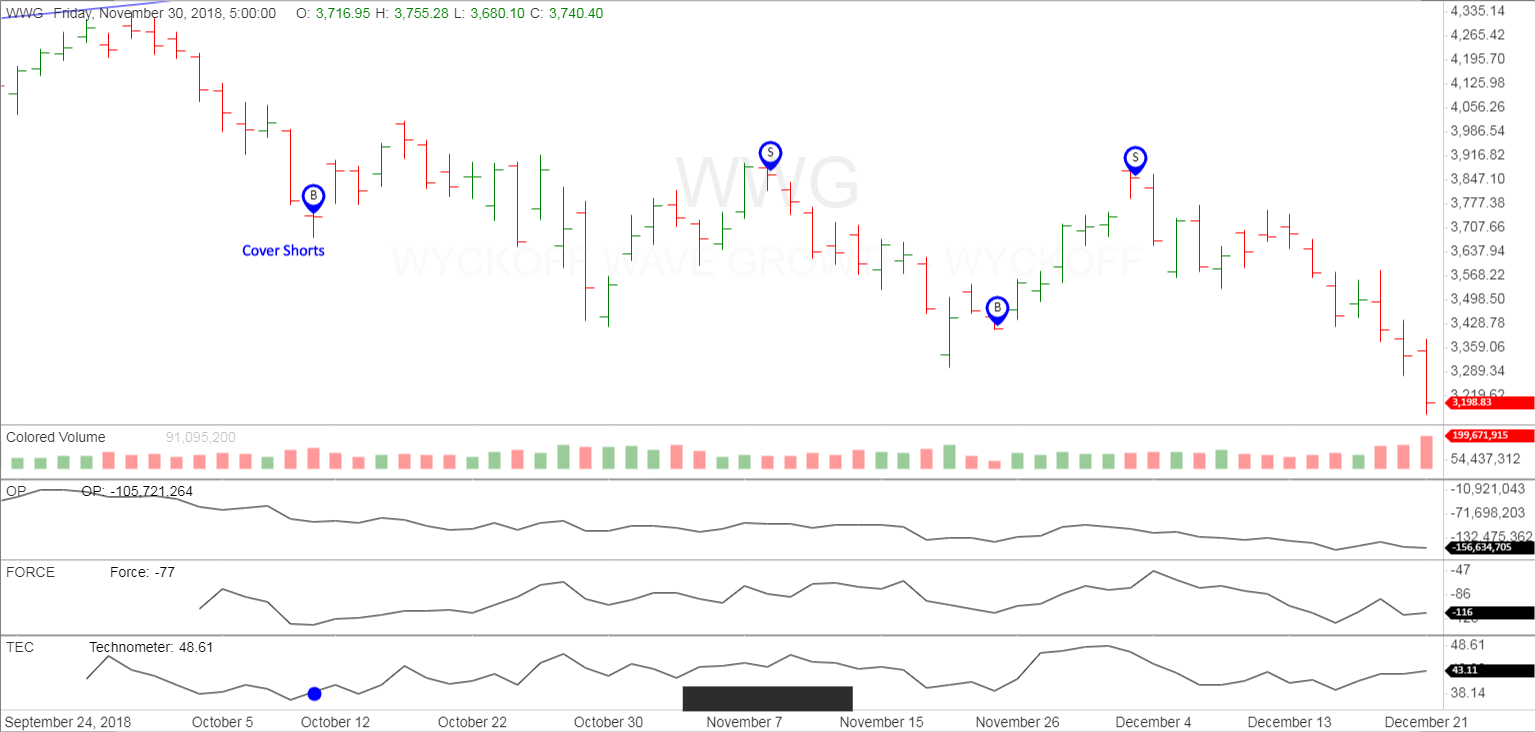
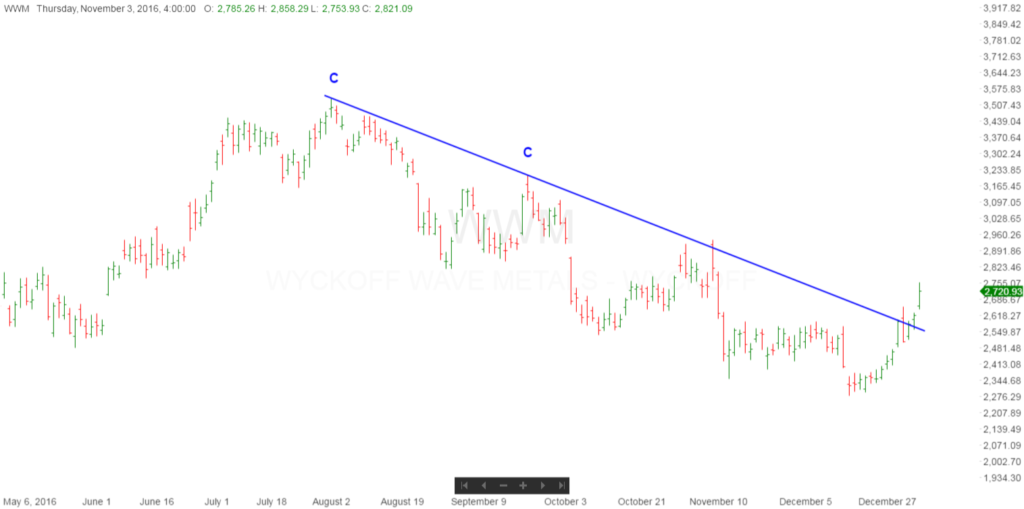
The Wyckoff Wave Growth Index (WWG), gathered momentum to the downside all week, and closed the week near the lows as well.
Here to we had hoped for a bounce, before continuing lower, but no such luck.
The bond market traded higher for the week.
You can see that price has respected/upthrusted a previous high at $121, and the Technometer is near overbought. Since we are looking for stocks to catch a possible short term low, we think the TLT could make a short term high and react back into the recent trading range marked with the blue dashes.

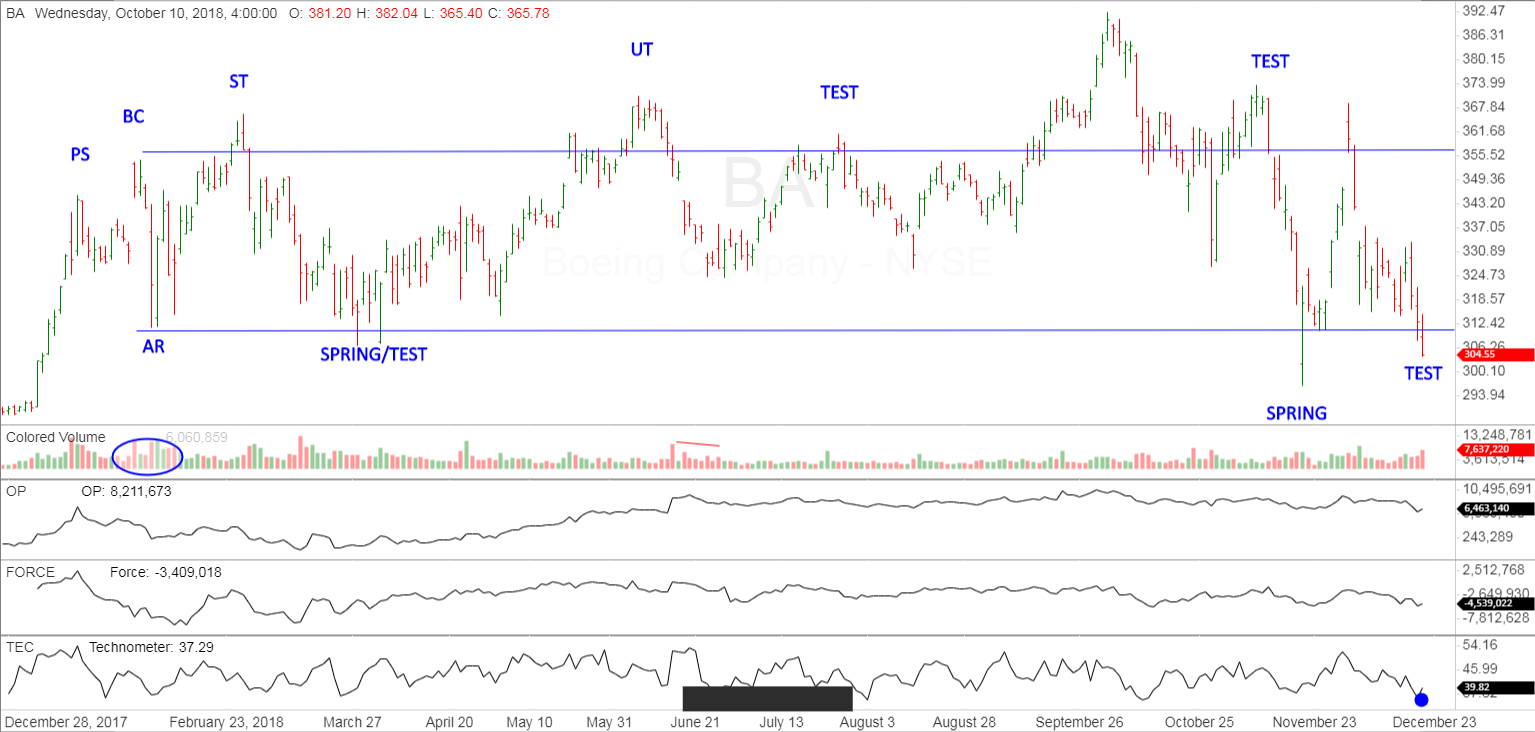
The following chart of Boeing (BA), is showing some outperformance to the upside. Stocks with relative bullish performance should be watched closely for purchase. You can see that BA is testing a previous spring, which is a much better looking position than the Wyckoff Wave.
IMPORTANT ANNOUNCEMENT: Our “Pulse of The Market” charting software for Cryptocurrrencies is now working. This software has consolidated volume for the Crypto’s which is utmost important when applying Wyckoff Technical Analysis. We are showing this software in use on our social media sites.
Due to the demand for Bitcoin/Cryptocurrency information and trading knowledge, we released a Cryptocurrency and Wyckoff Trading Course at our site, LearnCrypto.io This course is being offered at an affordable $299.99. We have had 947 students enroll since its launch on June 22, 2017. On June 28th we added lessons detailing the OP, Force, and Technometer and how to use these Wyckoff Tools for analysis.
If you are interested in Wyckoff stock chart analysis as well as Crptocurrency, search “Learn Crypto / Wyckoff SMI” or click this link https://www.youtube.com/channel/UCDxK2PwEDvoaHZgjPV_WgcA
Please subscribe and click the bell to be notified of our upcoming broadcasts.
Our current schedule is Monday-Thursday approximately 6:30 p.m. CST, and they usually last approximately one hour. We will also broadcast at additional random times since we want to satisfy our international subscribers as well.
If you would also like to follow us on twitter for news and trade ideas, follow “LearnCryptoShow”, or “WyckoffonCrypto”. We have given numerous profitable trades to our subscribers on the Youtube channel, as well as Twitter.
Good Trading,
Todd Butterfield

Responses