The Wyckoff Wave Extended Its Gains
The Wyckoff Wave continued its rally of the last 3 weeks. Volume was not impressive on the rally.
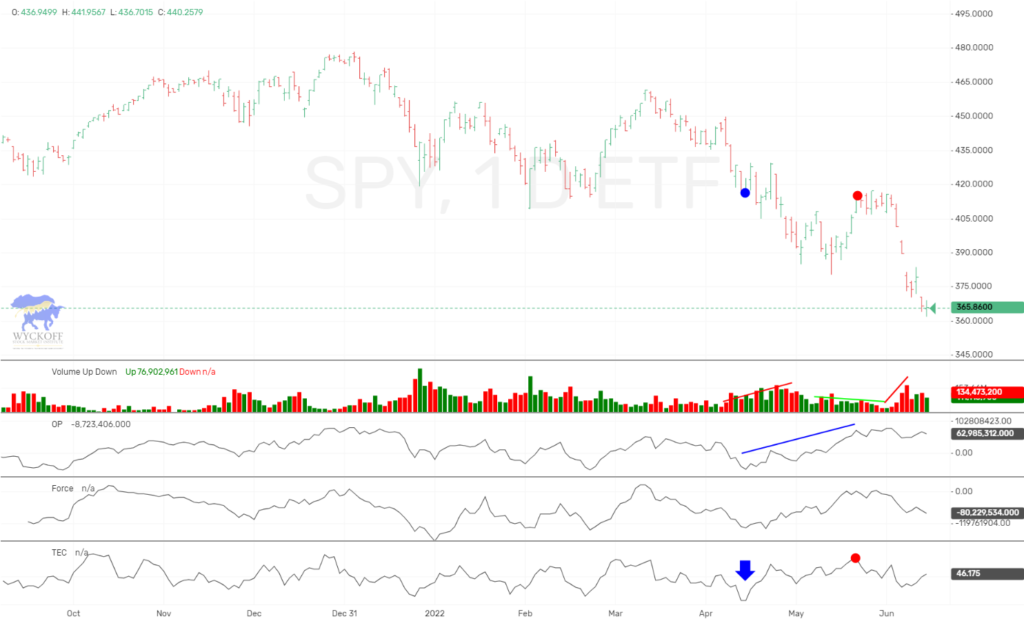
The O-P was up slightly for the week.
The Force Index rallied for the week as well.
The Technometer is not yet overbought.
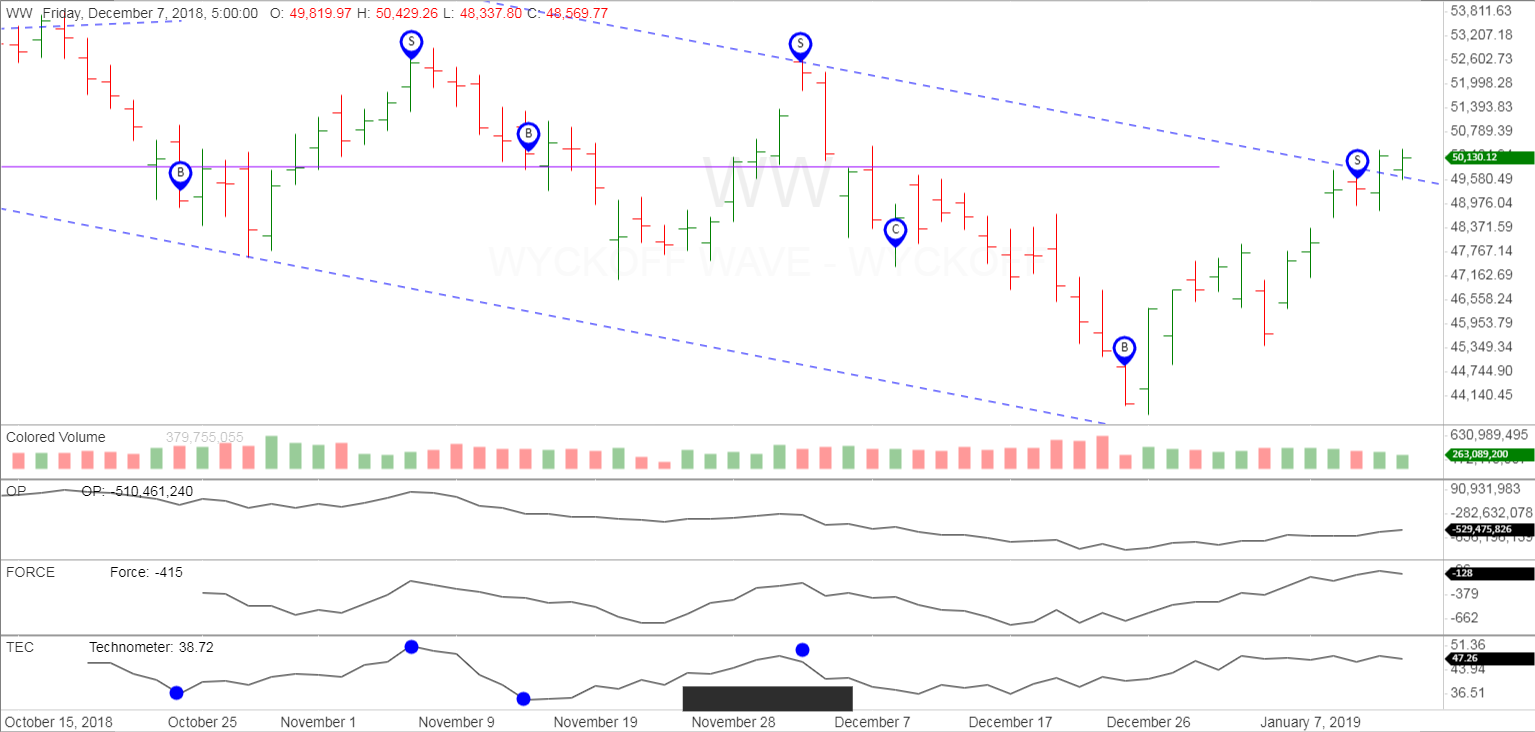
The OP and Wyckoff Wave is showing no major divergences or inharmonious action.
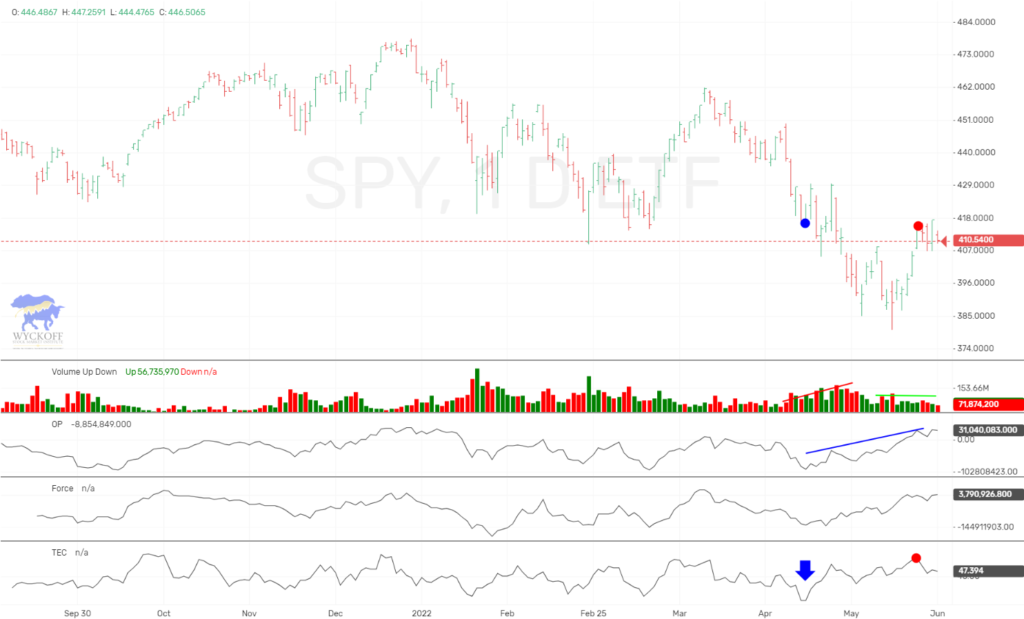
We was expecting further strength this past week, and that possibly leading to the Technometer registering an overbought condition. We did get further gains, and the Technometer almost reached overbought, but not quite there.
We had spoke of resistance near the 50,000 level which is also a downtrend supply line. We have slowed up in this area, and lets see if that does provide us some resistance.
We would expect some type of correction here, and a probable buy entry again. We feel the recent lows at 44,000 could be a good low. Anxious to see how a correction from here looks like.
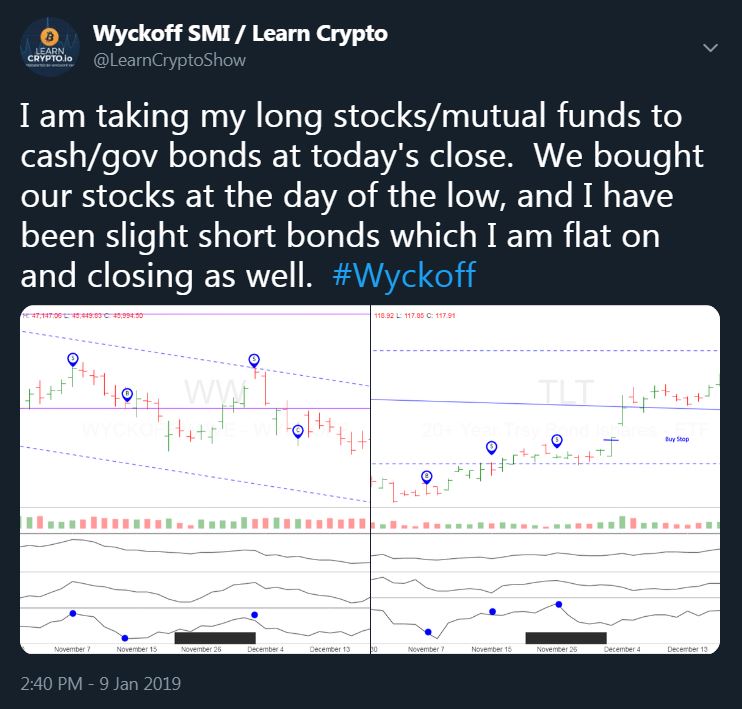
We had tweeted the following on the 9th….
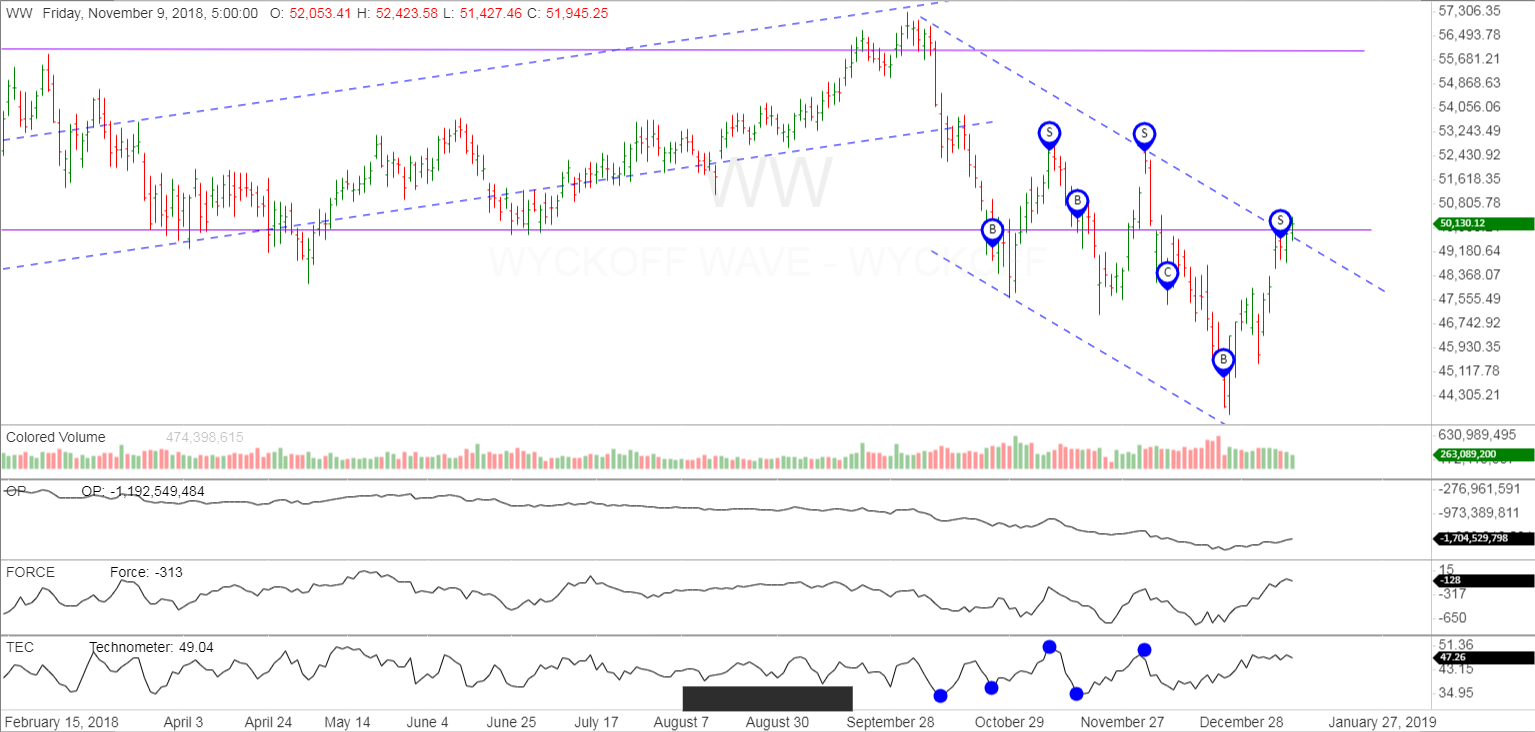
The Wyckoff Wave on year chart shows we are trading against the supply line of the recent downtrend, as well as testing what was previous support and possibly now resistance.
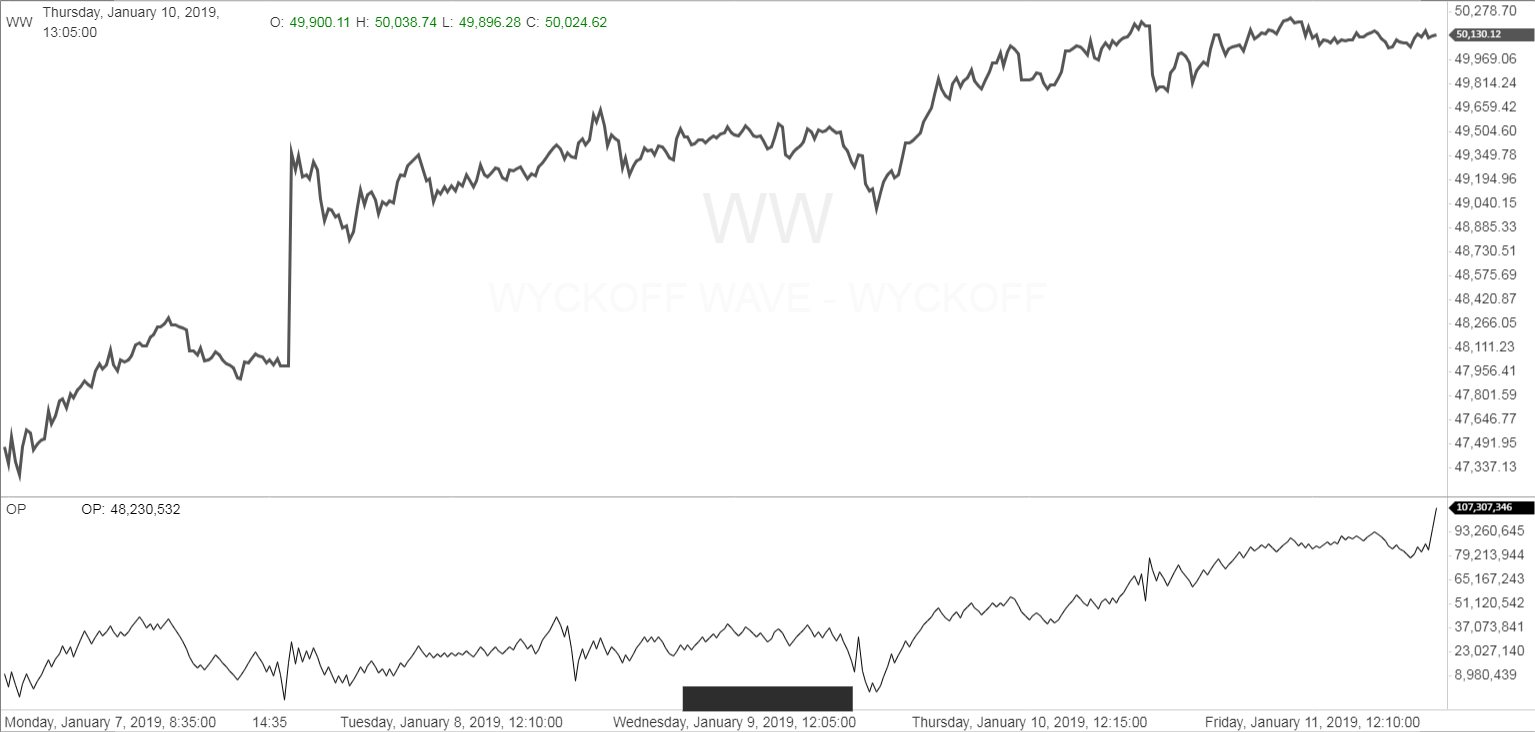
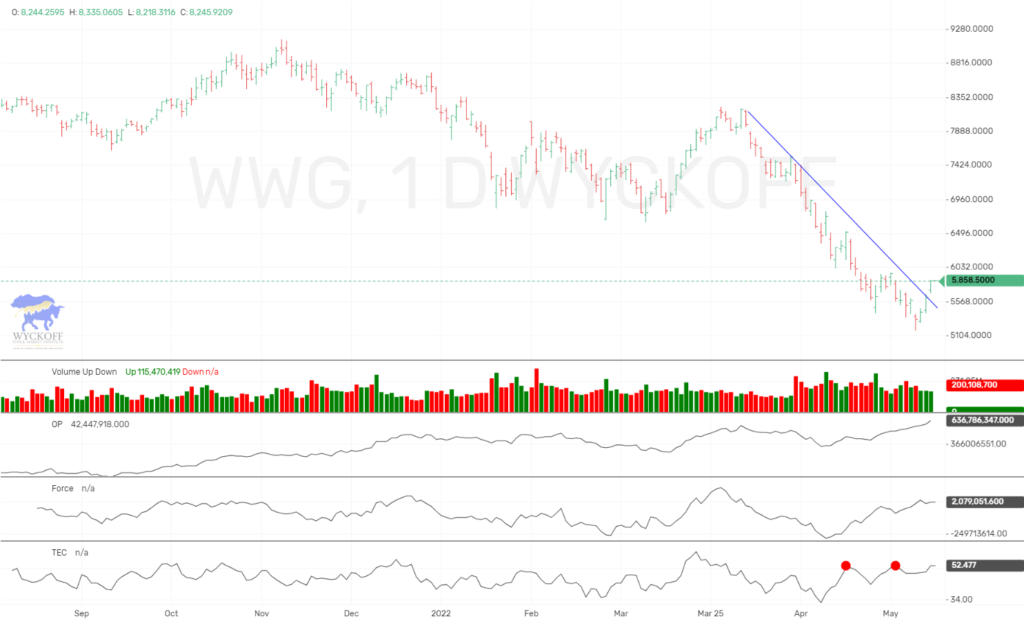
The Wyckoff Wave Growth Index (WWG), rallied as well with the Wyckoff Wave. We had expected a rally to the dashed supply line of the downtrend. We would now expect some type of correction here.

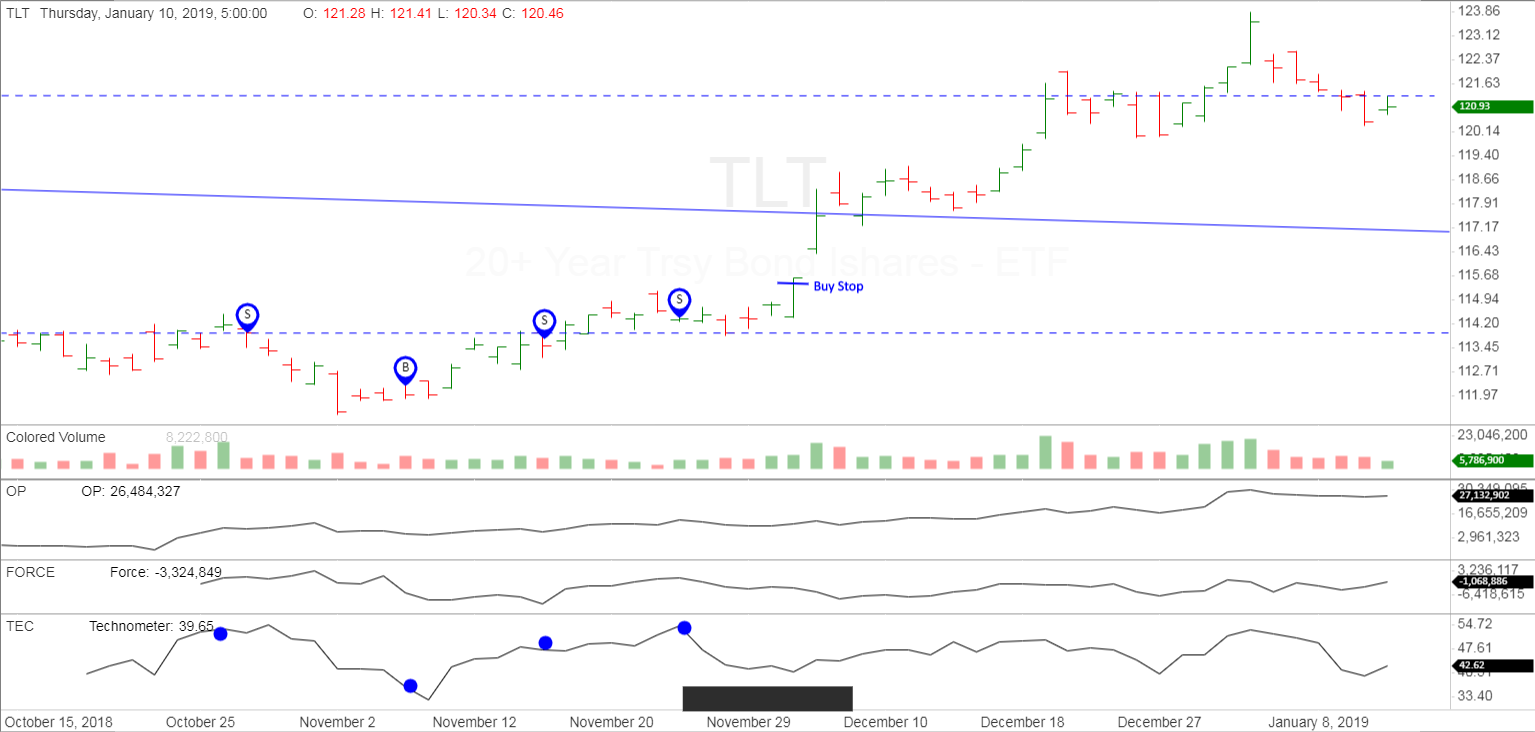
The bond market traded lower for the week in negative correlation to stocks.
The Technometer came down to near oversold and we could find support here, especially if stocks turn lower once again. We have no new positions, but could possibly purchase in the days ahead.
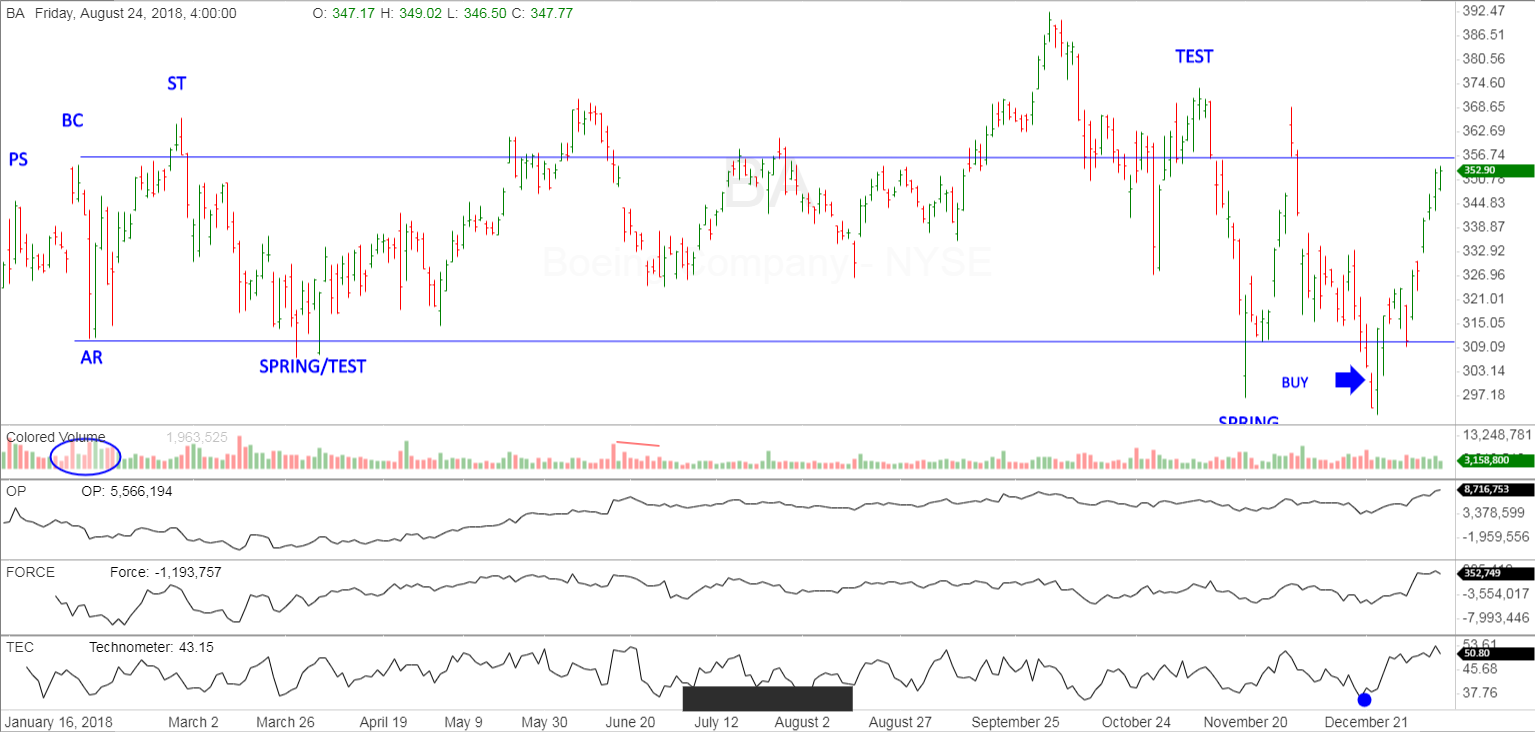
The following chart of Boeing (BA), shows the continued outperformance of this stock. We like this stock longer term, and would like to buy once again on a pullback.
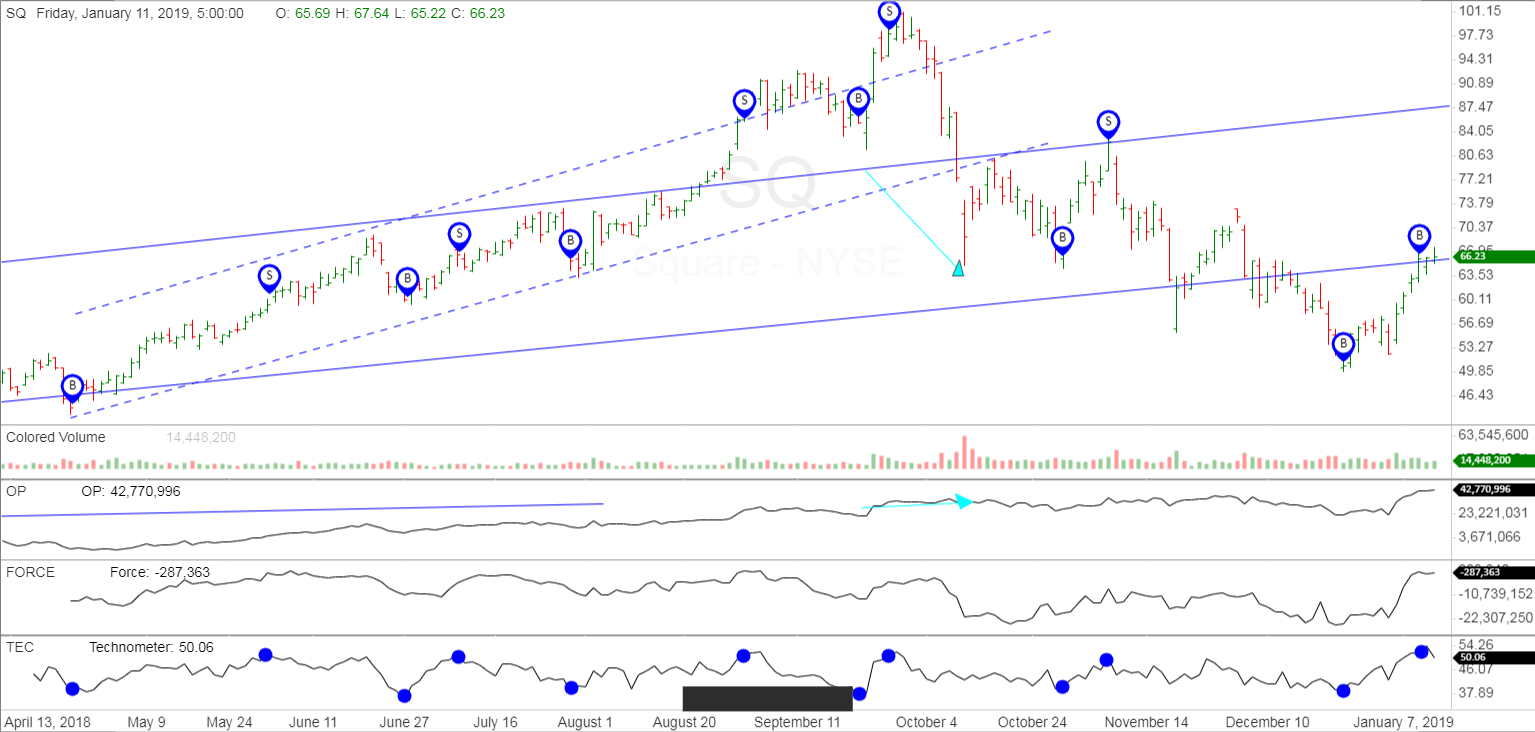
The software has been very successful with trades for Square (SQ). We got a solid overbought reading on SQ Wednesday as marked by the blue circles. We would like to see a short term correction here as well to purchase again.
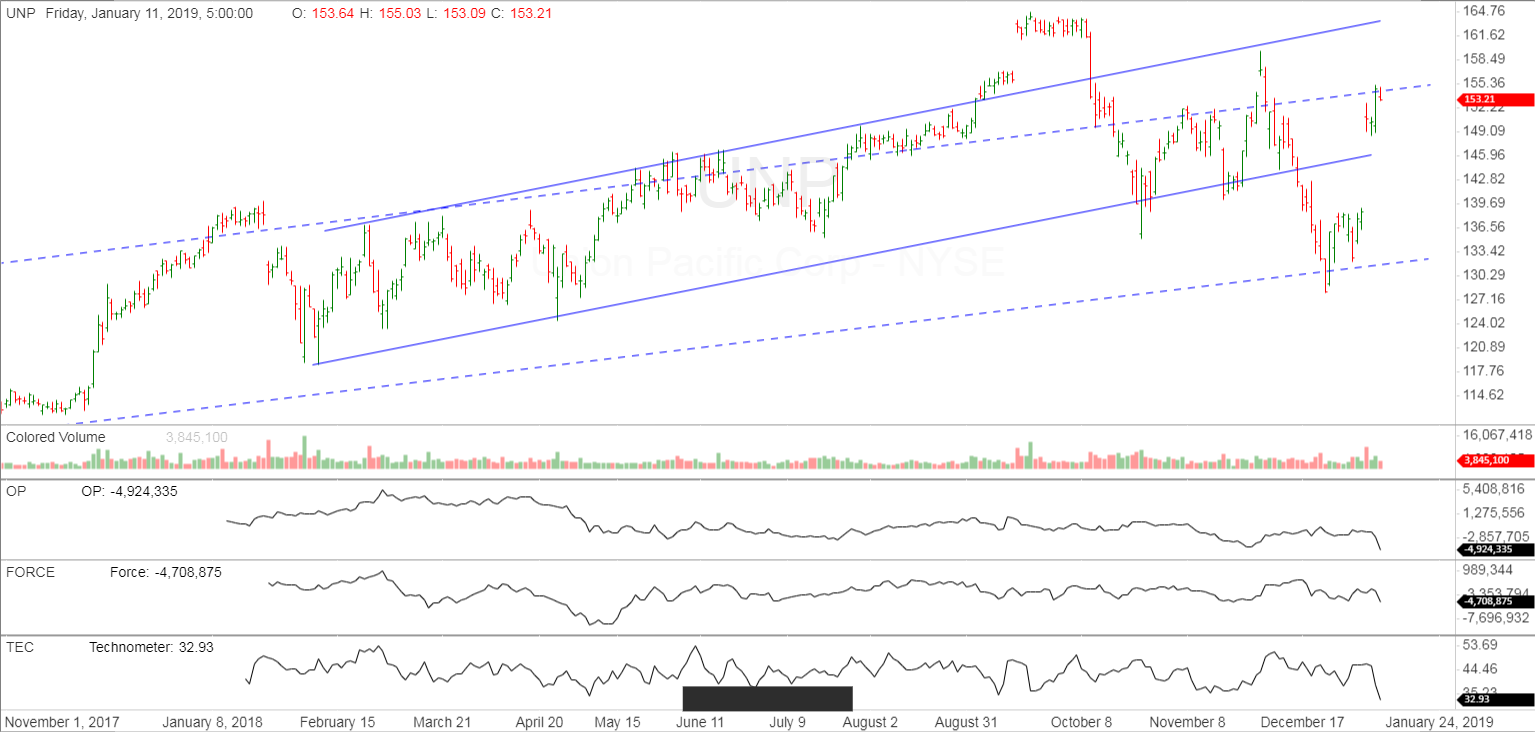
Union Pacific (UNP) also showing nice signs of strength. It also has rallied back to its overbought line of its longer term uptrend. We also like this one again on a pullback.
IMPORTANT ANNOUNCEMENT: Our “Pulse of The Market” charting software for Cryptocurrrencies is now working. This software has consolidated volume for the Crypto’s which is utmost important when applying Wyckoff Technical Analysis. We are showing this software in use on our social media sites.
Due to the demand for Bitcoin/Cryptocurrency information and trading knowledge, we released a Cryptocurrency and Wyckoff Trading Course at our site, LearnCrypto.io This course is being offered at an affordable $299.99. We have had 948 students enroll since its launch on June 22, 2017. On June 28th we added lessons detailing the OP, Force, and Technometer and how to use these Wyckoff Tools for analysis.
If you are interested in Wyckoff stock chart analysis as well as Crptocurrency, search “Learn Crypto / Wyckoff SMI” or click this link https://www.youtube.com/channel/UCDxK2PwEDvoaHZgjPV_WgcA
Please subscribe and click the bell to be notified of our upcoming broadcasts.
Our current schedule is Monday-Thursday approximately 6:30 p.m. CST, and they usually last approximately one hour. We will also broadcast at additional random times since we want to satisfy our international subscribers as well.
If you would also like to follow us on twitter for news and trade ideas, follow “LearnCryptoShow”, or “WyckoffonCrypto”. We have given numerous profitable trades to our subscribers on the Youtube channel, as well as Twitter.
Good Trading,
Todd Butterfield

Responses