The Wyckoff Wave Falls Back Further In The Trading Range.
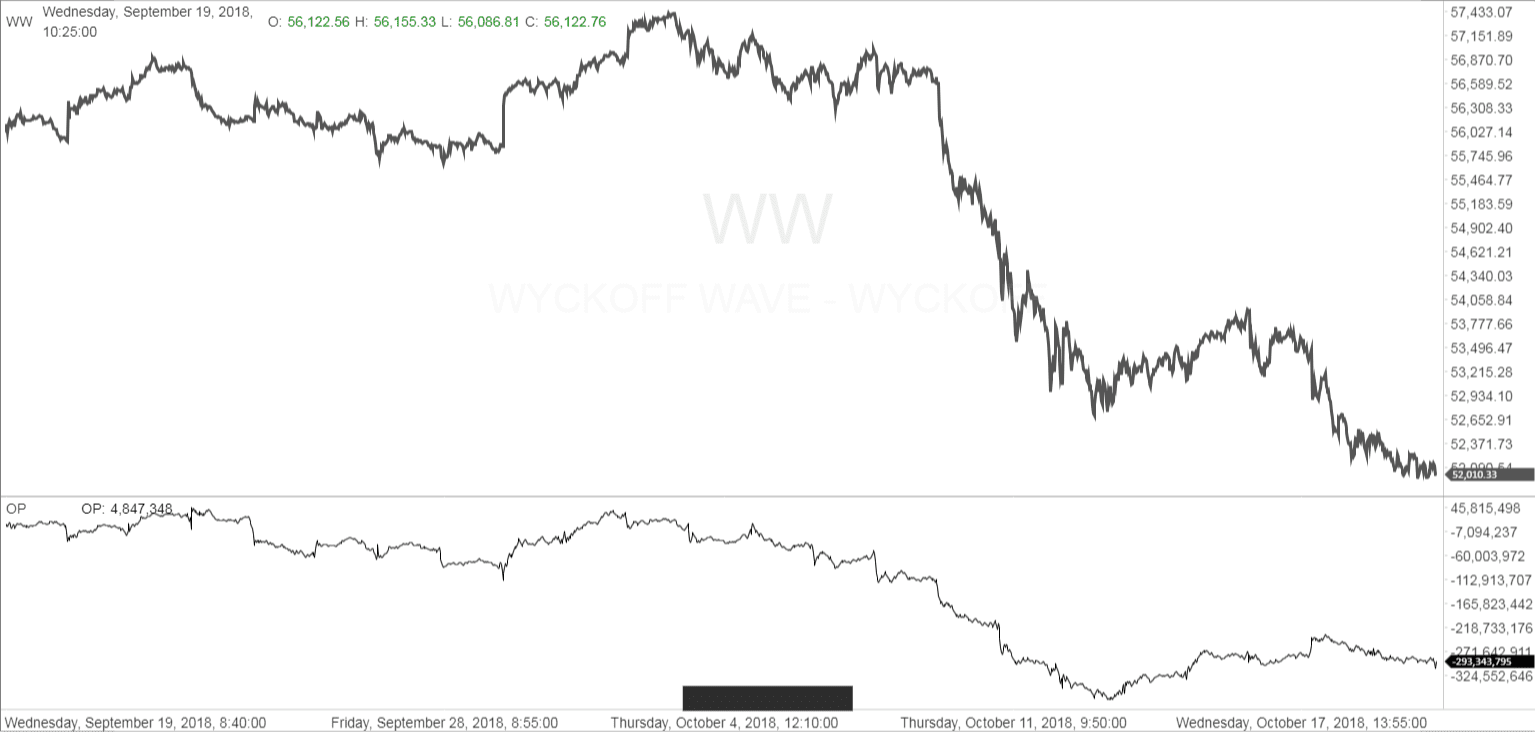
The Wyckoff Wave continued lower for the week. Volume was slightly lower on the selloff.
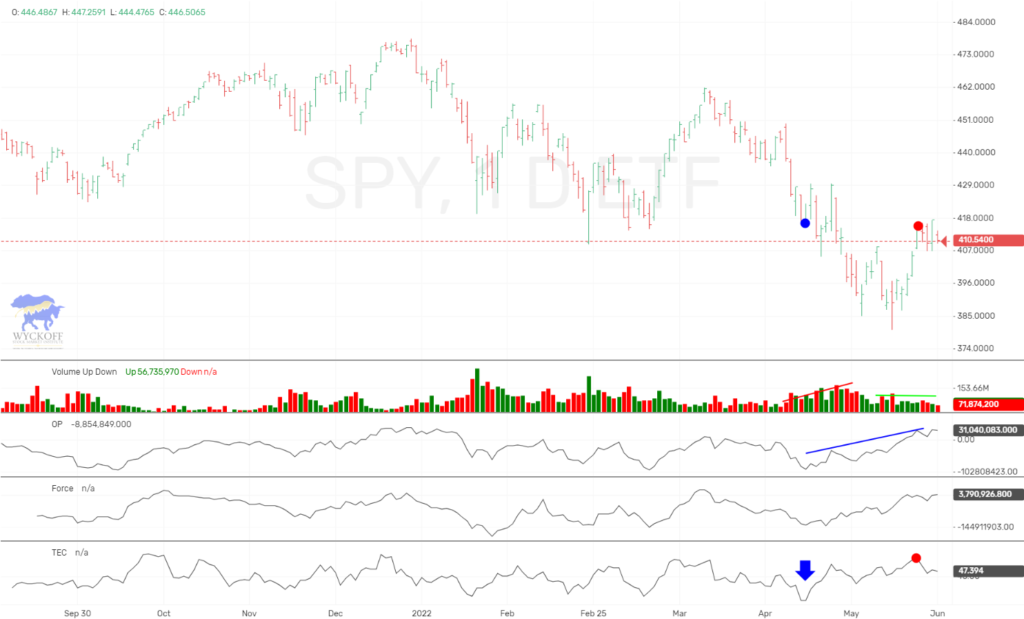
The O-P had its first week of outperformance in months.
The Force Index was up slightly for the week.
The Technometer is trading back above neutral.

We have been discussing over and over, how the OP has not acted well on the recent rallies. On the selloff of two weeks ago, we saw the OP collapse to new lows once again. But interesting enough, on this weeks continued selloff, the OP actually recorded a higher low. I show this in the above chart with the blue arrows. Due to this, I would guess that this weeks decline in the Wave, will be followed by a rally this coming week.
The one year daily chart shows the Wyckoff Wave breaking its longer term uptrend and continuing lower. More importantly it left behind an upthrust and is trading very weak.
Last weeks sharp decline, and deeply oversold Technometer forced us to cover our shorts, and look for a rally. We still feel there will be another rally attempt, which could offer us the opportunities to enter shorts, or liquidate under performing long positions.
At some point we could now revisit the bottom of the purple trading range that we have had marked for months.

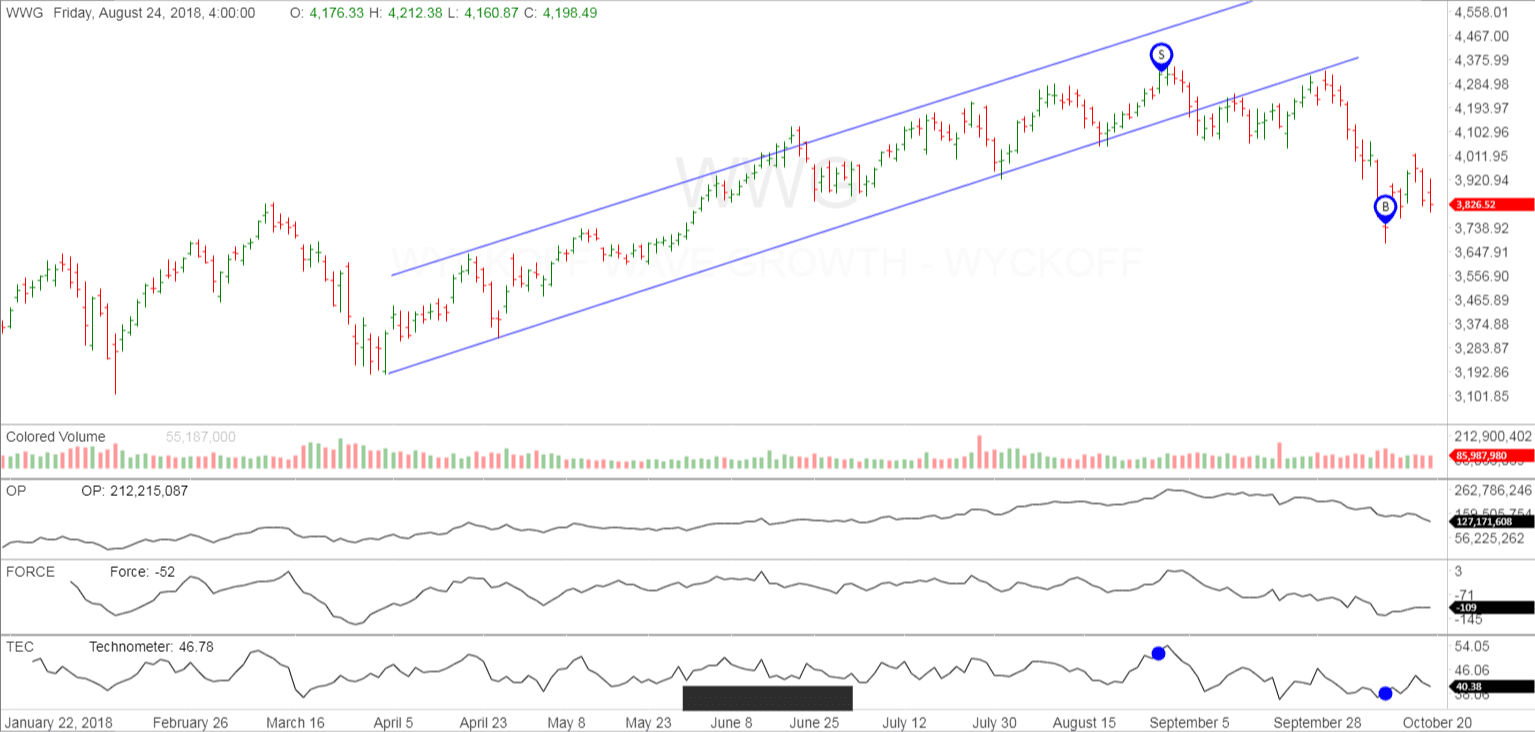
The Wyckoff Wave Growth Index (WWG), which trades more like the Nasdaq, traded slightly higher for the week. We had recommending covering shorts on the oversold Technometer, and still expect this market to bounce higher next week.
Here we actually had the OP go to a new low for this recent correction, while the price of WWG held up this week, which is a bullish divergence. So once again, this should bode well for a rally this coming week in the WWG.
We are looking to sell a recovery in prices, looking for test of recent lows, or new lows for the recent correction.
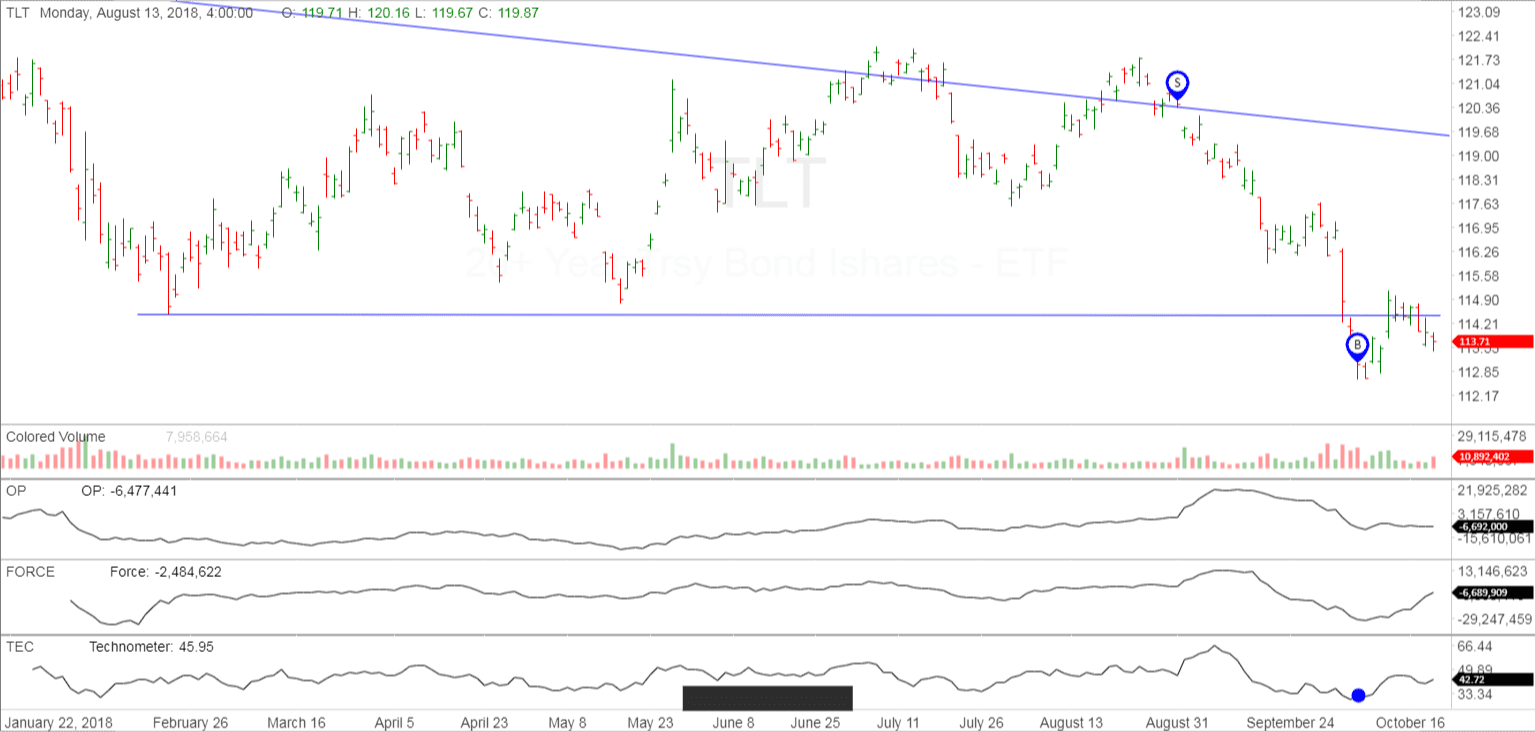
The bond market traded slightly lower for the week, due to liquidation of recent buying for a flight to safety trade. A general bounce in equity prices this week, sold off bonds slightly.
We had mentioned those with short term horizons to cover shorts at the “B” market, and look to sell a bounce. We have had a slight bounce, but are not reentering shorts at this time. We think the trend is for still lower bond prices, and higher interest rates.
IMPORTANT ANNOUNCEMENT: Our “Pulse of The Market” charting software for Cryptocurrrencies is now working. This software has consolidated volume for the Crypto’s which is utmost important when applying Wyckoff Technical Analysis. We are showing this software in use on our social media sites.
Due to the demand for Bitcoin/Cryptocurrency information and trading knowledge, we released a Cryptocurrency and Wyckoff Trading Course at our site, LearnCrypto.io This course is being offered at an affordable $299.99. We have had 943 students enroll since its launch on June 22, 2017. On June 28th we added lessons detailing the OP, Force, and Technometer and how to use these Wyckoff Tools for analysis.
If you are interested in Wyckoff stock chart analysis as well as Crptocurrency, search “Learn Crypto / Wyckoff SMI” or click this link https://www.youtube.com/channel/UCDxK2PwEDvoaHZgjPV_WgcA
Please subscribe and click the bell to be notified of our upcoming broadcasts.
Our current schedule is Monday-Thursday approximately 6:30 p.m. CST, and they usually last approximately one hour. We will also broadcast at additional random times since we want to satisfy our international subscribers as well.
If you would also like to follow us on twitter for news and trade ideas, follow “LearnCryptoShow”, or “WyckoffonCrypto”. We have given numerous profitable trades to our subscribers on the Youtube channel, as well as Twitter.
Good Trading,
Todd Butterfield


I am very interested. Please keep me posted as to everything you have to offer regarding training and products offered by SMI