The Wyckoff Wave slow grind higher continues ….
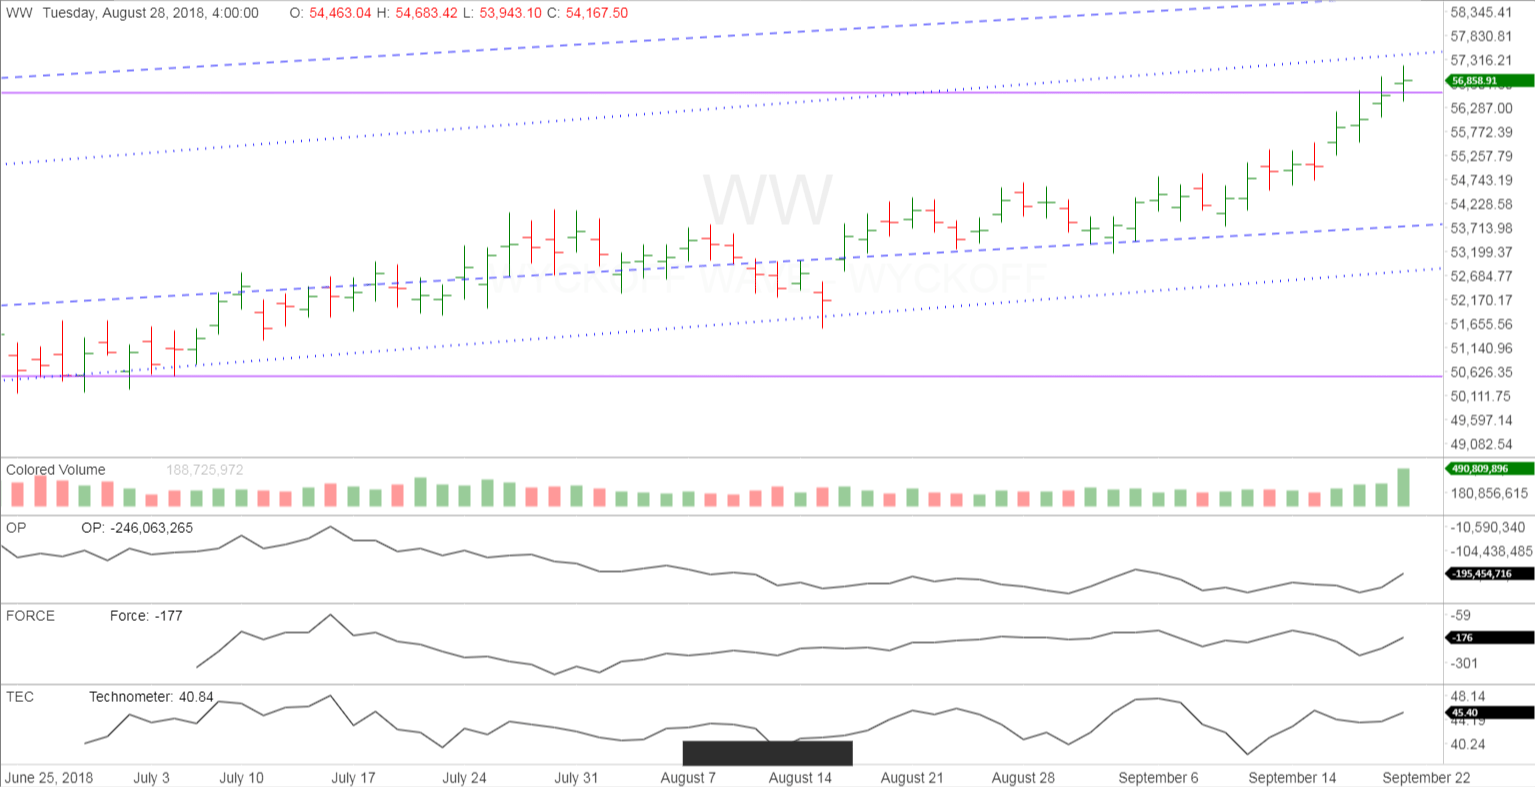
The Wyckoff Wave traded nicely higher for the week once again. We managed to penetrate the resistance level of the trading range we have been showing in purple. Volume increased for the week heading into Friday’s close.
The O-P continues to trade basically sideways but did join the rally somewhat on Thursday/Friday.
The Force Index was up for the week as well but still below the highs of the last few weeks.
The Technometer is trading in a slightly above neutral reading.
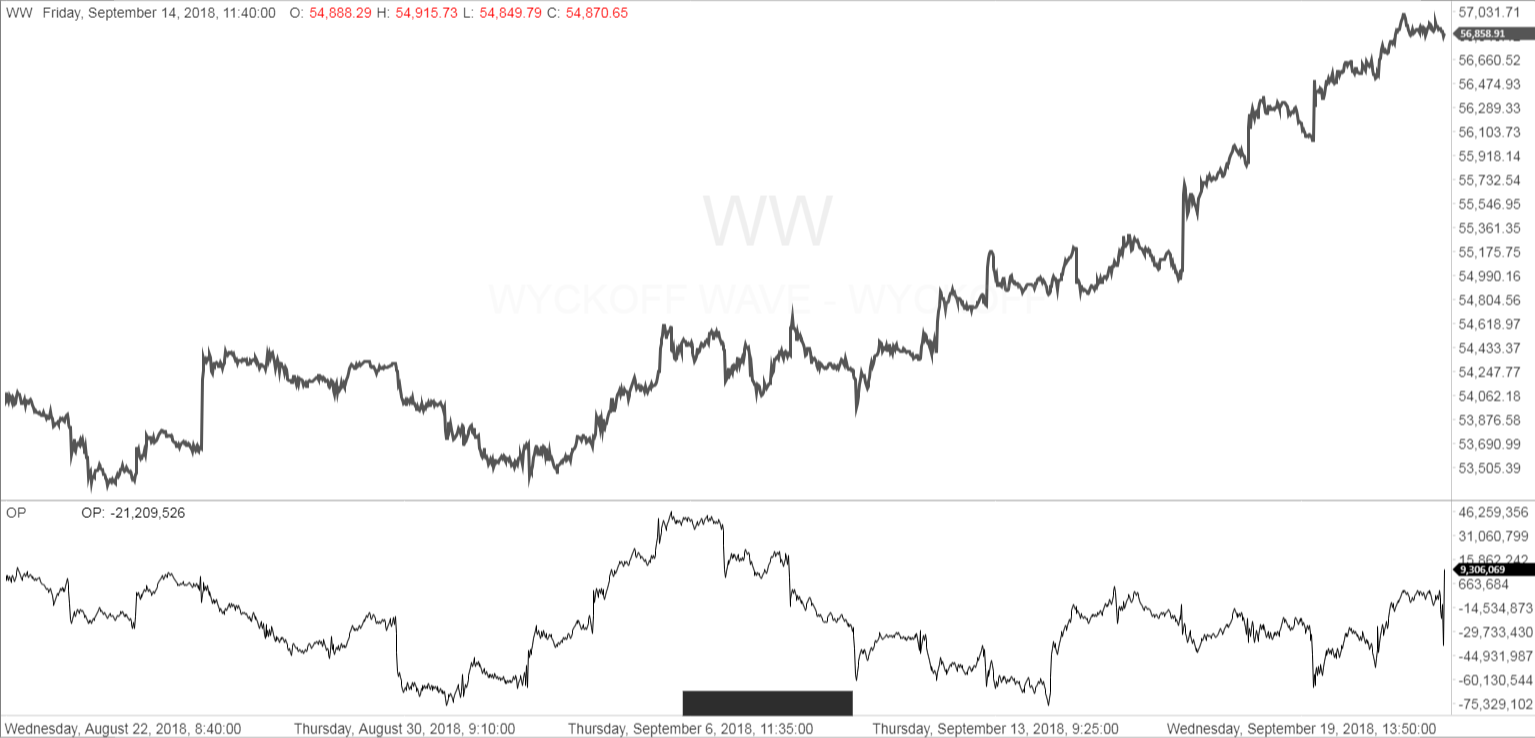
The intraday chart for last week had the OP not responding to the upside until after Wednesday’s close. Then volume came in to support the rally into Friday’s close. It will be interesting how the OP responds early this week. Lets see if it continues supporting the rally, or turns back to the downside.
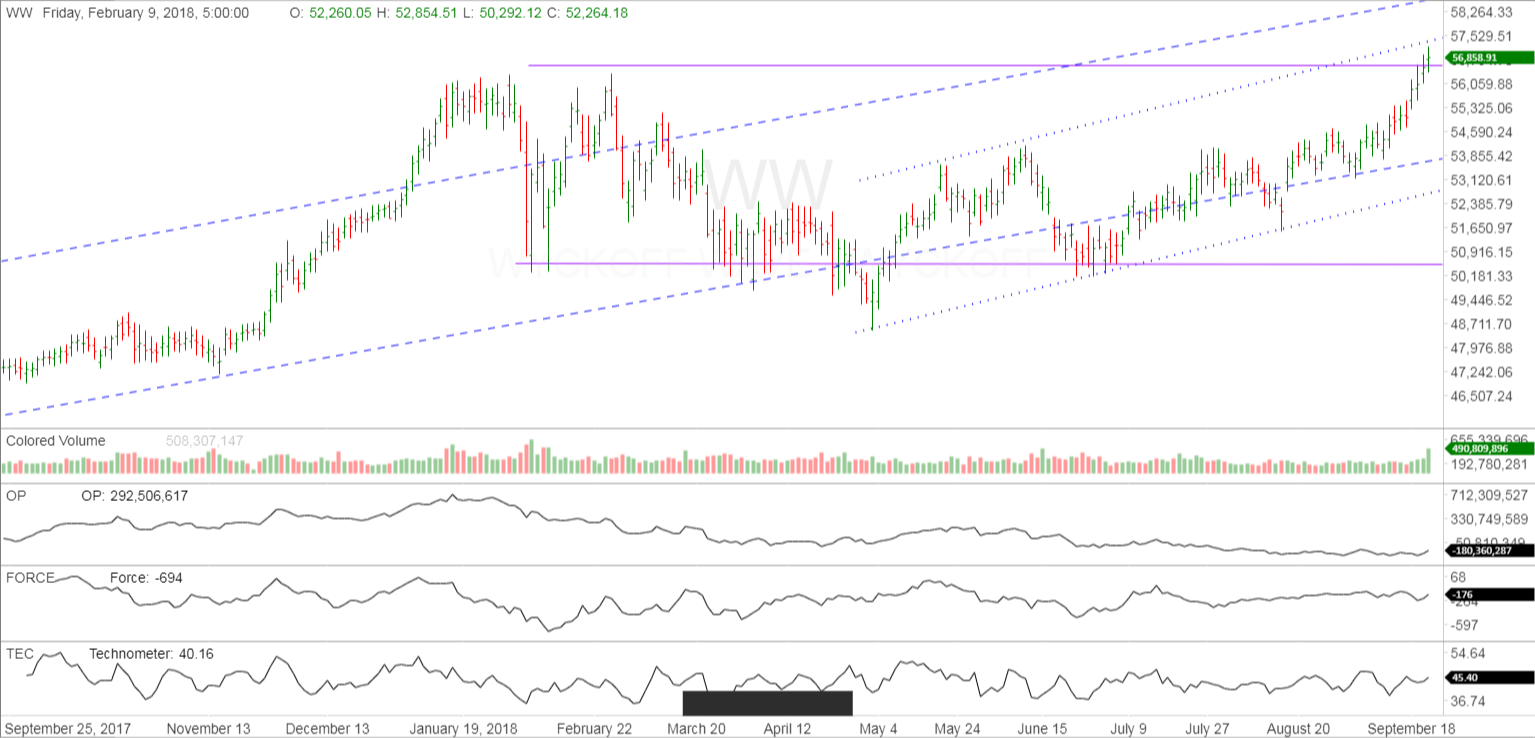
The one year daily chart shows the Wyckoff Wave trading in an uptrend on an intermediate term basis. It appeared to be losing that uptrend, but last weeks rally got the Wave firmly back into the uptrend. We had thought that a rally to the resistance line of the purple uptrend would only be a test of the range, and not a jump across the creek forming. We still believe it is a test, and we will see more sideways action, and not acceleration to the upside.
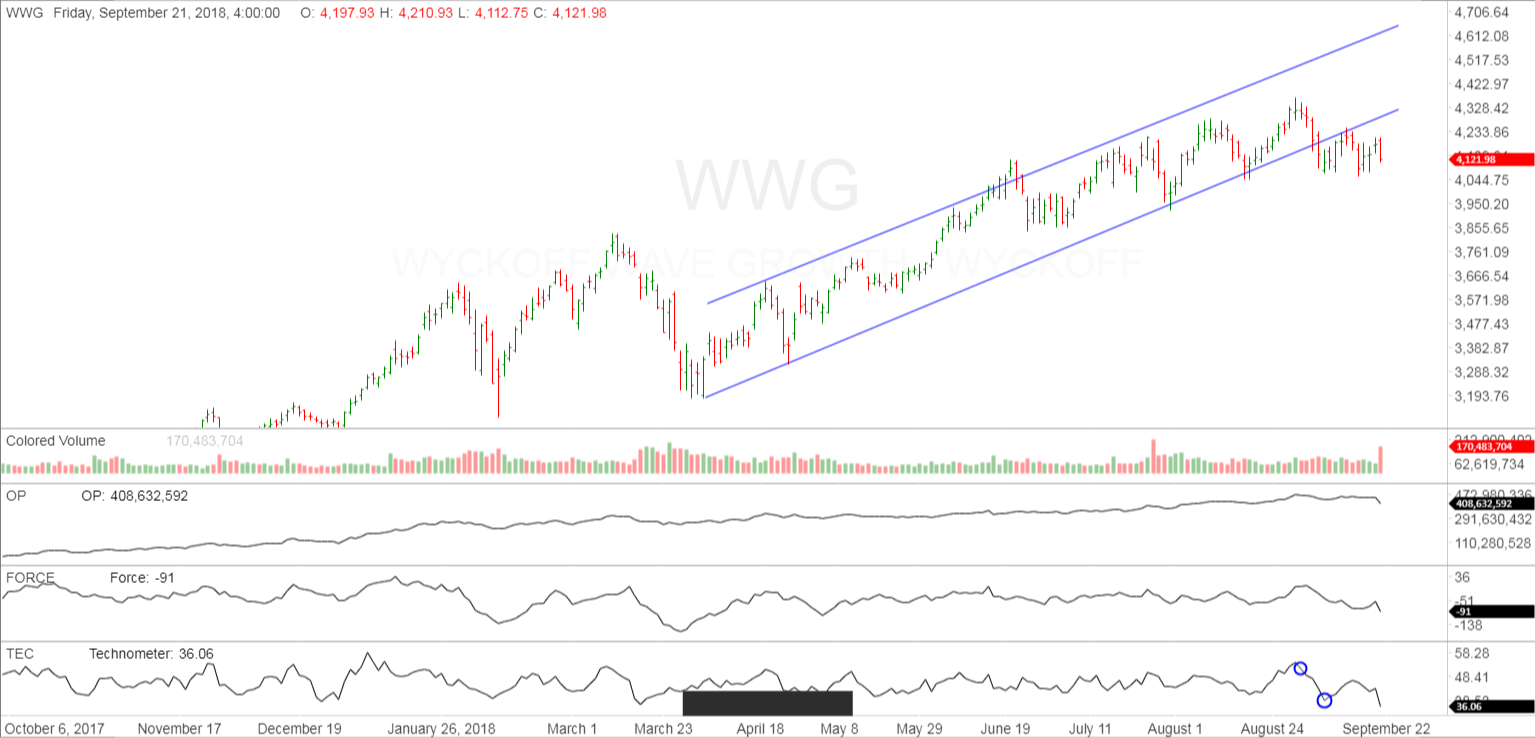
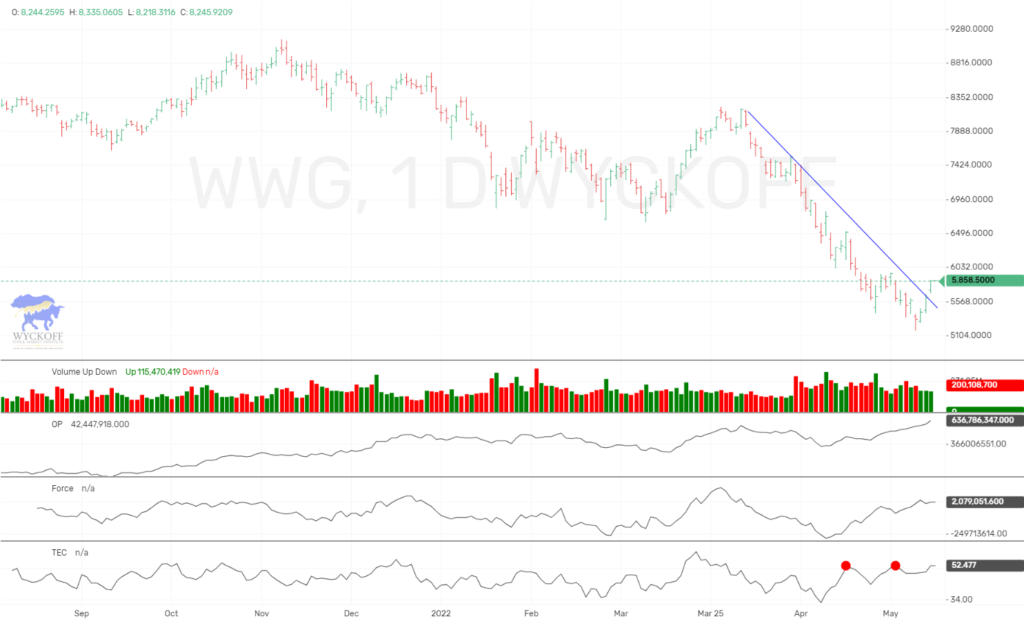
The Wyckoff Wave Growth Index (WWG) traded lower for the week as expected. The WWG had broken its uptrend, then tested it, and we was looking for further downside action.
The Technometer is once again deeply oversold, so we need to watch the action early next week. The OP and Force has gone to new lows for the move, and providing downside pull on WWG.
Continue to hold shorts and trail stops.
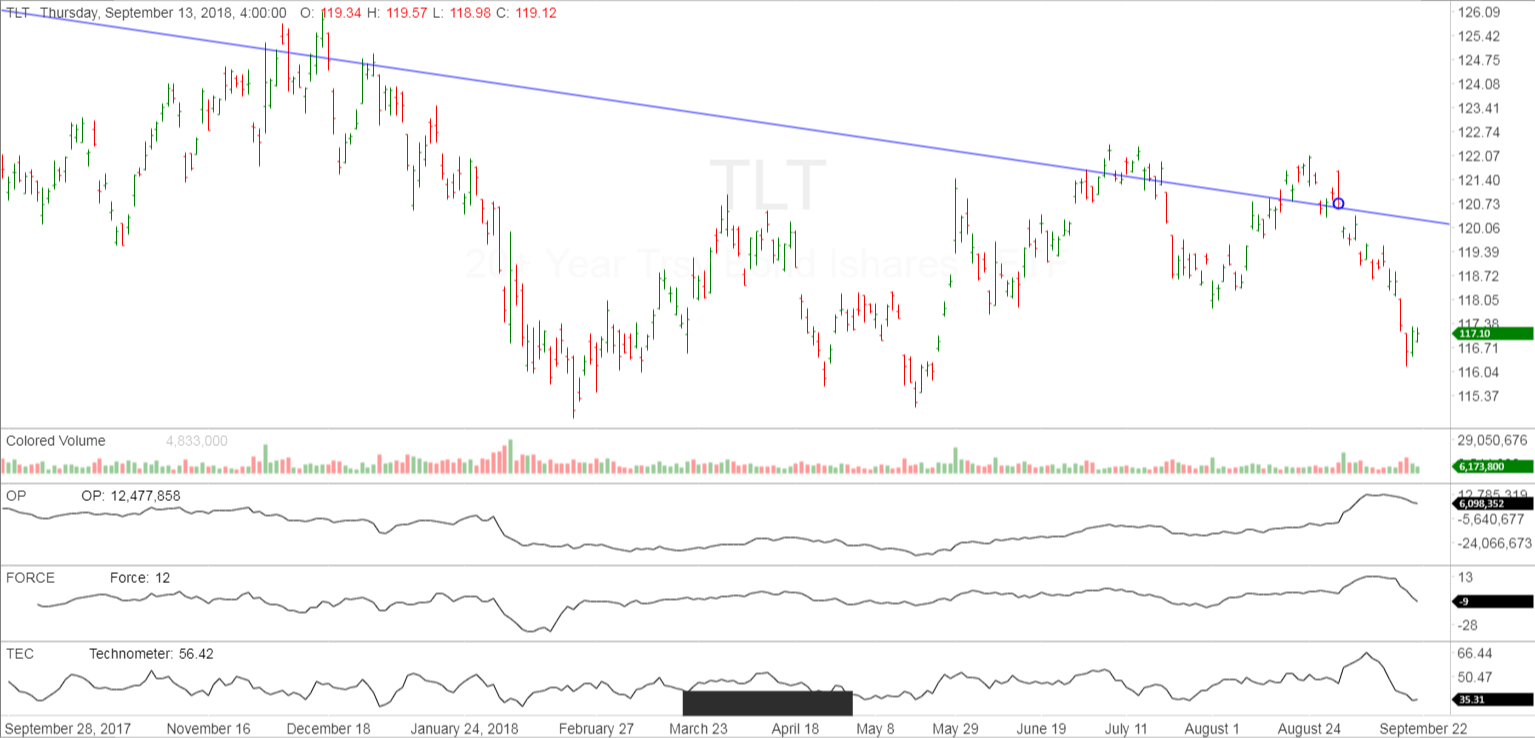
The bond market traded sharply lower for the week as called for. We just had a major overbought reading on the TLT, and now we are at deeply oversold. Here as well, the trade early in the week should be telling. We are in steep downtrend that could let up for a few days to relieve the oversold Technometer reading. But it appears we still have more downside action ahead.
Stay short and trail stops.
IMPORTANT ANNOUNCEMENT: Our “Pulse of The Market” charting software for Cryptocurrrencies is now working. This software has consolidated volume for the Crypto’s which is utmost important when applying Wyckoff Technical Analysis. We are showing this software in use on our social media sites.
Due to the demand for Bitcoin/Cryptocurrency information and trading knowledge, we released a Cryptocurrency and Wyckoff Trading Course at our site, LearnCrypto.io This course is being offered at an affordable $299.99. We have had 941 students enroll since its launch on June 22, 2017. On June 28th we added lessons detailing the OP, Force, and Technometer and how to use these Wyckoff Tools for analysis.
If you are interested in Wyckoff stock chart analysis as well as Crptocurrency, search “Learn Crypto / Wyckoff SMI” or click this link https://www.youtube.com/channel/UCDxK2PwEDvoaHZgjPV_WgcA
Please subscribe and click the bell to be notified of our upcoming broadcasts.
Our current schedule is Monday-Thursday approximately 6:30 p.m. CST, and they usually last approximately one hour. We will also broadcast at additional random times since we want to satisfy our international subscribers as well.
If you would also like to follow us on twitter for news and trade ideas, follow “LearnCryptoShow”, or “WyckoffonCrypto”. We have given numerous profitable trades to our subscribers on the Youtube channel, as well as Twitter.
Good Trading,
Todd Butterfield

Responses