The Wyckoff Wave still trading constructive for further advance
The Wyckoff Wave traded sideways this past week. Volume was slightly higher for the week.
The O-P continues to underperform on the upside. We have low volume levels, and no buy volume to help the rallies.
The Force Index declined slightly for the week.
The Technometer closed the week slightly below neutral.
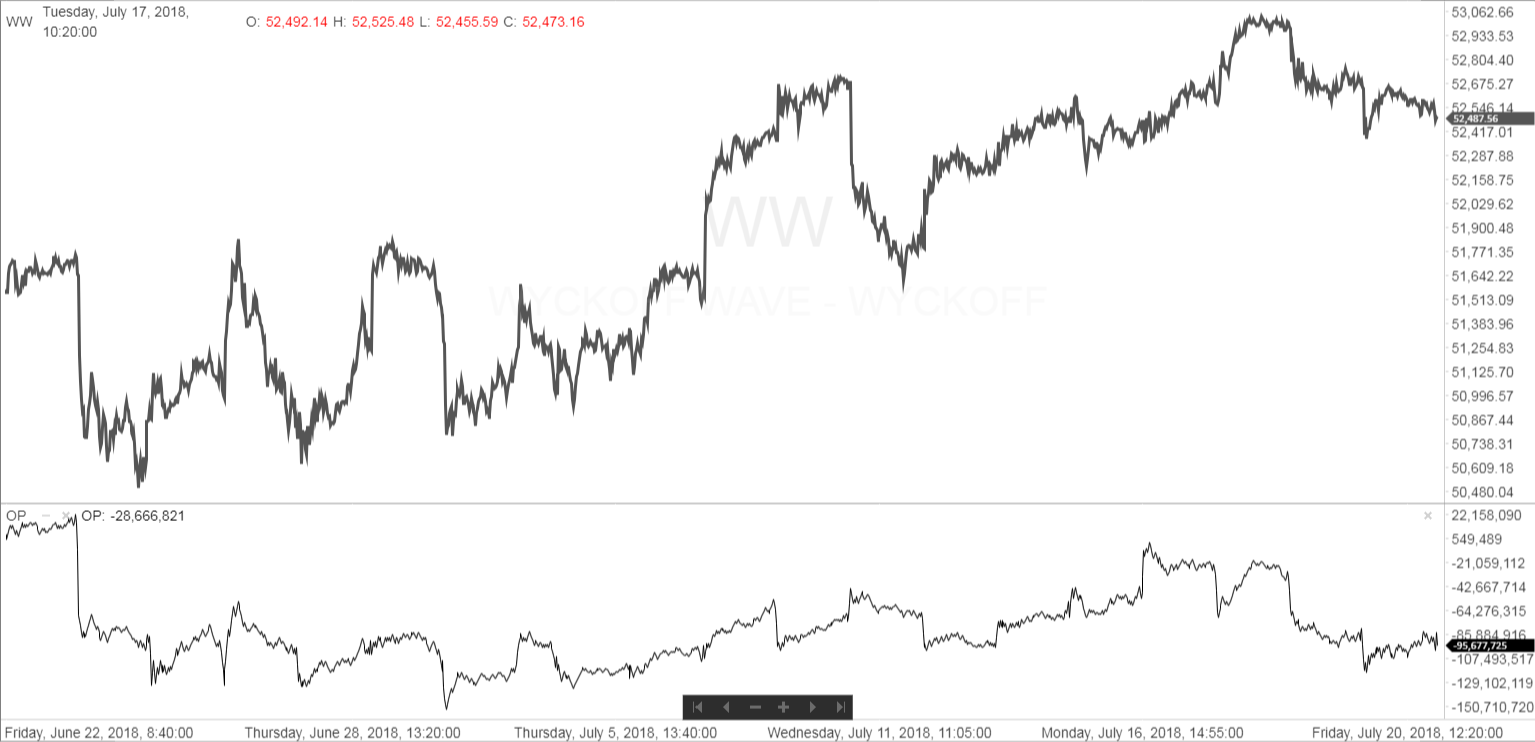
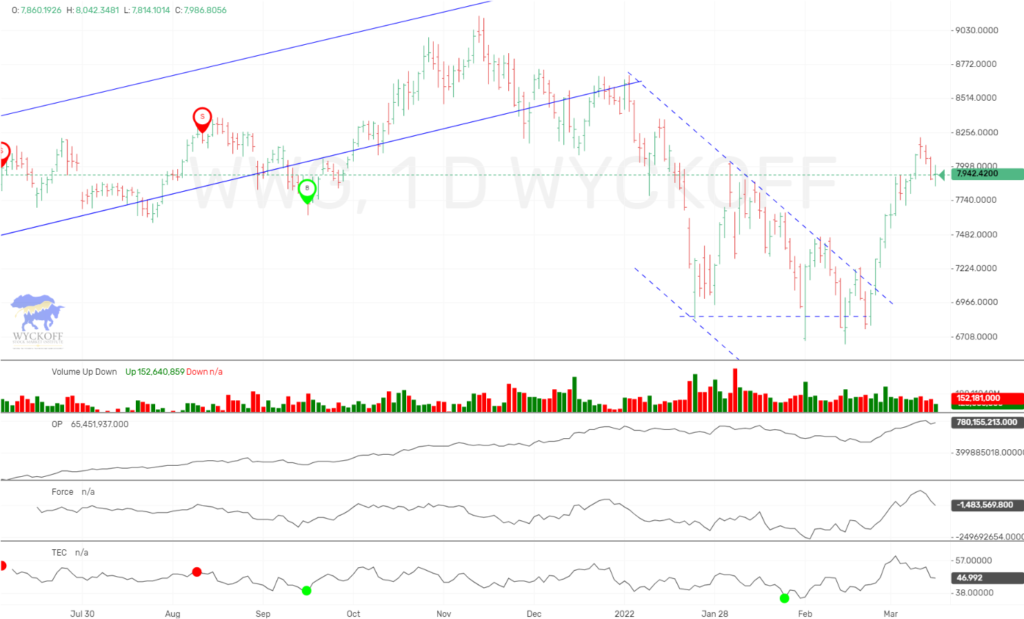
The intraday chart for last week shows slight under performance of the OP versus the Wyckoff Wave (WW). The OP will need to expand to the upside with good volume to keep this rally alive…
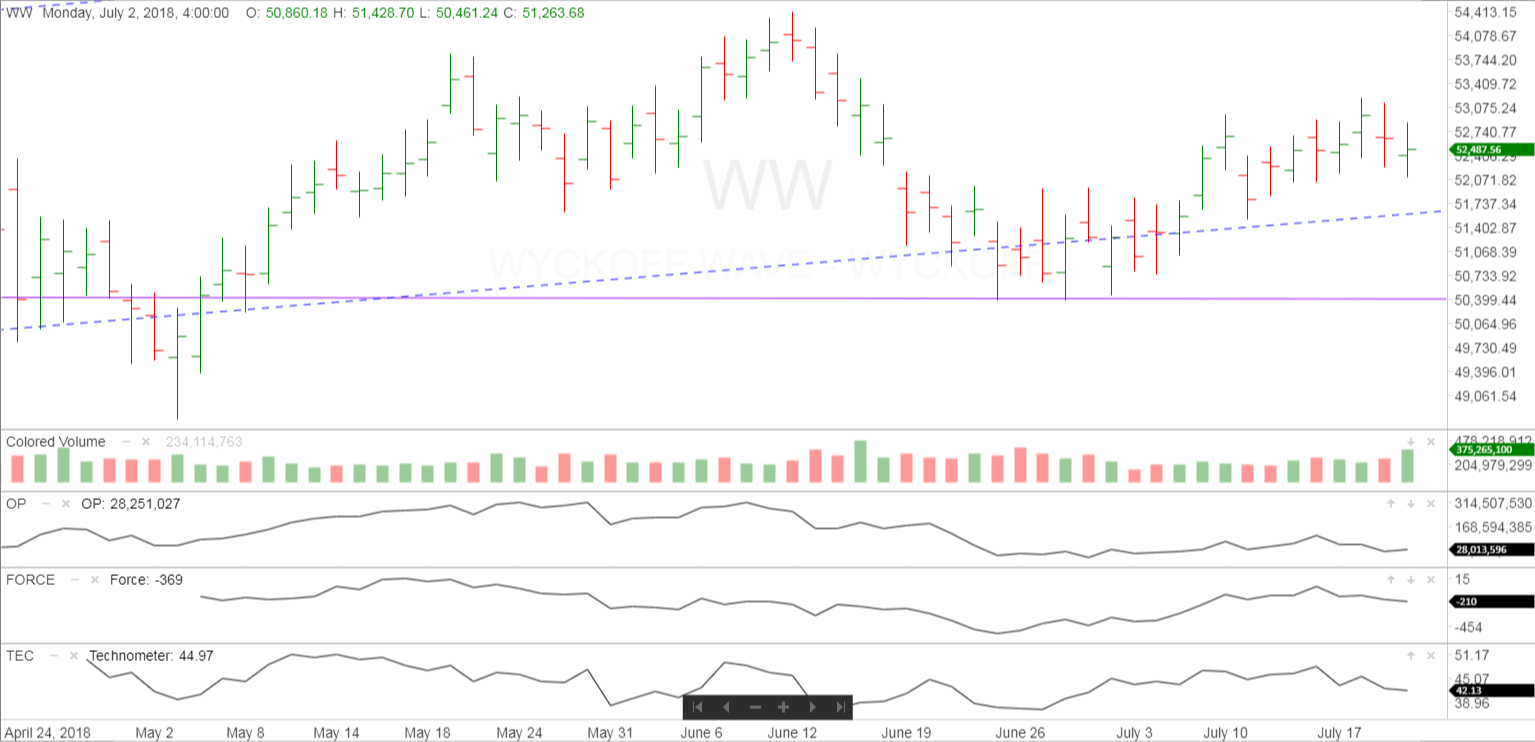
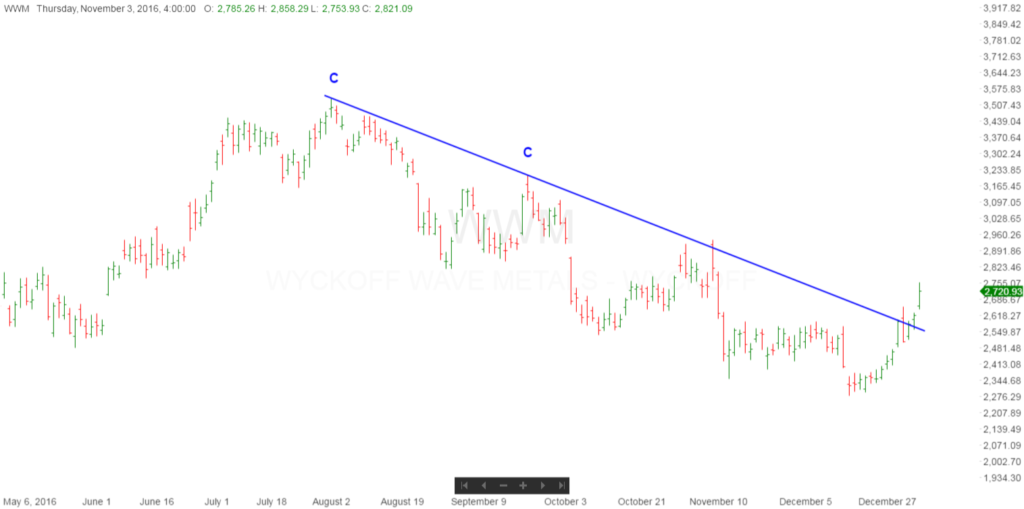
The one year daily chart shows the Wyckoff Wave trading in an uptrend on an intermediate term basis, and near the previous purple support line of the recent trading range. I pullback this week should find support at the support line of the dashed blue uptrend.
With the Technometer slightly below neutral we would expect it to quickly to get to oversold on any further reaction. After that we need to see volume to come in and support the next rally.
If the 50,500 level was a test of the previous spring down to 49,000 then this rally should be able to continue with wider spread and volume. If it does not, then any long positions could be in trouble, and we would not want to see the support at 50,500 to then give away.

The Wyckoff Wave Growth Index (WWG) spent the first few days of the week at all time highs, then experienced slight selling late in the week. Like the Wyckoff Wave, any pullback here should find support at the support line of its recent uptrend.
Its Technometer reading is also neutral and will approach oversold on any pullback.

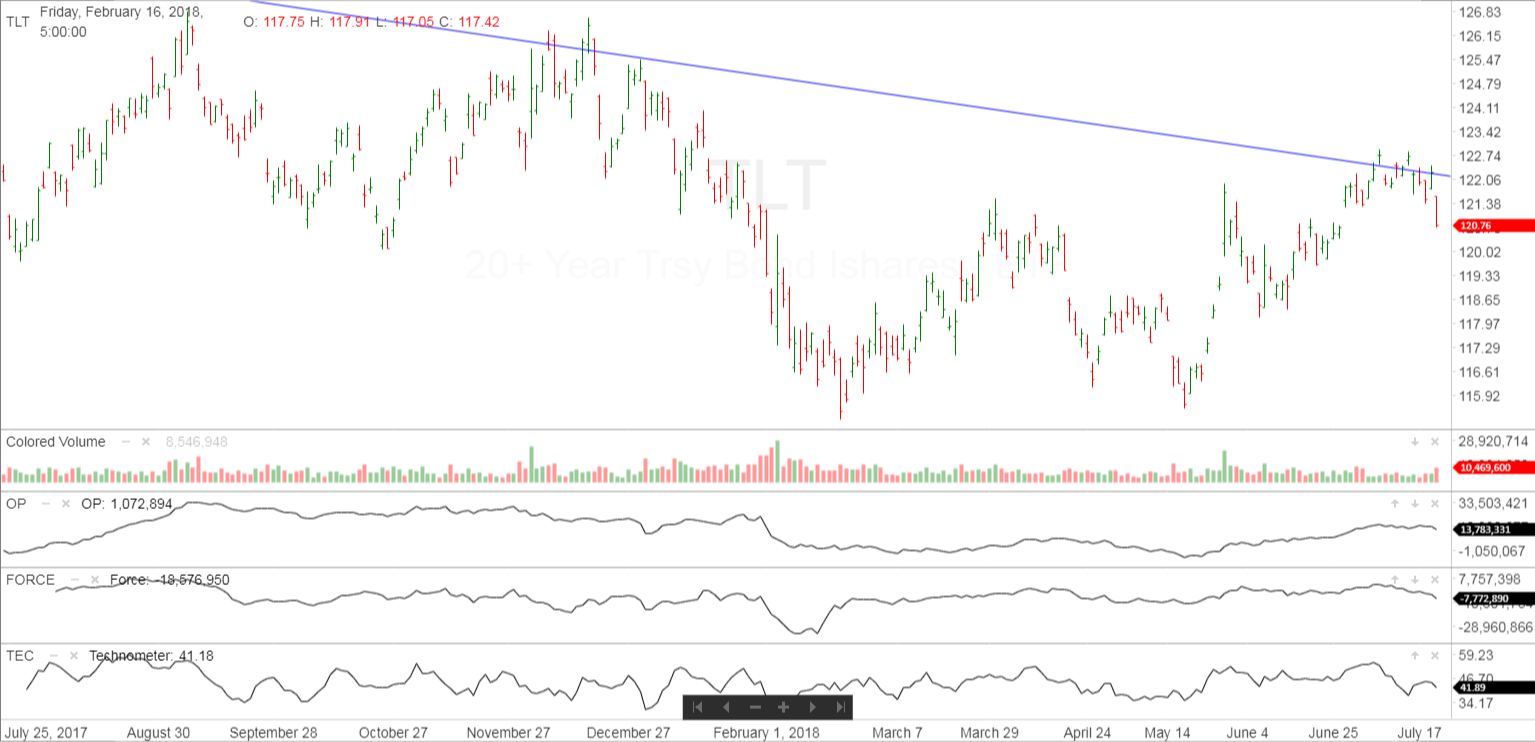
The bond market once again traded lower for the week with a sharp selloff on Friday. Volume increased on the selloff, and we feel that this is bearish action. We now want to get short this market on a corrective bounce.
It has met resistance at its supply line of its downtrend, and volume was the highest of the last three weeks on the selloff.
IMPORTANT ANNOUNCEMENT: Our “Pulse of The Market” charting software for Cryptocurrrencies is now working. This software has consolidated volume for the Crypto’s which is utmost important when applying Wyckoff Technical Analysis. We are going to test reliability next few weeks, and then preparing to offer it to subscribers.
Due to the demand for Bitcoin/Cryptocurrency information and trading knowledge, we released a Cryptocurrency and Wyckoff Trading Course at our site, LearnCrypto.io This course is being offered at an affordable $299.99. We have had 937 students enroll since its launch on June 22, 2017. On June 28th we added lessons detailing the OP, Force, and Technometer and how to use these Wyckoff Tools for analysis.
If you are interested in Wyckoff stock chart analysis as well as Crptocurrency, search “Learn Crypto / Wyckoff SMI” or click this link https://www.youtube.com/channel/UCDxK2PwEDvoaHZgjPV_WgcA
Please subscribe and click the bell to be notified of our upcoming broadcasts.
Our current schedule is Monday-Thursday approximately 6:30 p.m. CST, and they usually last approximately one hour. We will also broadcast at additional random times since we want to satisfy our international subscribers as well.
If you would also like to follow us on twitter for news and trade ideas, follow “LearnCryptoShow”, or “WyckoffonCrypto”. We have given numerous profitable trades to our subscribers on the Youtube channel, as well as Twitter.
Good Trading,
Todd Butterfield

Responses