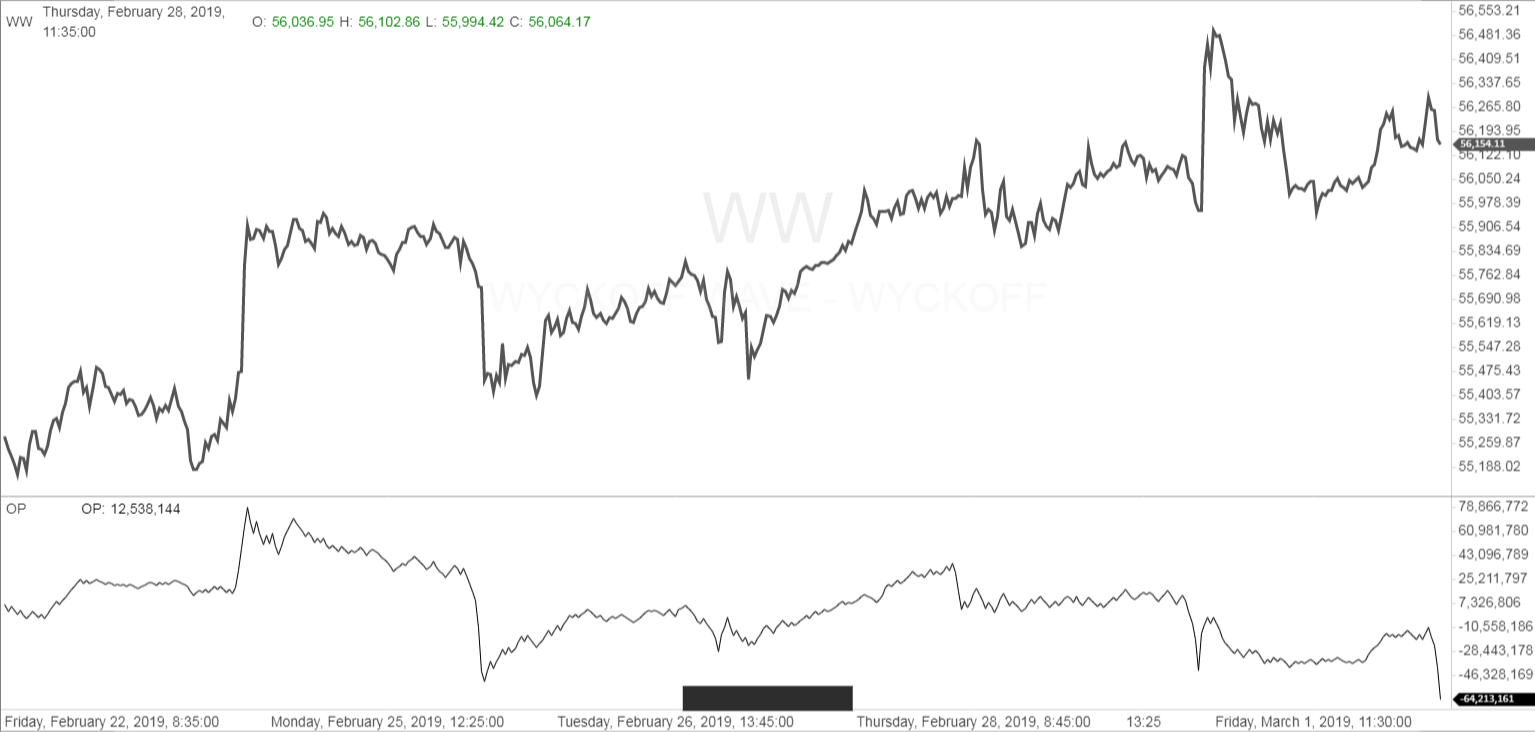
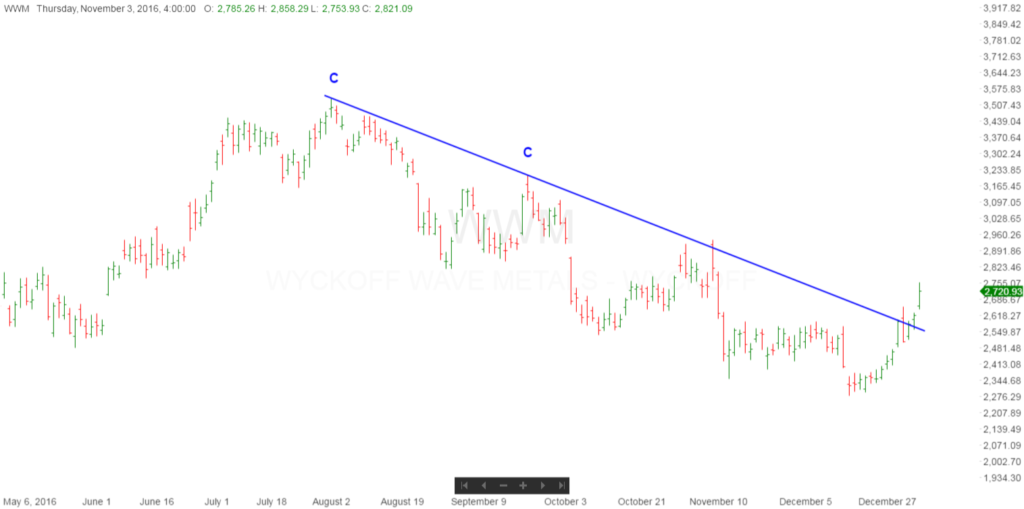
The Wyckoff Wave Trading At Resistance
The Wyckoff Wave once again was up ever so slightly for the week. We rallied up to the resistance line as marked and traded at it all week. Volume was average.
The O-P was down slightly for the week.
The Force Index was also down slightly for the week.
The Technometer reading is nearing oversold.

The intraday OP is leading to the downside, which is giving us the quickly oversold Technometer.
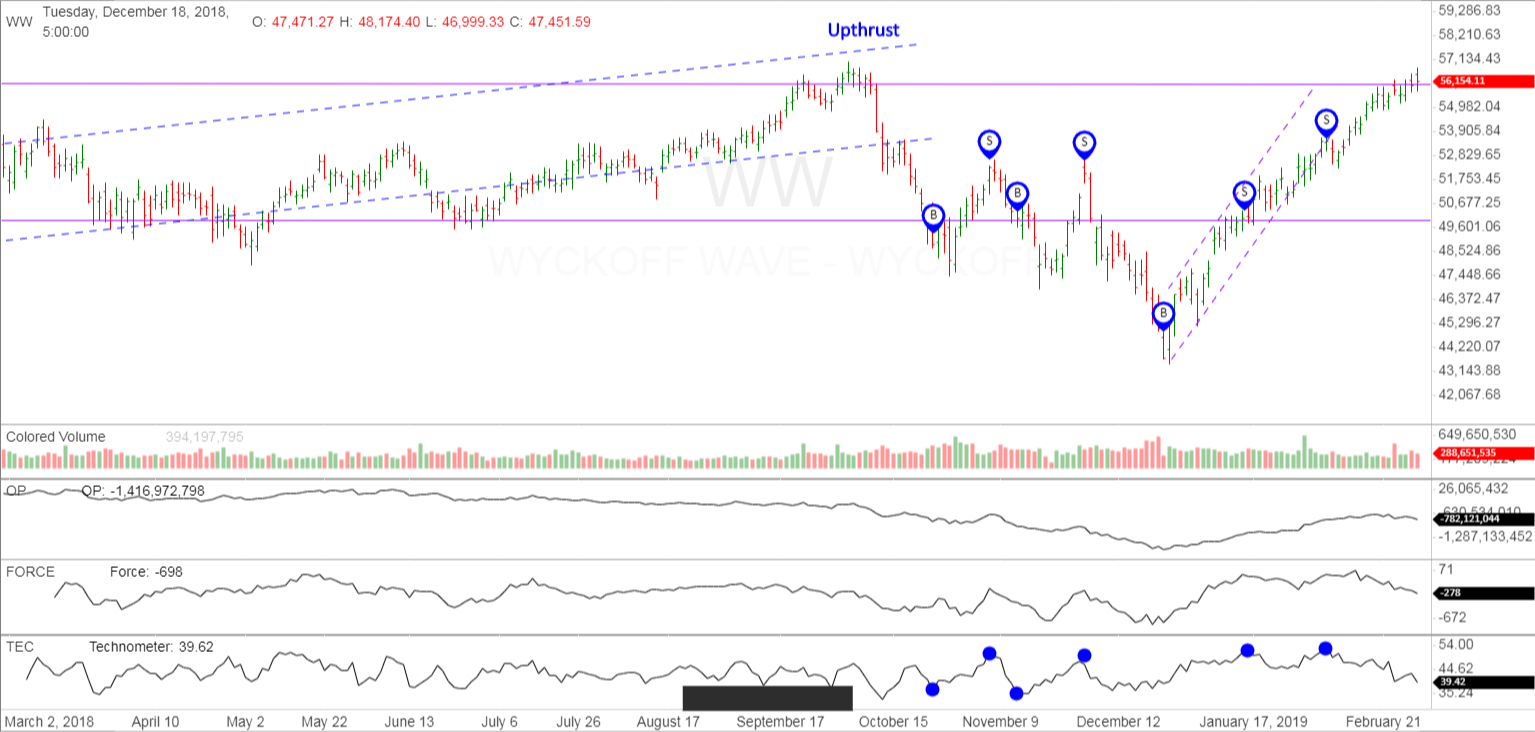
The Wyckoff Wave is meeting some resistance at the top of the trading range.
With the Technometer near overbought on the recent rally, it did slow the rally. But without any meaningful correction, the Technometer is now nearing oversold. This would be considered bullish action.
The rally off the 44,000 level has been very impressive and keeps this long bull market alive. We still expect further sideways action in the weeks and months ahead, and then ending action for renewed gains.
The Wyckoff Wave Growth Index (WWG) was also up slightly for the week. This market is underperforming and still appears could continue to trade sideways in the week ahead.

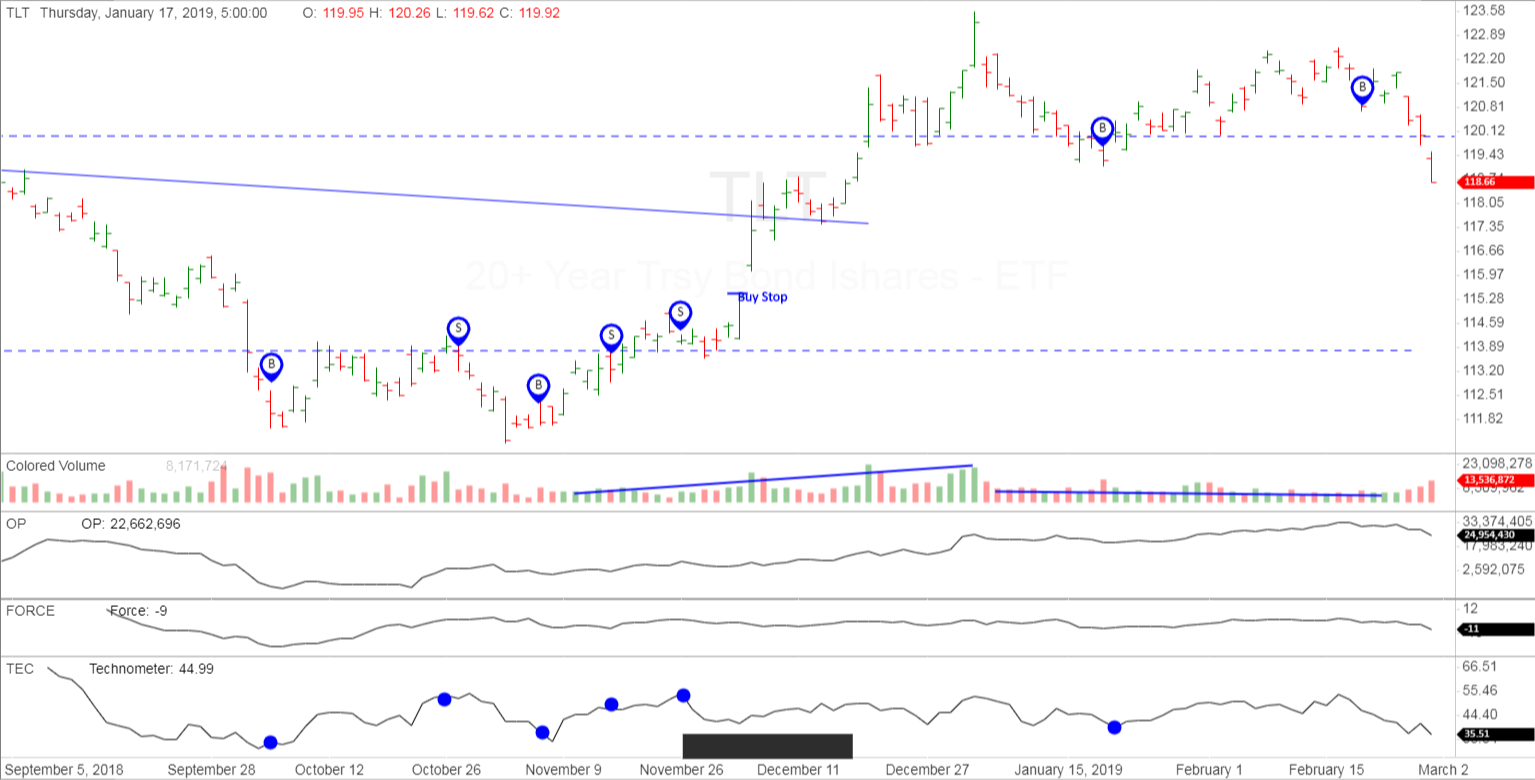
The bond market traded sharply lower for the week. We had came off of major overbought on the Technometer, and now we are extremely oversold. We would like to see a quick reversal here to the upside and we could call this low an LPS. Also it would be a SPRING in and uptrend which is a low risk Wyckoff opportunity. Lets see how Monday’s action looks.
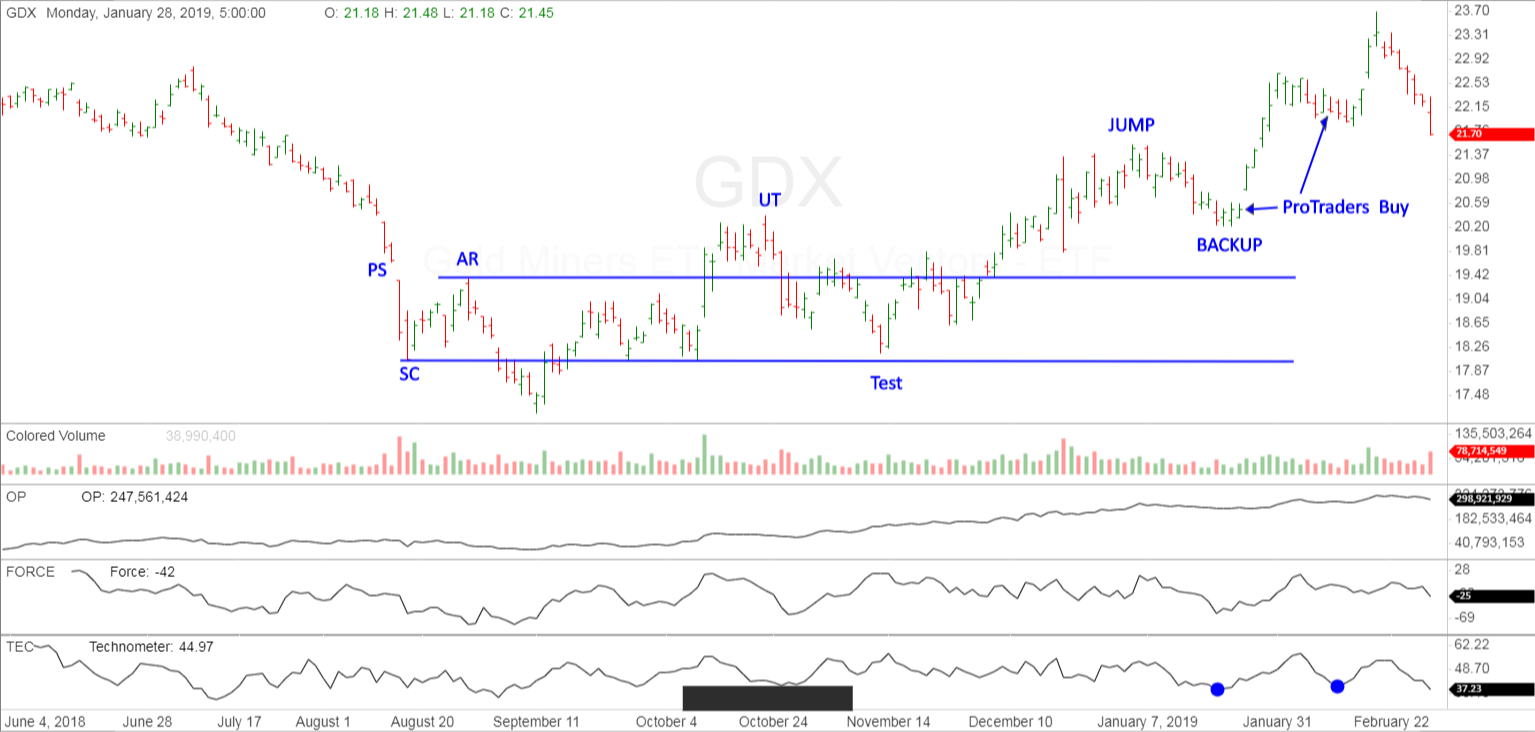
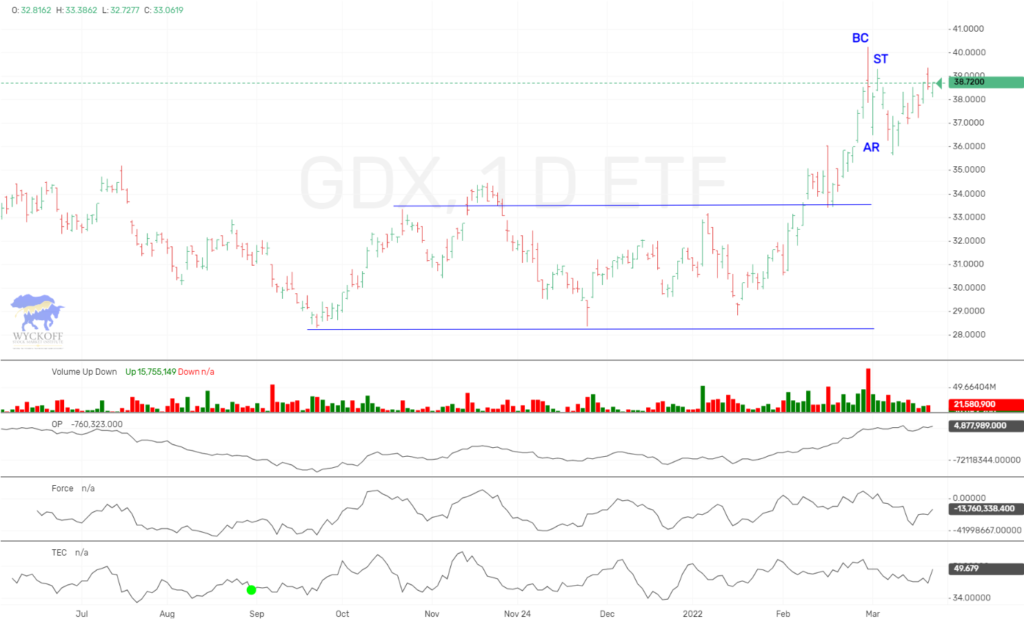
The GDX was down sharply for the week. We did get stopped out of our recommended longs for profit mid week, but we will probably be looking to reestablish in the coming week. We are oversold and once again could have a SPRING, in an uptrend buying opportunity.
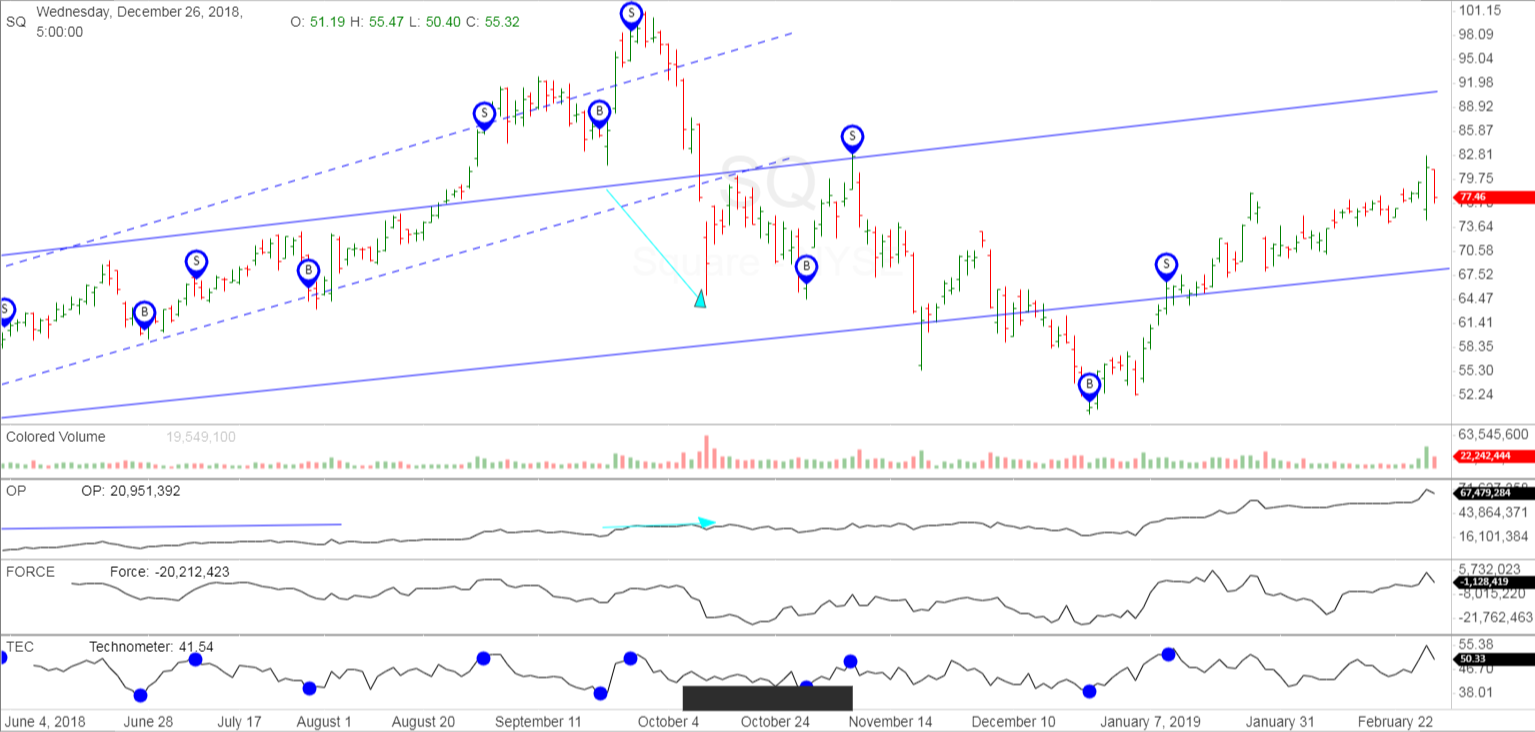
Square (SQ) has traded sideways, and we are watching to buy a pullback. Thursdays action looks bearish and we had a major overbought reading on the Technometer, and look to trade lower in the week ahead.
Caterpillar looks lower in the coming week. This chart does not look good.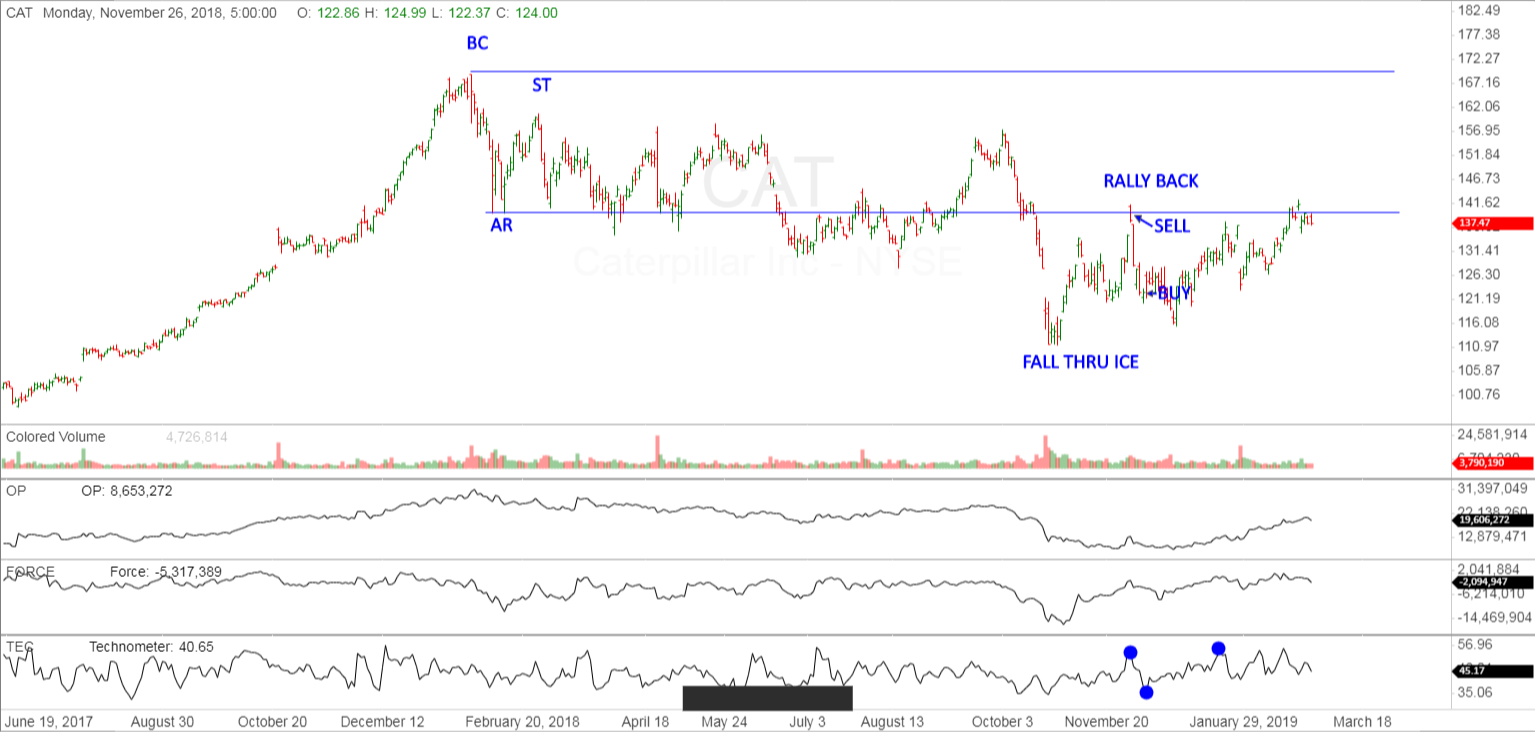
IMPORTANT ANNOUNCEMENT: Our “Pulse of The Market” charting software for Cryptocurrrencies is now working. This software has consolidated volume for the Crypto’s which is utmost important when applying Wyckoff Technical Analysis. We are showing this software in use on our social media sites.
Due to the demand for Bitcoin/Cryptocurrency information and trading knowledge, we released a Cryptocurrency and Wyckoff Trading Course at our site, LearnCrypto.io This course is being offered at an affordable $299.99. We have had 948 students enroll since its launch on June 22, 2017. On June 28th we added lessons detailing the OP, Force, and Technometer and how to use these Wyckoff Tools for analysis.
If you are interested in Wyckoff stock chart analysis as well as Crptocurrency, search “Learn Crypto / Wyckoff SMI” or click this link https://www.youtube.com/channel/UCDxK2PwEDvoaHZgjPV_WgcA
Please subscribe and click the bell to be notified of our upcoming broadcasts.
Our current schedule is Monday-Thursday approximately 6:30 p.m. CST, and they usually last approximately one hour. We will also broadcast at additional random times since we want to satisfy our international subscribers as well.
If you would also like to follow us on twitter for news and trade ideas, follow “LearnCryptoShow”, or “WyckoffonCrypto”. We have given numerous profitable trades to our subscribers on the Youtube channel, as well as Twitter.
Good Trading,
Todd Butterfield

Responses