The Wyckoff Wave trying to correct back into the range….
The Wyckoff Wave traded higher for the week. Volume was slightly higher than norm, but equaling last weeks.
The O-P was up slightly for the week as well, but still trading heavy.
The Force Index was also down slightly for the week and went to new lows for the move.
The Technometer is trading in a neutral condition after registering oversold at least weeks lows.

We have been discussing over and over, how the OP has not acted well on the recent rallies. This week saw the OP continuing to trade heavy as can be seen on the intraday chart.

The one year daily chart shows the Wyckoff Wave trading in various uptrends on a short and intermediate term basis. Last weeks rally got the Wave once again to its overbought line of the small dotted blue uptrend. It met resistance as expected and corrected as the week ended.
The Wave is still trading at the purple resistance line of the trading range as marked. It is not accelerating here so still could form an upthrust if more heavy selling comes in this week. So far the action in the Wyckoff Wave has stayed bullish.
We still believe it is a test of the resistance, or a possible upthrust, and we will see more sideways/down action, and not acceleration to the upside. The Technometer is neutral and should allow more selling this week.

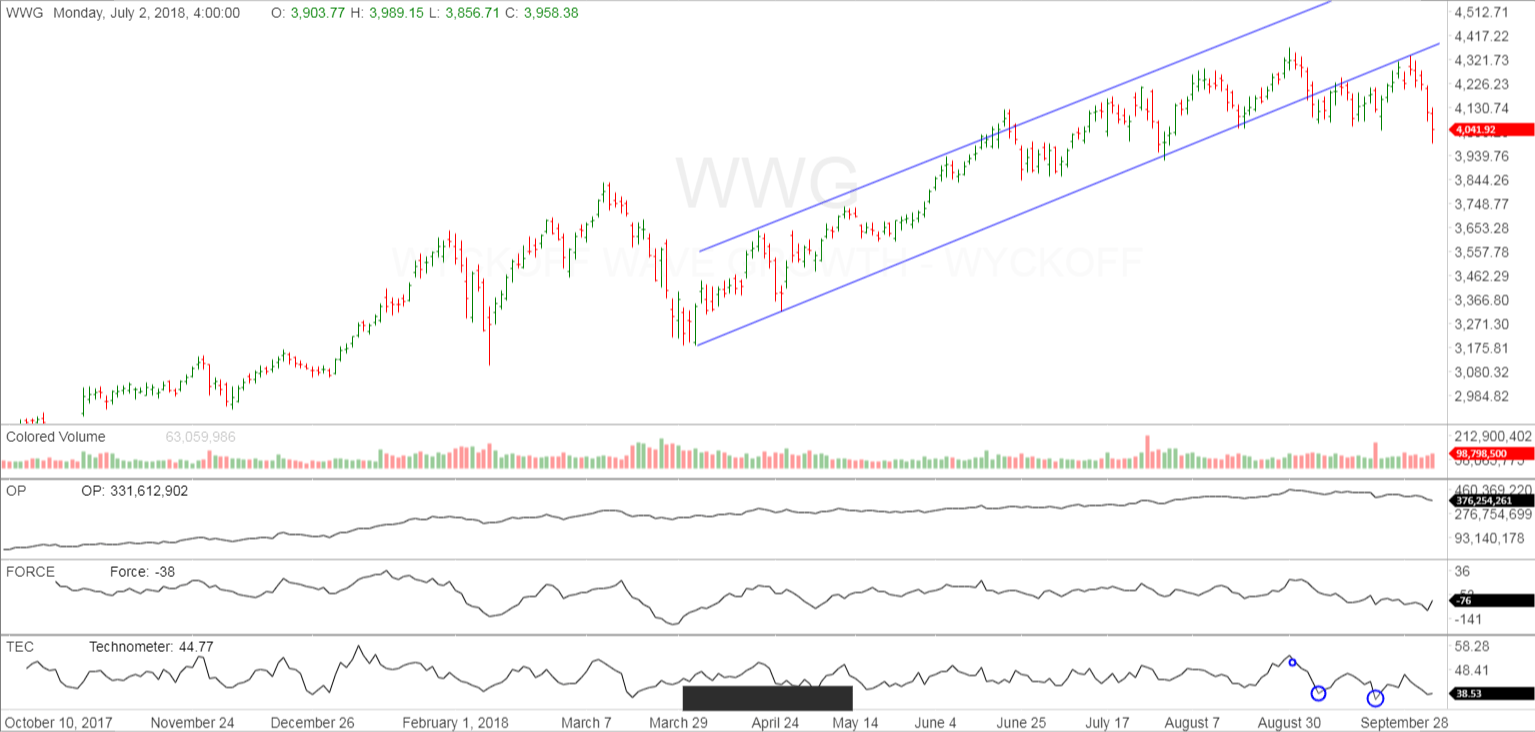
The Wyckoff Wave Growth Index (WWG), which trades more like the Nasdaq, traded sharply lower for the week as expected. The WWG had broken its blue uptrend, then tested it, and we was looking for further downside action.
The Technometer is once again nearing oversold, but that would be expected after the sharp selling and the penetration of the recent support levels. We might get a bounce here or sideways action, but it still appears we have lower prices ahead.
Continue to hold shorts and trail stops.
The bond market traded sharply lower for the week. The Technometer deep oversold condition has not helped this index bounce at all. We had recommended staying short as this is what happens in a solid downtrend.
Those with short term time horizons, might want to cover shorts at these levels, and look for some type of corrective bounce. Those with longer term horizons, should stay short and trail stops.

IMPORTANT ANNOUNCEMENT: Our “Pulse of The Market” charting software for Cryptocurrrencies is now working. This software has consolidated volume for the Crypto’s which is utmost important when applying Wyckoff Technical Analysis. We are showing this software in use on our social media sites.
Due to the demand for Bitcoin/Cryptocurrency information and trading knowledge, we released a Cryptocurrency and Wyckoff Trading Course at our site, LearnCrypto.io This course is being offered at an affordable $299.99. We have had 941 students enroll since its launch on June 22, 2017. On June 28th we added lessons detailing the OP, Force, and Technometer and how to use these Wyckoff Tools for analysis.
If you are interested in Wyckoff stock chart analysis as well as Crptocurrency, search “Learn Crypto / Wyckoff SMI” or click this link https://www.youtube.com/channel/UCDxK2PwEDvoaHZgjPV_WgcA
Please subscribe and click the bell to be notified of our upcoming broadcasts.
Our current schedule is Monday-Thursday approximately 6:30 p.m. CST, and they usually last approximately one hour. We will also broadcast at additional random times since we want to satisfy our international subscribers as well.
If you would also like to follow us on twitter for news and trade ideas, follow “LearnCryptoShow”, or “WyckoffonCrypto”. We have given numerous profitable trades to our subscribers on the Youtube channel, as well as Twitter.
Good Trading,
Todd Butterfield

Responses