Categories: Model Stock Portfolio, Trade Updates
Tags: IBM
Related Articles
Does The News Move Stocks?
Click Here For Wyckoff Wave Chart 04-19-13 A week ago Friday (the day after point B), the Wyckoff Wave put in a lack of demand…
We are going short IBM at the market, current price $146.57
IBM is trading much weaker than the Wyckoff Wave, and appears ready to probe the downside once again in its long downtrend. The Wyckoff Wave…
We want to enter short positions at the market in IBM and BMY.
IBM continues to make lower highs and we think that last weeks rally was a correction of the recent decline from $157. We would enter…
Take a Rest?
Click Here For Wyckoff Wave Chart 06-27-11 Our last post ended with the Wyckoff Wave at point Y. The Wave was in an overbought position…
Sell Short IBM at the market, current price $146.05. Buy Stop at $150.55.
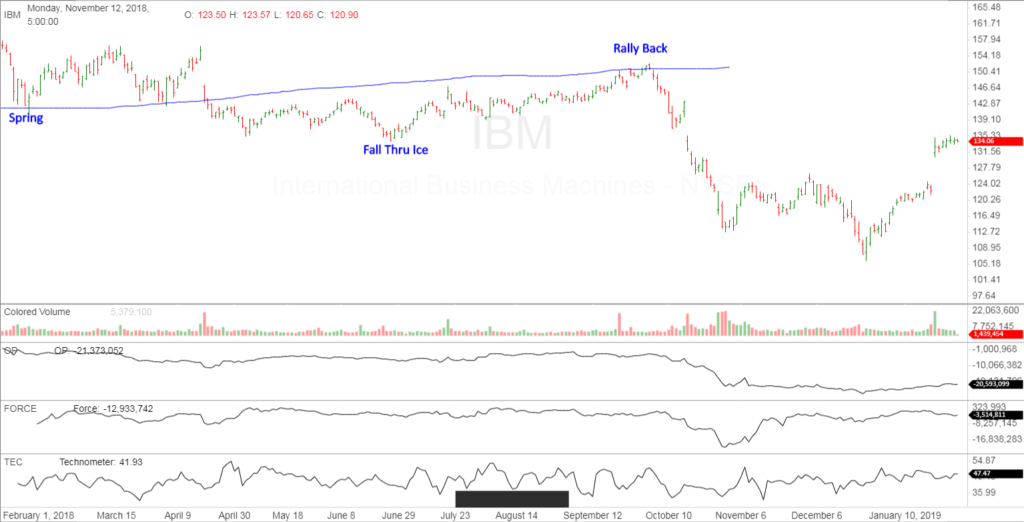
IBM’s one year daily chart is below. Chart does not look well and we just had what appears a Fall Thru the Ice, and a…


Responses