Wyckoff Wave More Downside?
The Wyckoff Wave was down for the week. Volume was at low levels.
The O-P was down for the week.
The Force Index was up for the week.
The Technometer is near neutral.
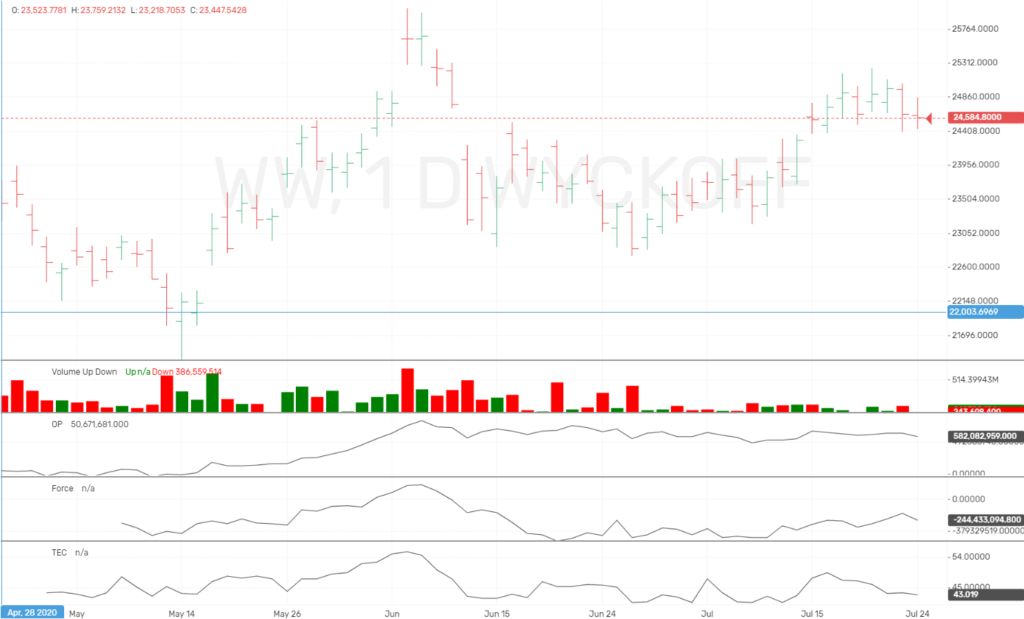
The OP and Wave are somewhat in unison.
The Wyckoff Wave was up slightly early in the week, then succumbed to selling pressure Thursday/Friday to end the week lower as we were wanting. Volume was at low levels.
We have been expecting lower prices since our sells of Jun 3 and 5th. Not much upside progress has been made by the Wave, but it has yet to turn down again in earnest. We are still looking for a further correction from these levels.
The Technometer was at overbought levels but now back to slightly below neutral.
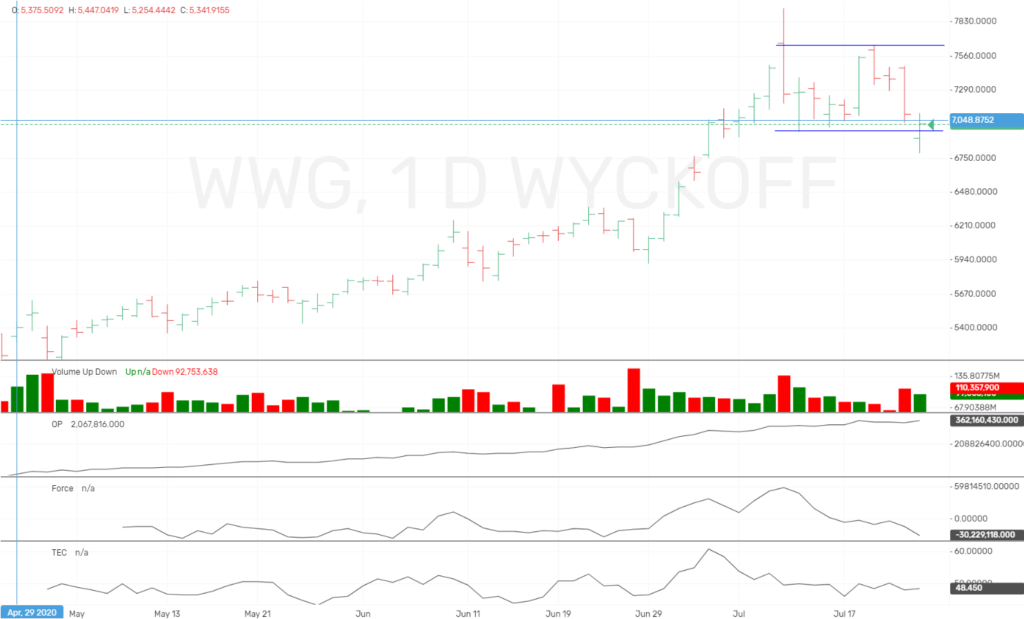
The Wyckoff Wave Growth Index (WWG) was down slightly for the week, after Mondays strong rally. Friday we could have experienced a spring in an uptrend which could mean another rally to resistance. We will watch this Monday….
The Technometer is near overbought and will allow more downside if Friday’s rally is retraced.
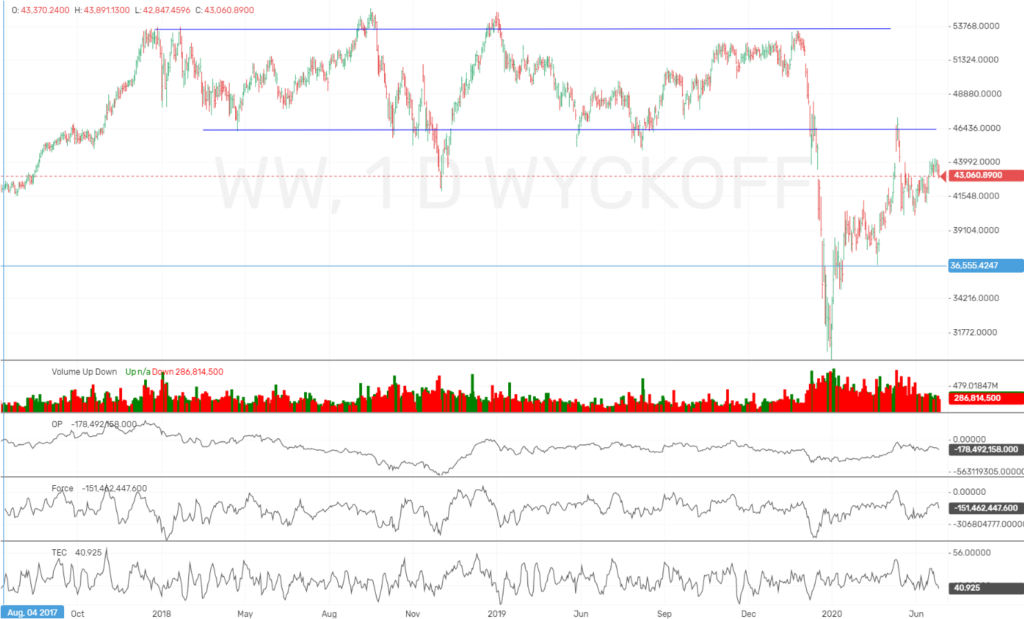
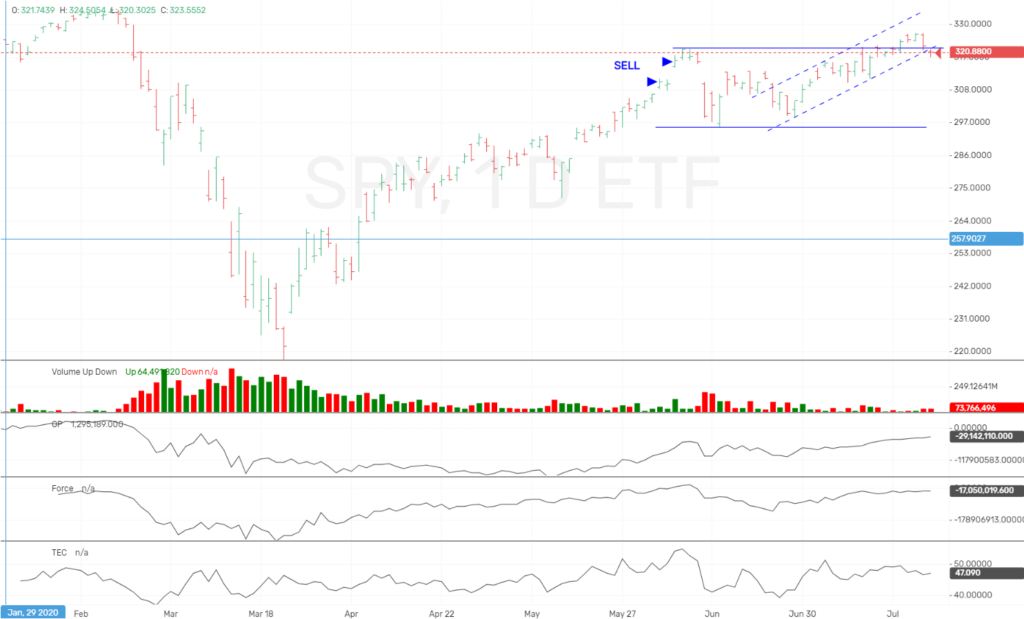
The SPY finished the week lower as well. We have been looking for an upthrust and if volume comes in to the downside we could have just experienced one as shown by the solid blue trading range.
The Technometer is now near neutral we would like to see continued strong selling here for the bearish view. We are short from June 3rd and 5th as shown by the blue arrows. The dashed uptrend line has also been broken so lets see what now happens.
If you want more current up to the minute updates, please join our ProTraders/Private Discord. Join Here
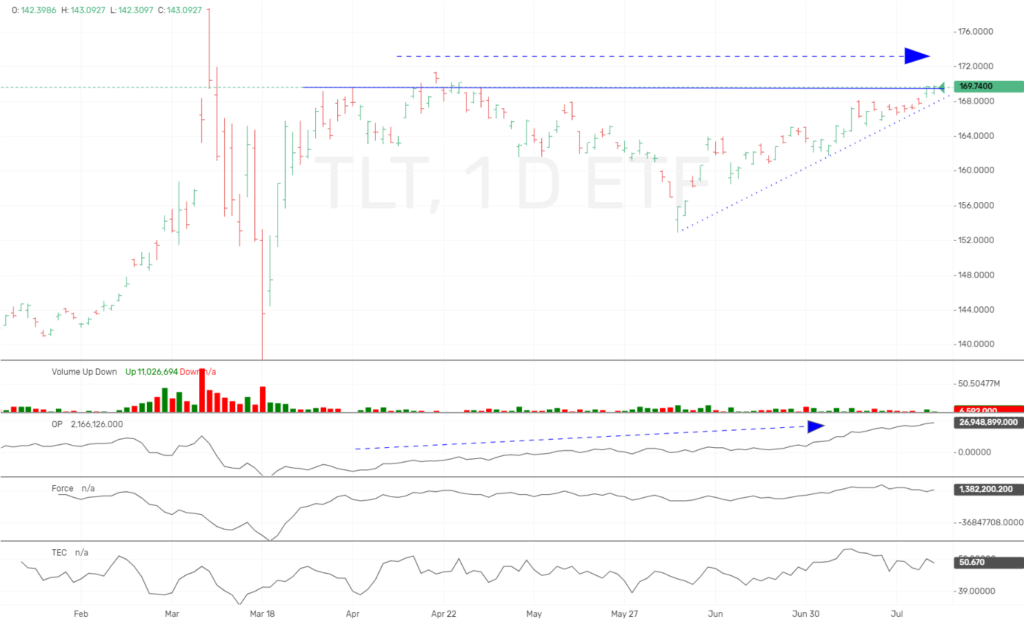
The bond market closed slightly higher once again for the week as expected.
Our Technometer has been at overbought levels but did come off of extreme overbought during the week. We had the sideways consolidation and was looking for a breakout to the upside like we got.
You can see as we have marked by the blue arrows, that the OP has went to new highs the last few months while price has not. We think this has bearish longer term implications. We want to be short this market soon, as we are up against previous resistance and could upthrust this area.
For now we expect the TLT to continue to work higher as stocks correct over the short term.
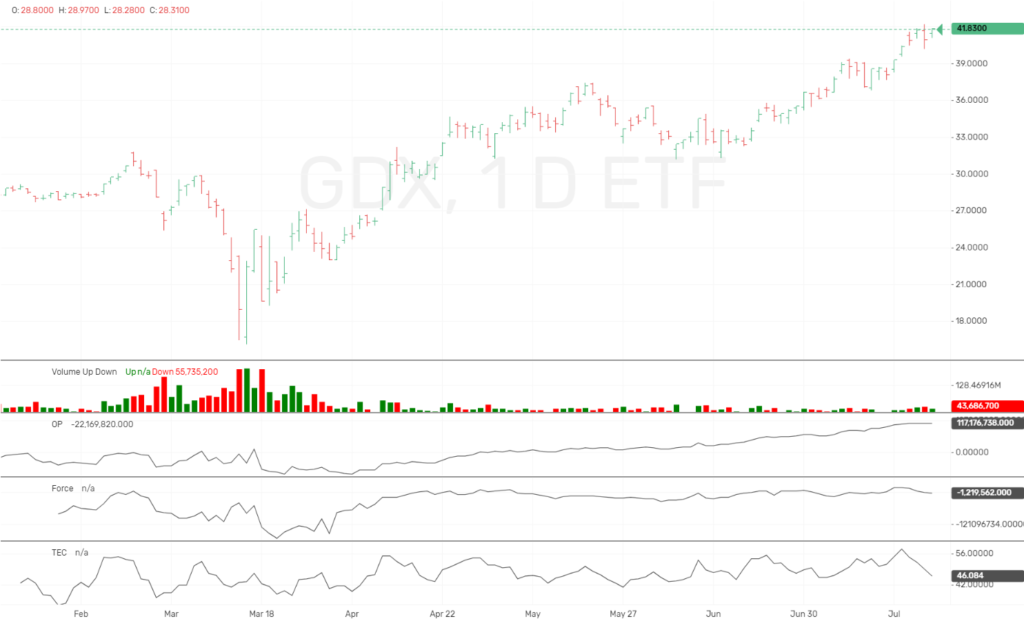
The GDX finished the week higher and extending recent gains.
Our Technometer is at neutral levels, and we are short with losses.
Sentiment is extreme bullish and we would expect a slowing of this rally, and a correction.
Our past overbought Technometers have not lead to any selling, so we might have to reevaluate this trade early in the week if we do not see some selling.
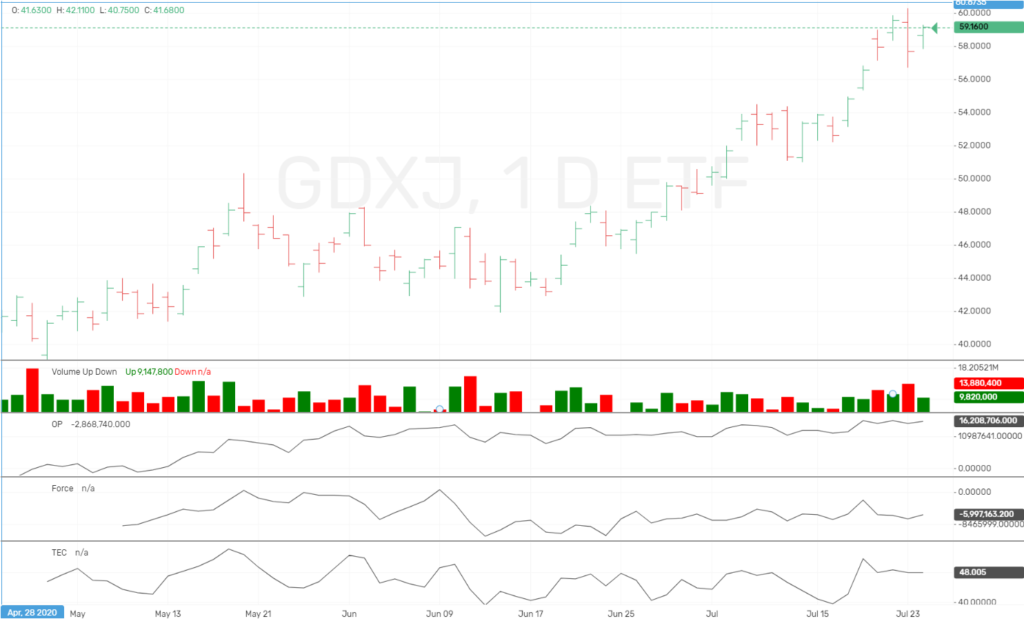
GDXJ
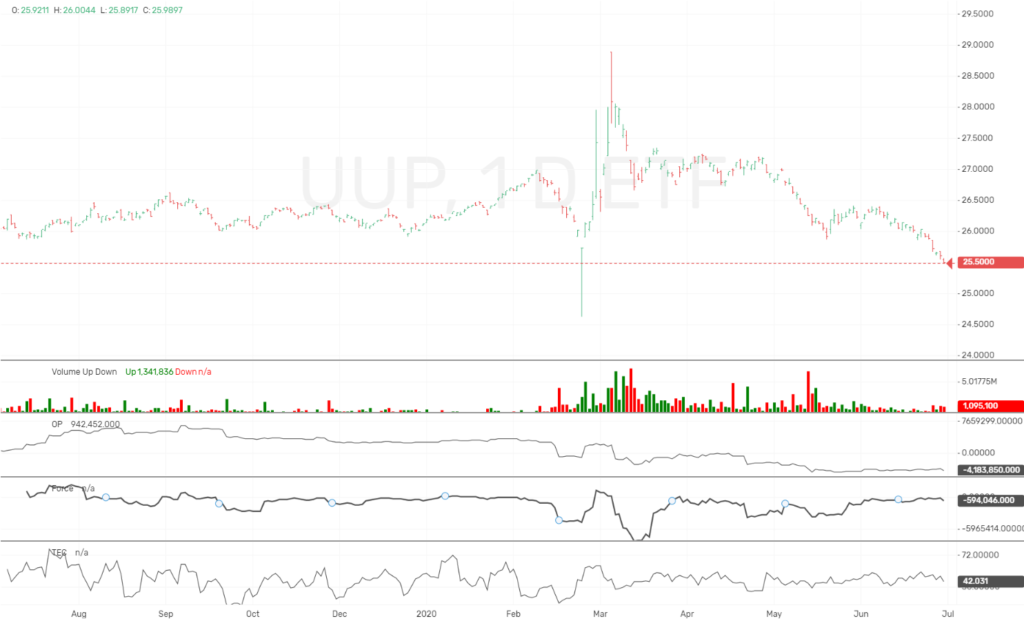
The long dollar ETF, UUP was down sharply for the week.
Volume is very low, and we could be testing the previous shakeout from a few months ago.
Sentiment is extreme bearish and we look for this market to make a low in this area.
IMPORTANT ANNOUNCEMENT:
We have just released a lower cost version of our Unleashed Course, which is an excellent value at $349.99. Click Here
Are new “Pulse of The Market” charting software for Cryptocurrrencies is now showing consolidated volume from over 100+ exchanges. This is utmost important when applying Wyckoff Technical Analysis. We are showing this software in use on our social media sites, and will be launching for subscription in near future.
We have an active Discord channel where we discuss the Crypto markets. We have had huge success and if you trade Bitcoin you might like monthly access at $40 a month. Join Here
Due to the demand for Bitcoin/Cryptocurrency information and trading knowledge, we released a Cryptocurrency and Wyckoff Trading Course at our site, LearnCrypto.io This course is being offered at an affordable $299.99. We have had 1021 students enroll since its launch on June 22, 2017. On June 28th, 2018 we added lessons detailing the OP, Force, and Technometer and how to use these Wyckoff Tools for analysis.
If you are interested in Wyckoff stock chart analysis as well as Cryptocurrency, search “Learn Crypto / Wyckoff SMI” or click this link https://www.youtube.com/channel/UCDxK2PwEDvoaHZgjPV_WgcA
Please subscribe and click the bell to be notified of our upcoming broadcasts.
If you would also like to follow us on twitter for news and trade ideas, follow “WyckoffonStocks”, “LearnCryptoShow”, or “WyckoffonCrypto”. We have given numerous profitable trades to our subscribers on the Youtube channel, as well as Twitter.
Good Trading,
Todd Butterfield

Responses