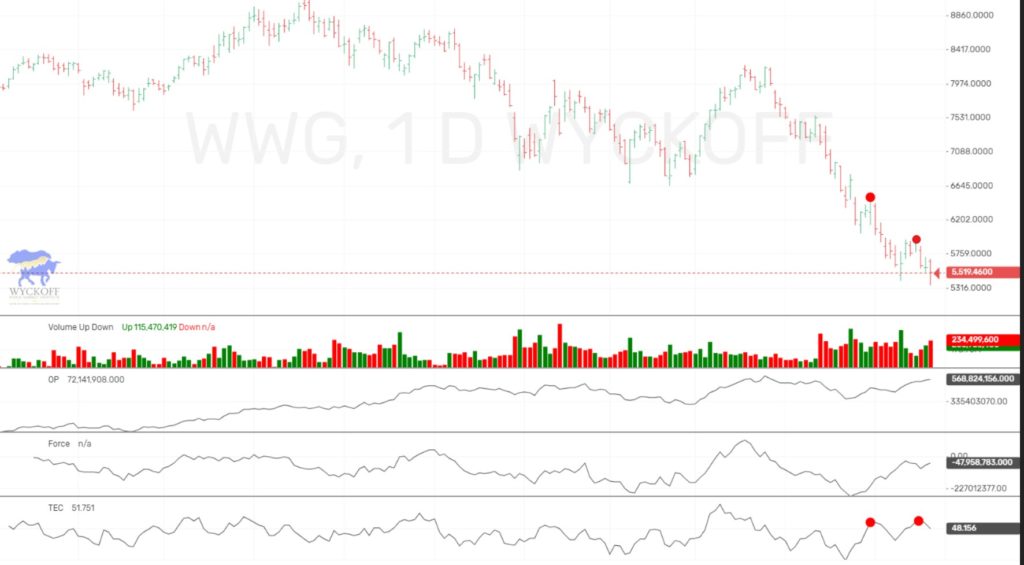
Wyckoff Wave Still Trying To Bounce.
The Wyckoff Wave was up for the week. Volume was slightly lower last week.
The O-P was down slightly for the week.
The Force Index was down for the week.
The Technometer is below neutral.
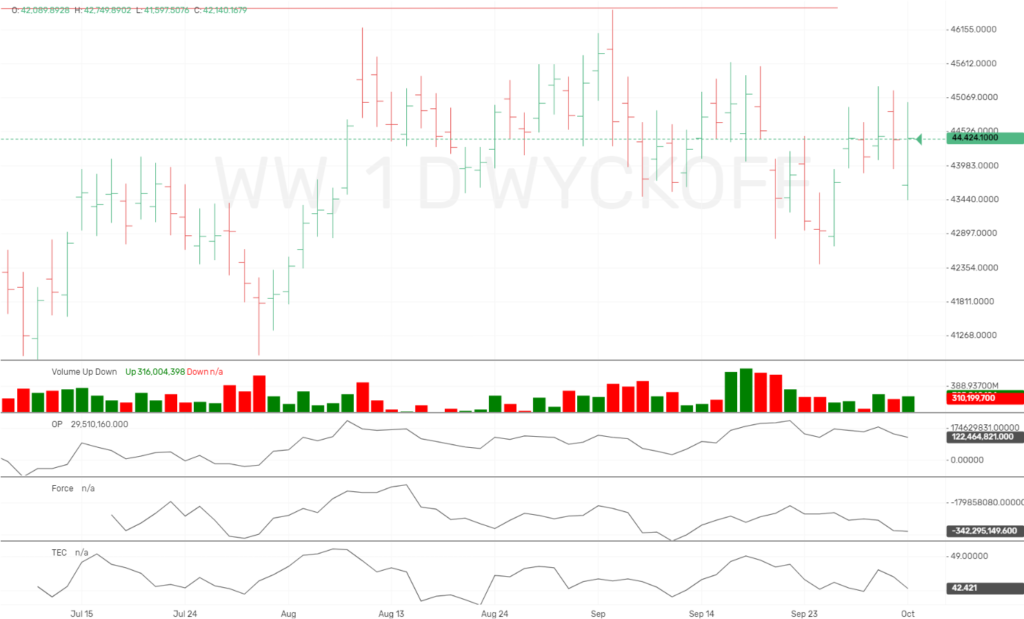
The Optimism Pessimism Index is slightly weaker for the week.
The Wyckoff Wave closed higher for the week as expected. Volume was slightly lower.
The Technometer is below neutral now. We had called for the end of the short term correction at the lows 10 days ago as selling volume was not coming into the market, and we expected a relief rally. We got a slight rally last week and we still expect more.
We would like to see further rally this week and a Technometer returning to near overbought, so we can reenter short positions.
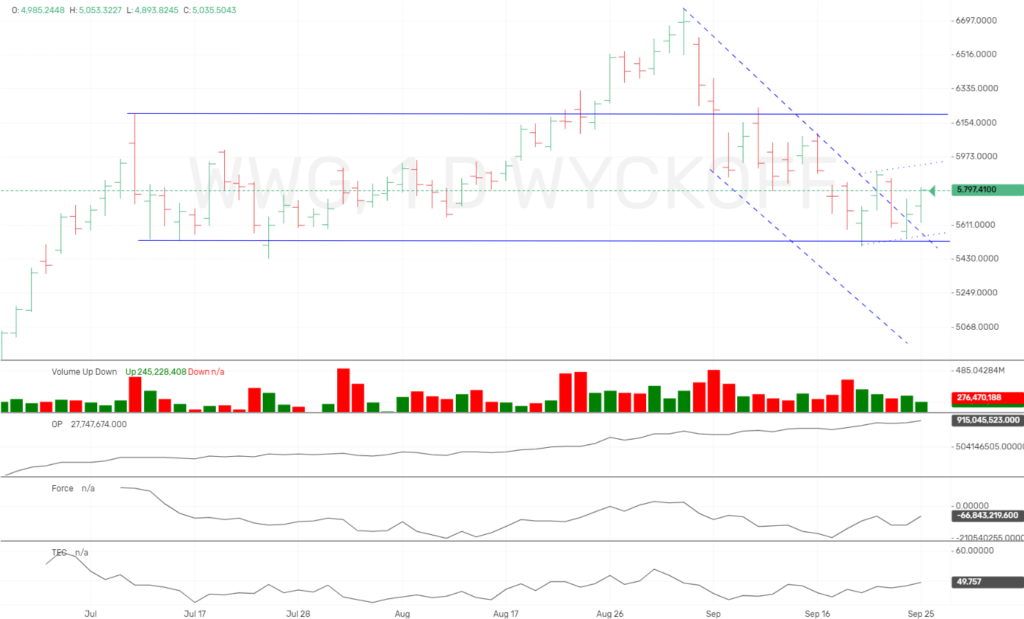
The Wyckoff Wave Growth Index (WWG) was also slightly higher for the week.
Here as well we look for further rally before selling our long positions in MASI and CTAS.
The Technometer is working its way back to neutral/oversold, so lets look for the WWG to catch itself and try a further rally attempt back to the top of the trading range.
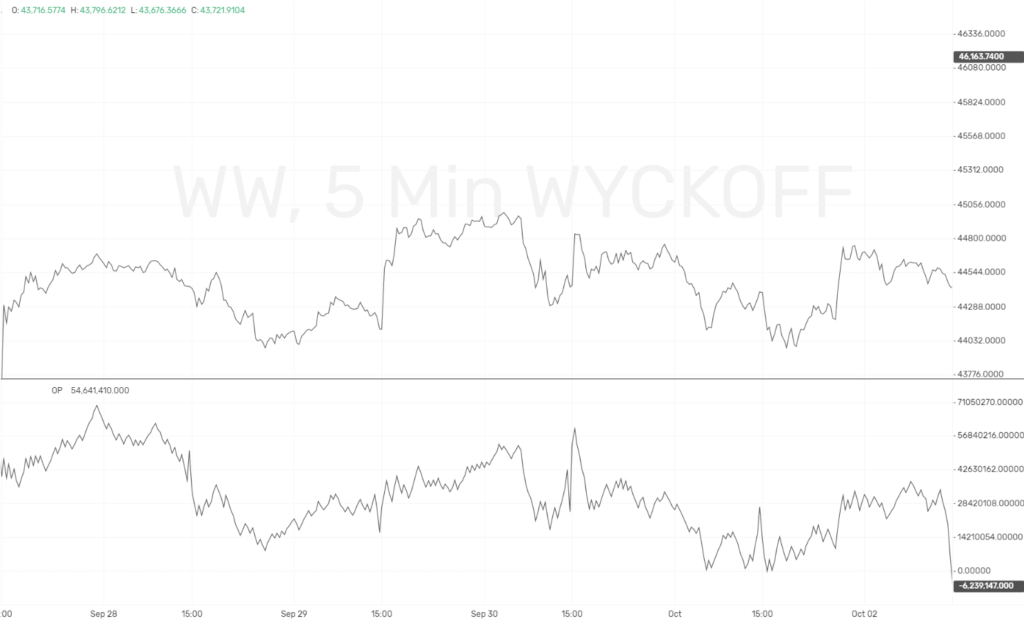
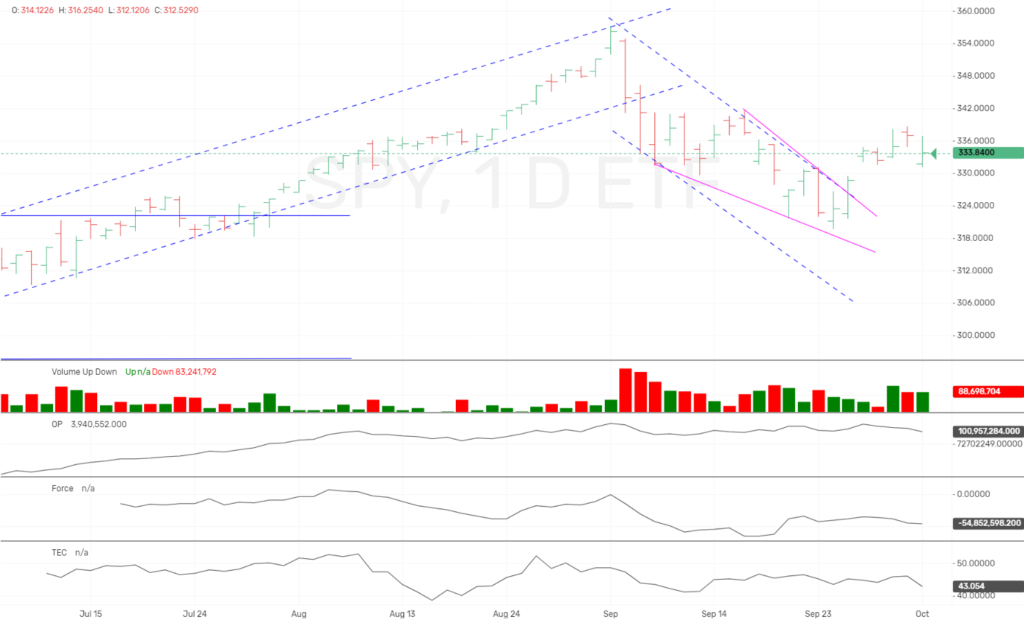
The SPY finished the week higher as expected.
The Technometer is below neutral and we also expect further rally before we turn lower again. We will watch the Technometer and look to be short on an overbought reading. But for now, lets look for higher prices in the coming week.
If you want more current up to the minute updates and trades, please join our ProTraders/Private Discord. Join Here
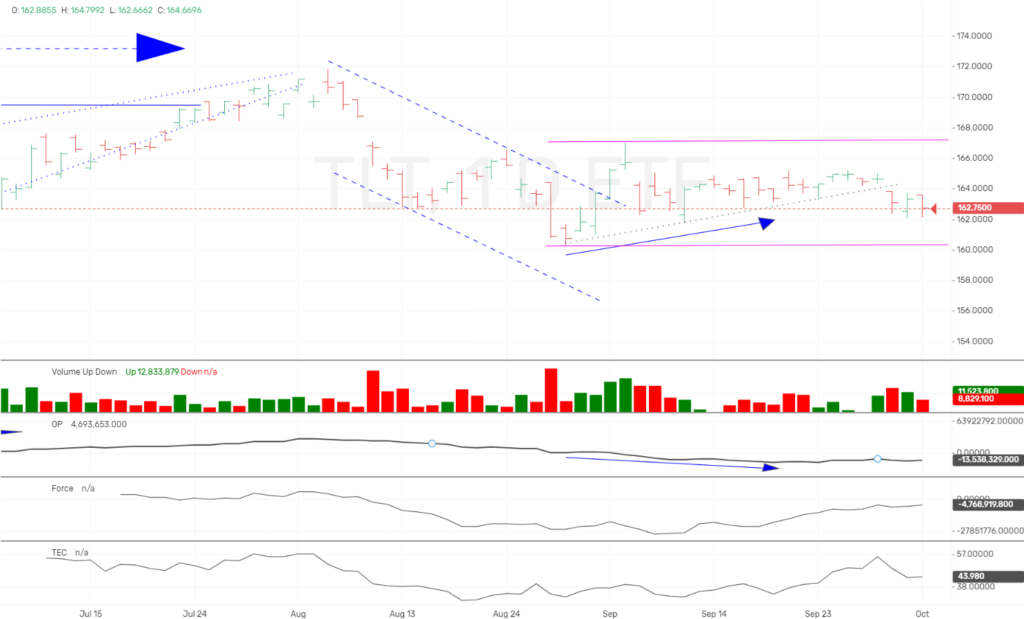
The bond market closed lower last week.
We had an overbought Technometer last week which made us stand aside and look for lower prices. We now have a neutral Technometer but price action looks further bearish to possibly test the bottom of the pink trading range.
An oversold Technometer reading near the support and we might venture into long positions.
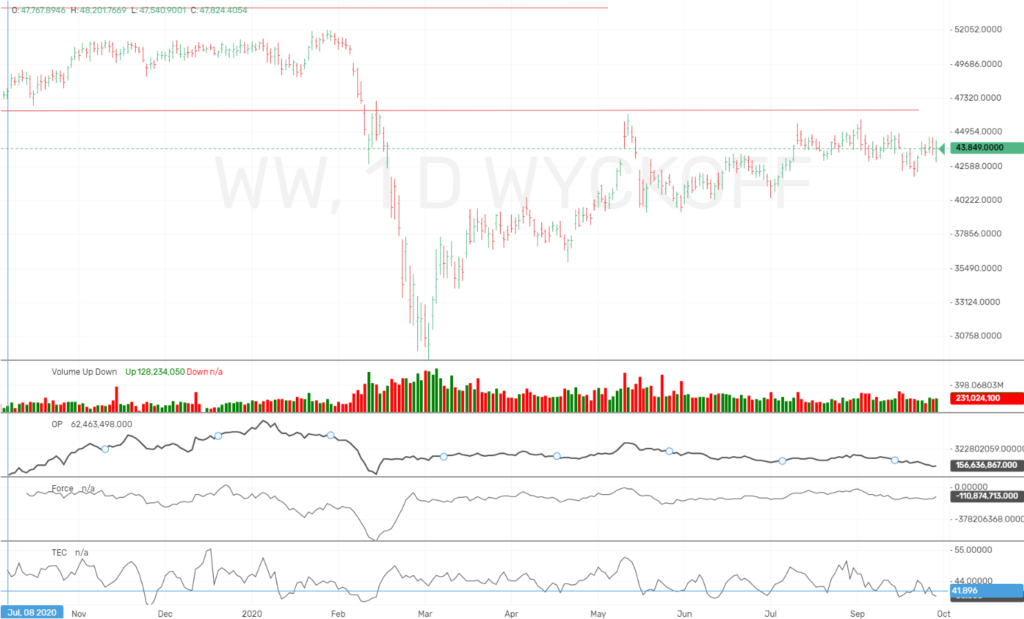
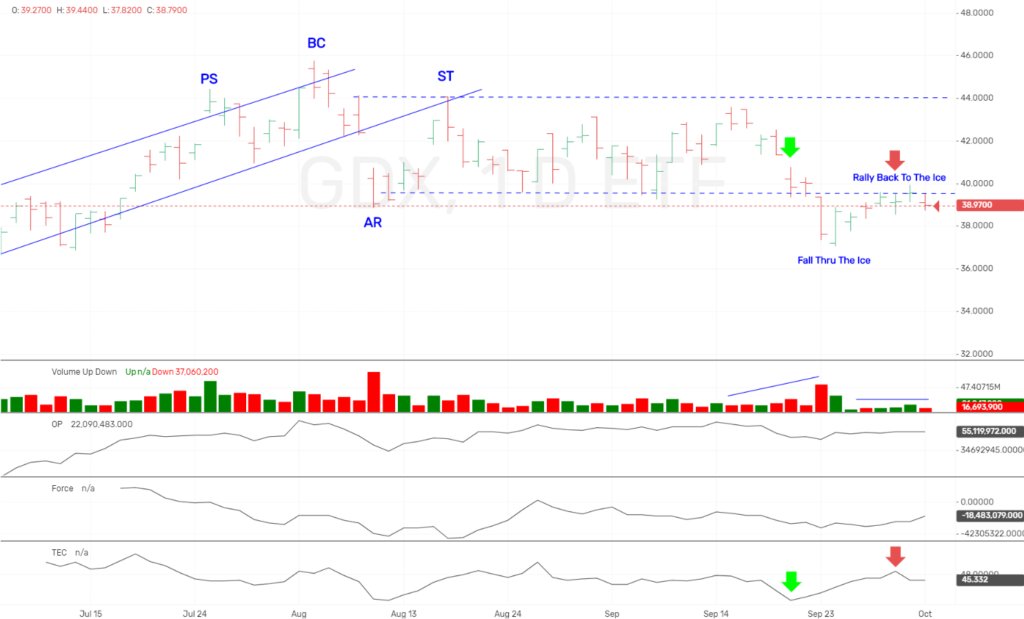
The GDX finished the week slightly higher.
We had covered our shorts in this market at the lows of the Fall Thru The Ice. Last week we did reenter the shorts at the Rally Back To The Ice.
You can see we had an oversold Technometer at the green arrow, and returned to overbought at the red arrow. This type of action while price actually worked slightly lower should be seen as bearish. It also nicely fits in with our Fall Thru The Ice, and Rally Back.
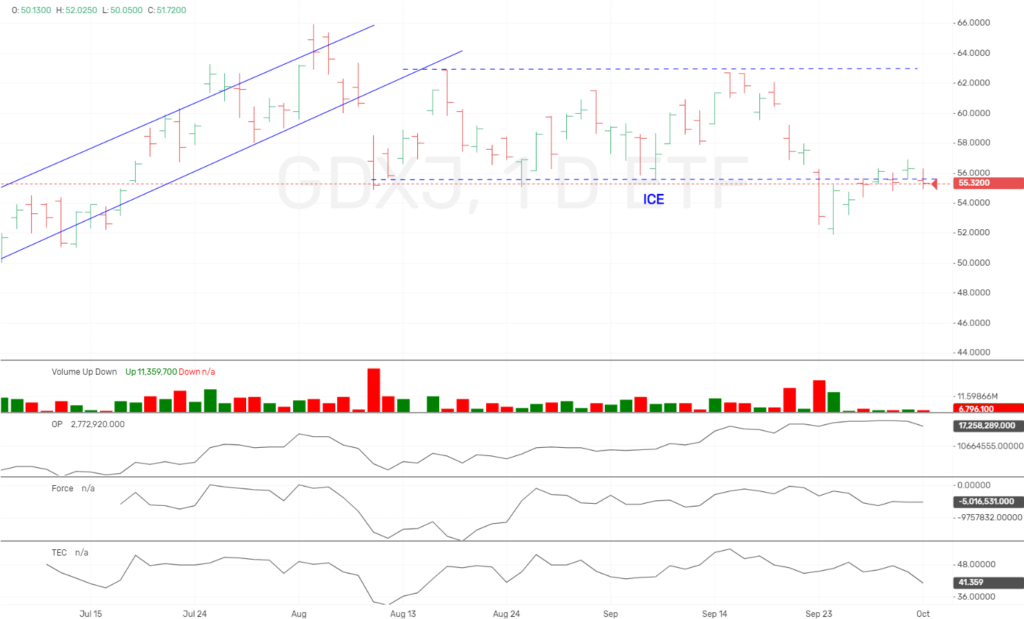
GDXJ Technometer is slightly more friendly but we see lower prices here. We will see how we act as we approach the lows at $52.
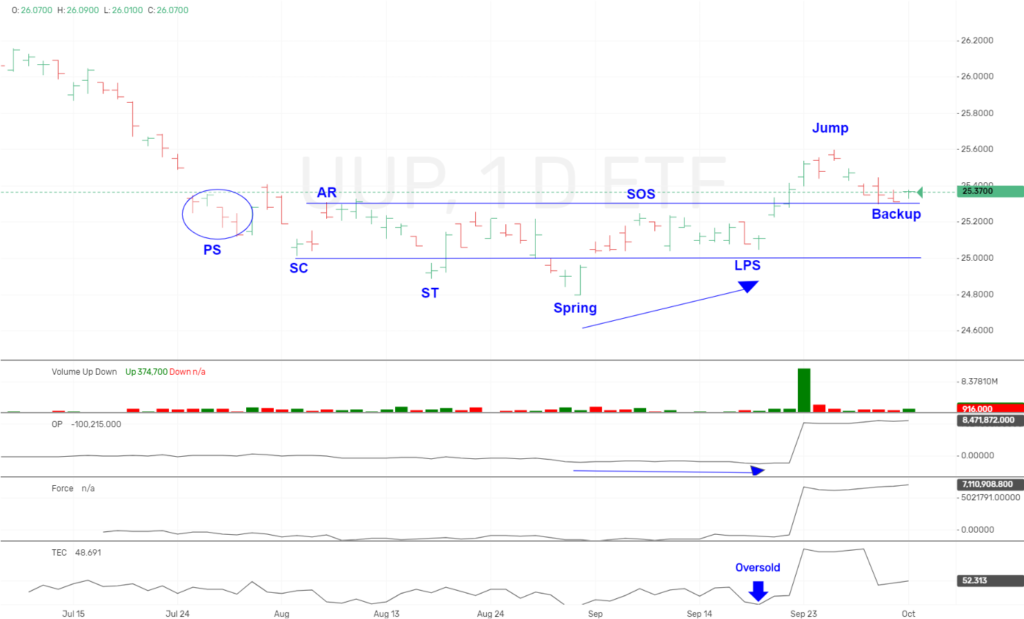
The long dollar ETF, UUP was lower as expected.
We have shown our Wyckoff markings, and we was expecting a Jump of the Creek and then a Backup last week. This action happened right on cue.
If this Backup is complete we should now see continued Markup to the upside. We are long for our ProTraders.
Sentiment was extreme bearish at the recent lows and we expect this market to continue to work higher in the Markup phase.
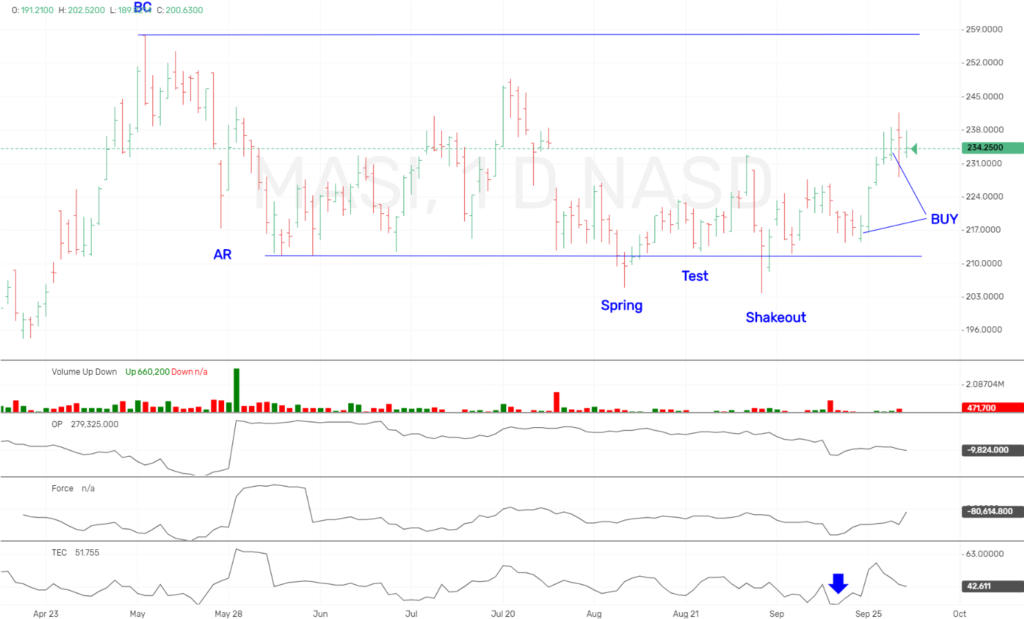
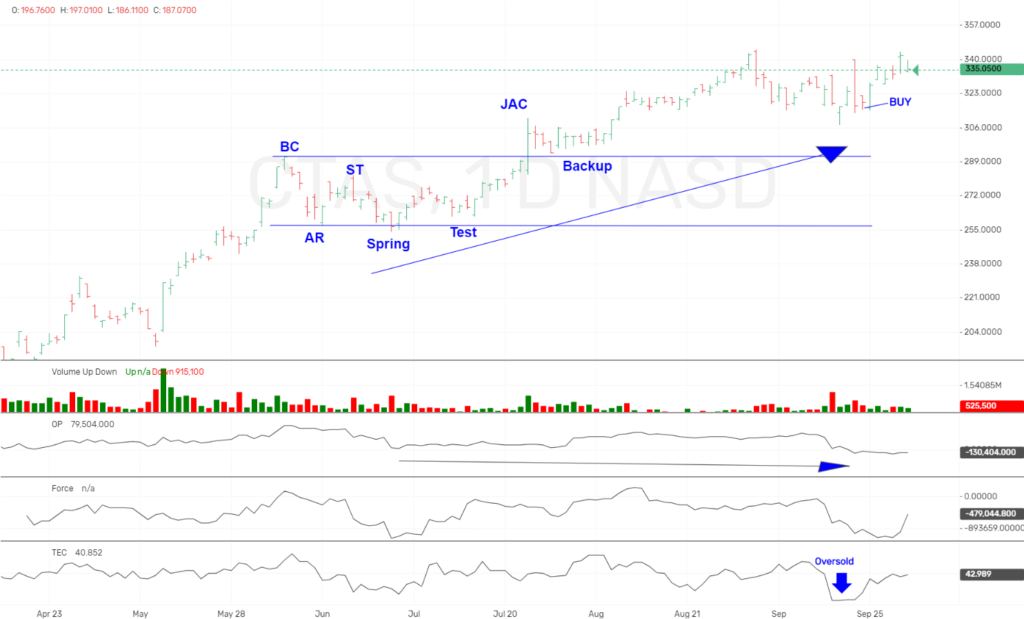
Lets show the charts of the two stocks we bought for our ProTraders/Discord subscribers.
MASI gave us a nice buy and we also added last week as marked on the chart.
CTAS also gave us a nice buy area and we are looking for further rally.
IMPORTANT ANNOUNCEMENT:
We have just released a lower cost version of our Unleashed Course, which is an excellent value at $349.99. Click Here
Are new “Pulse of The Market” charting software for Cryptocurrrencies is now showing consolidated volume from over 100+ exchanges. This is utmost important when applying Wyckoff Technical Analysis. We are showing this software in use on our social media sites, and will be launching for subscription in near future.
We have an active Discord channel where we discuss the Crypto markets. We have had huge success and if you trade Bitcoin you might like monthly access at $40 a month. Join Here
Due to the demand for Bitcoin/Cryptocurrency information and trading knowledge, we released a Cryptocurrency and Wyckoff Trading Course at our site, LearnCrypto.io This course is being offered at an affordable $299.99. We have had 1021 students enroll since its launch on June 22, 2017. On June 28th, 2018 we added lessons detailing the OP, Force, and Technometer and how to use these Wyckoff Tools for analysis.
If you are interested in Wyckoff stock chart analysis as well as Cryptocurrency, search “Learn Crypto / Wyckoff SMI” or click this link https://www.youtube.com/channel/UCDxK2PwEDvoaHZgjPV_WgcA
Please subscribe and click the bell to be notified of our upcoming broadcasts.
If you would also like to follow us on twitter for news and trade ideas, follow “WyckoffonStocks”, “LearnCryptoShow”, or “WyckoffonCrypto”. We have given numerous profitable trades to our subscribers on the Youtube channel, as well as Twitter.
Good Trading,
Todd Butterfield

Responses