We are entering short in SPG, Simon Property Group at the market $215.89
As you know, we think TLT which is the 20 yr Treasury ETF, will continue to work lower, which will keep interest rates rising. We also short VNQ which has begun to act much weaker in the last few weeks. SPG also is a REIT that we think could face headwinds in the weeks ahead. We want to go short at the market…
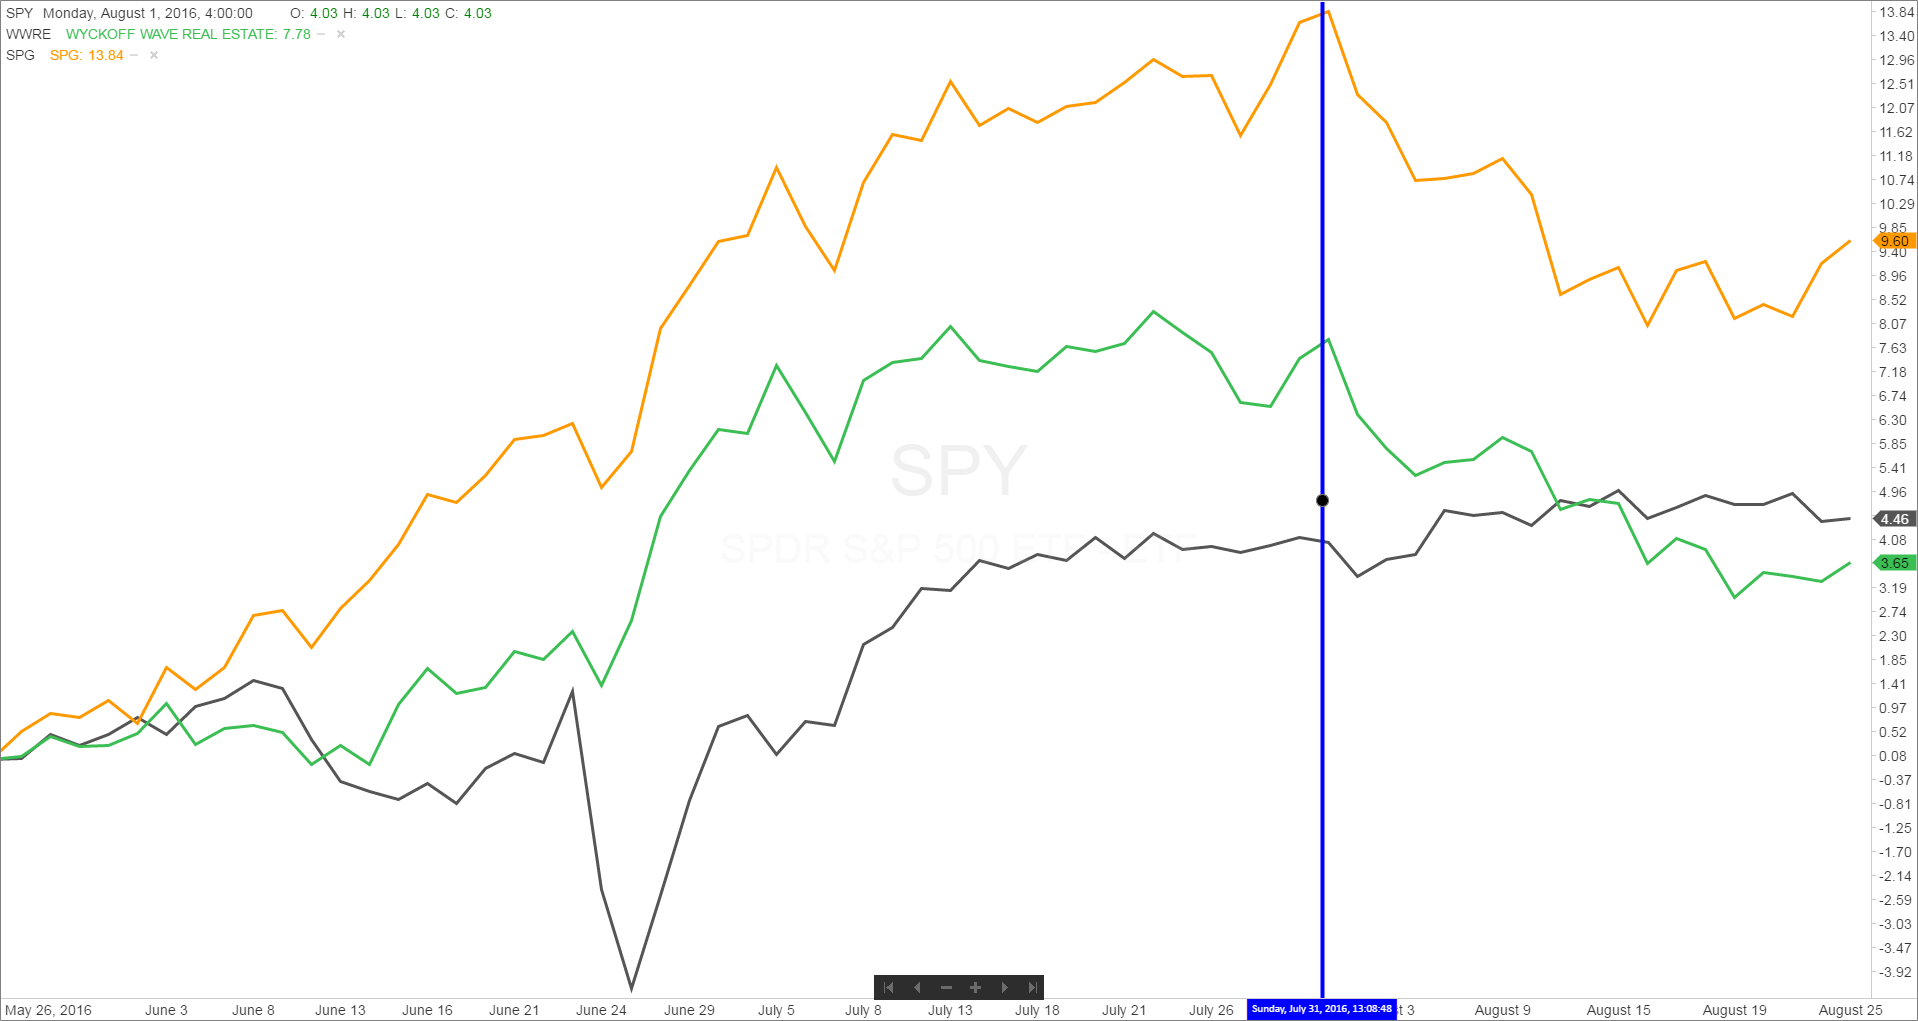
First chart is a “Compare Symbols” chart from our charting software. It is a 3 month chart, but I put in the blue vertical line to show the underperformance of SPG (Simon Property) , and WWRE (Wyckoff Wave Real Estate Sector), against the SPY (S&P 500 ETF). YOu can see that the SPY is slightly higher since July 31st, while SPG and WWRE have been trending lower.
Next chart is the SPG daily chart. You can see on the lower right of the chart we have circled the Technometer reading in Blue. It is at an overbought level of 53.22.
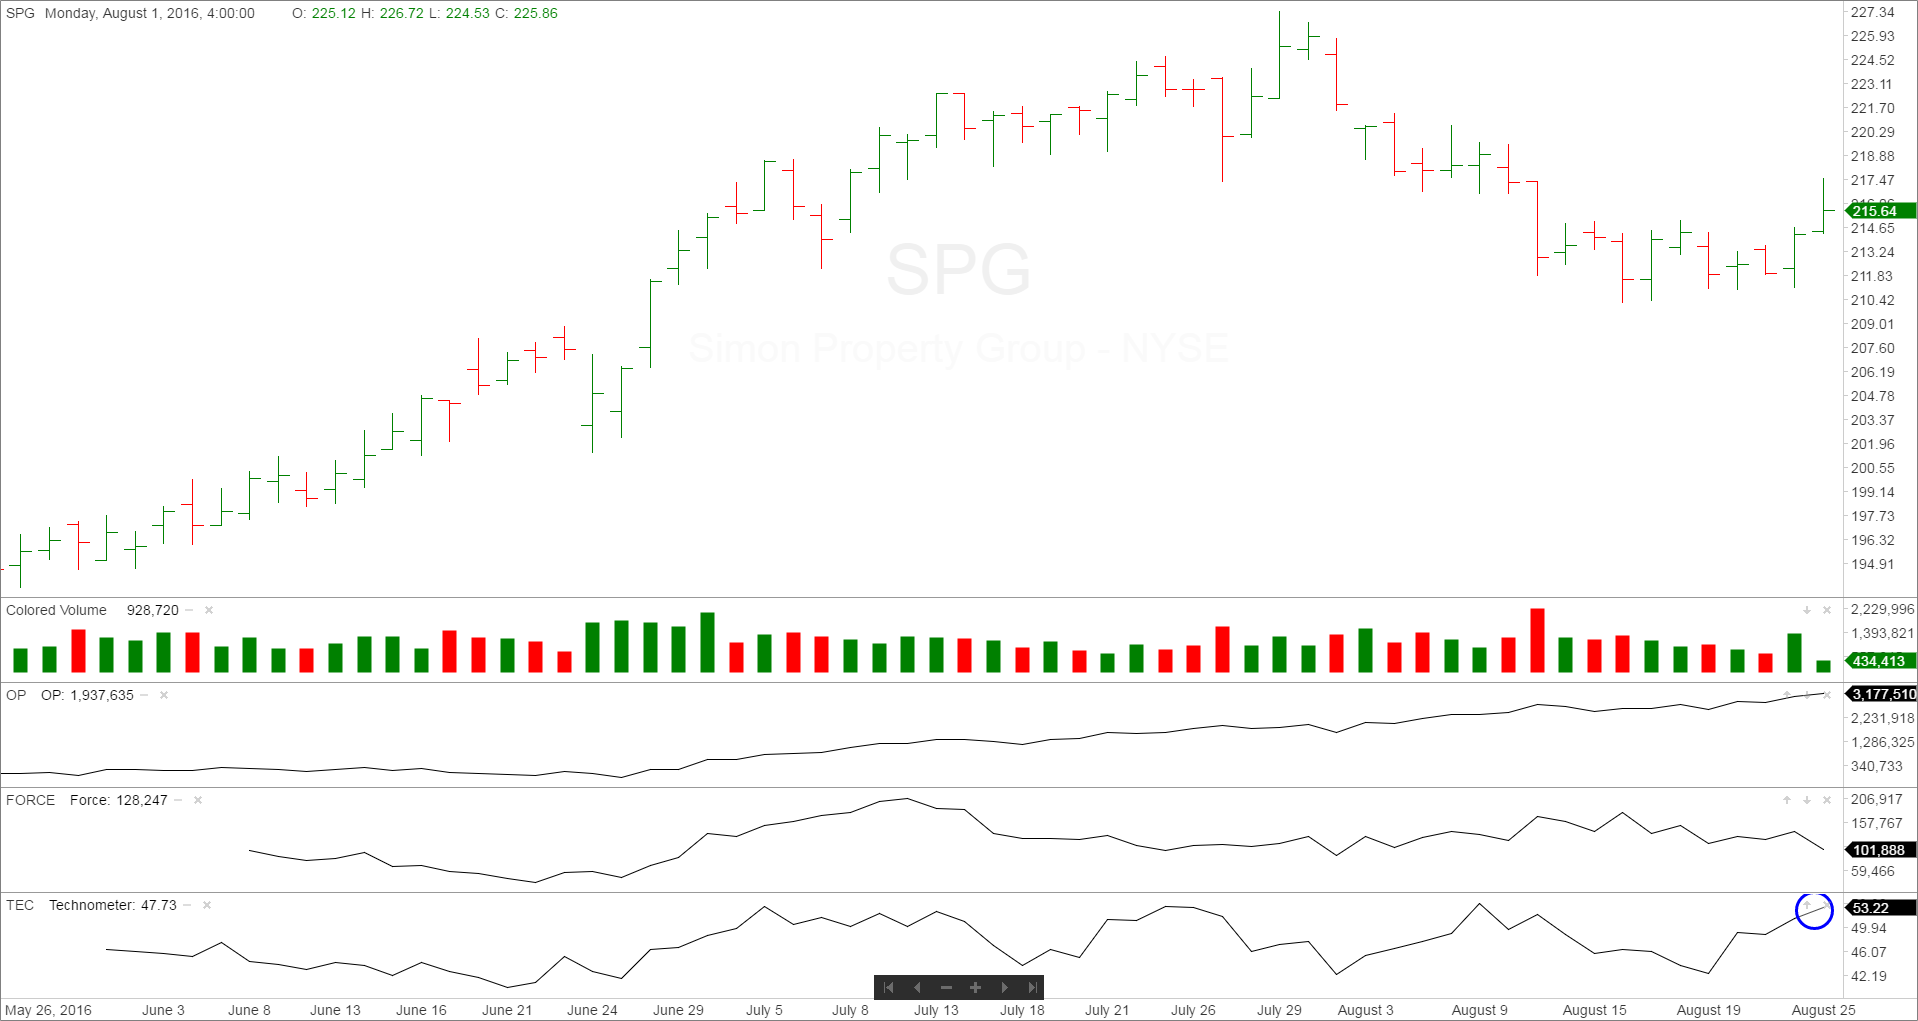
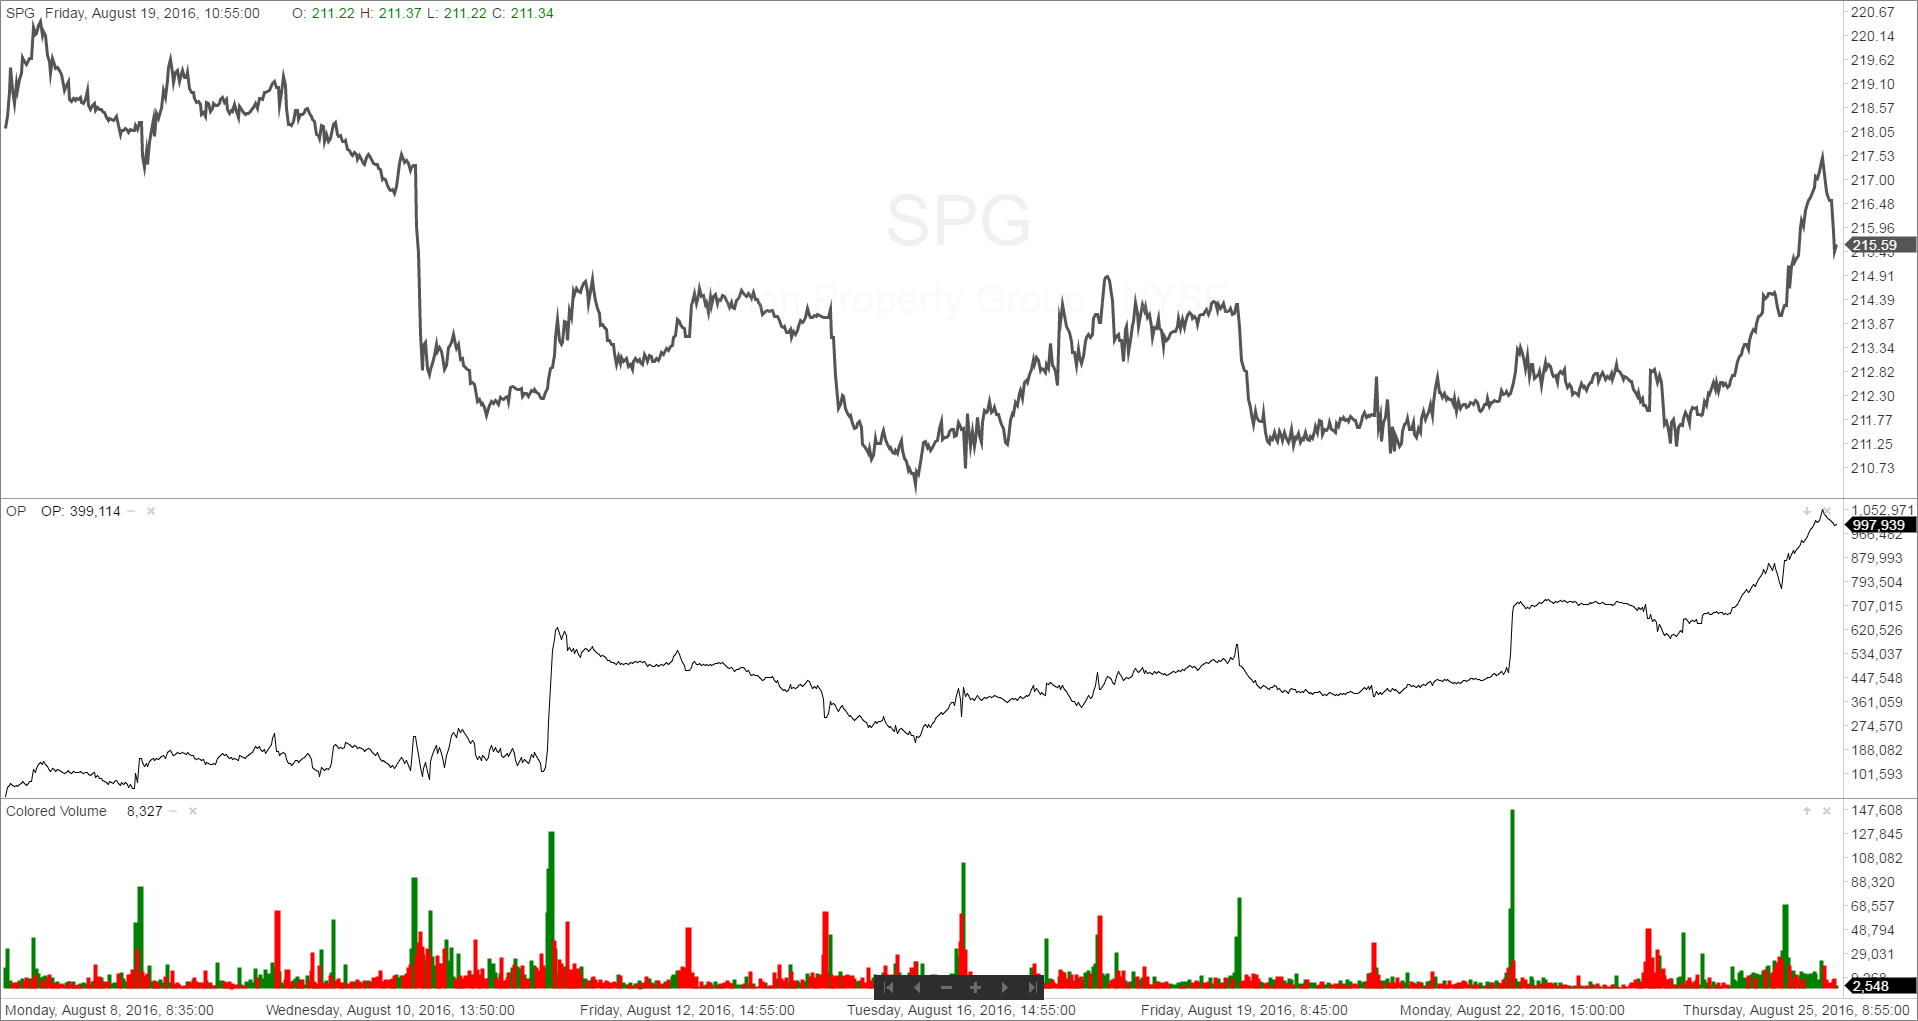
Next chart is the SPG 5 minute intraday chart. It shows the most recent rally in the OP which keeps going to new highs while the price of SPG has been trending down. On the above daily chart, you can also see the OP has been in a sustained uptrend to new highs every day, while the price has been in the downtrend since July 31st.
Please contact us if you have any questions on these trade updates, or our Pulse of the Market charting software.
Thanks, Todd
Responses