Update on our short position in the VNQ (Vanguard REIT ETF)
We have been short VNQ from lower prices, but we have stayed short as we felt like the rally was suspect. The sector has shown short-term relative weakness to the general market. So far the ETF is now looking much more bearish.
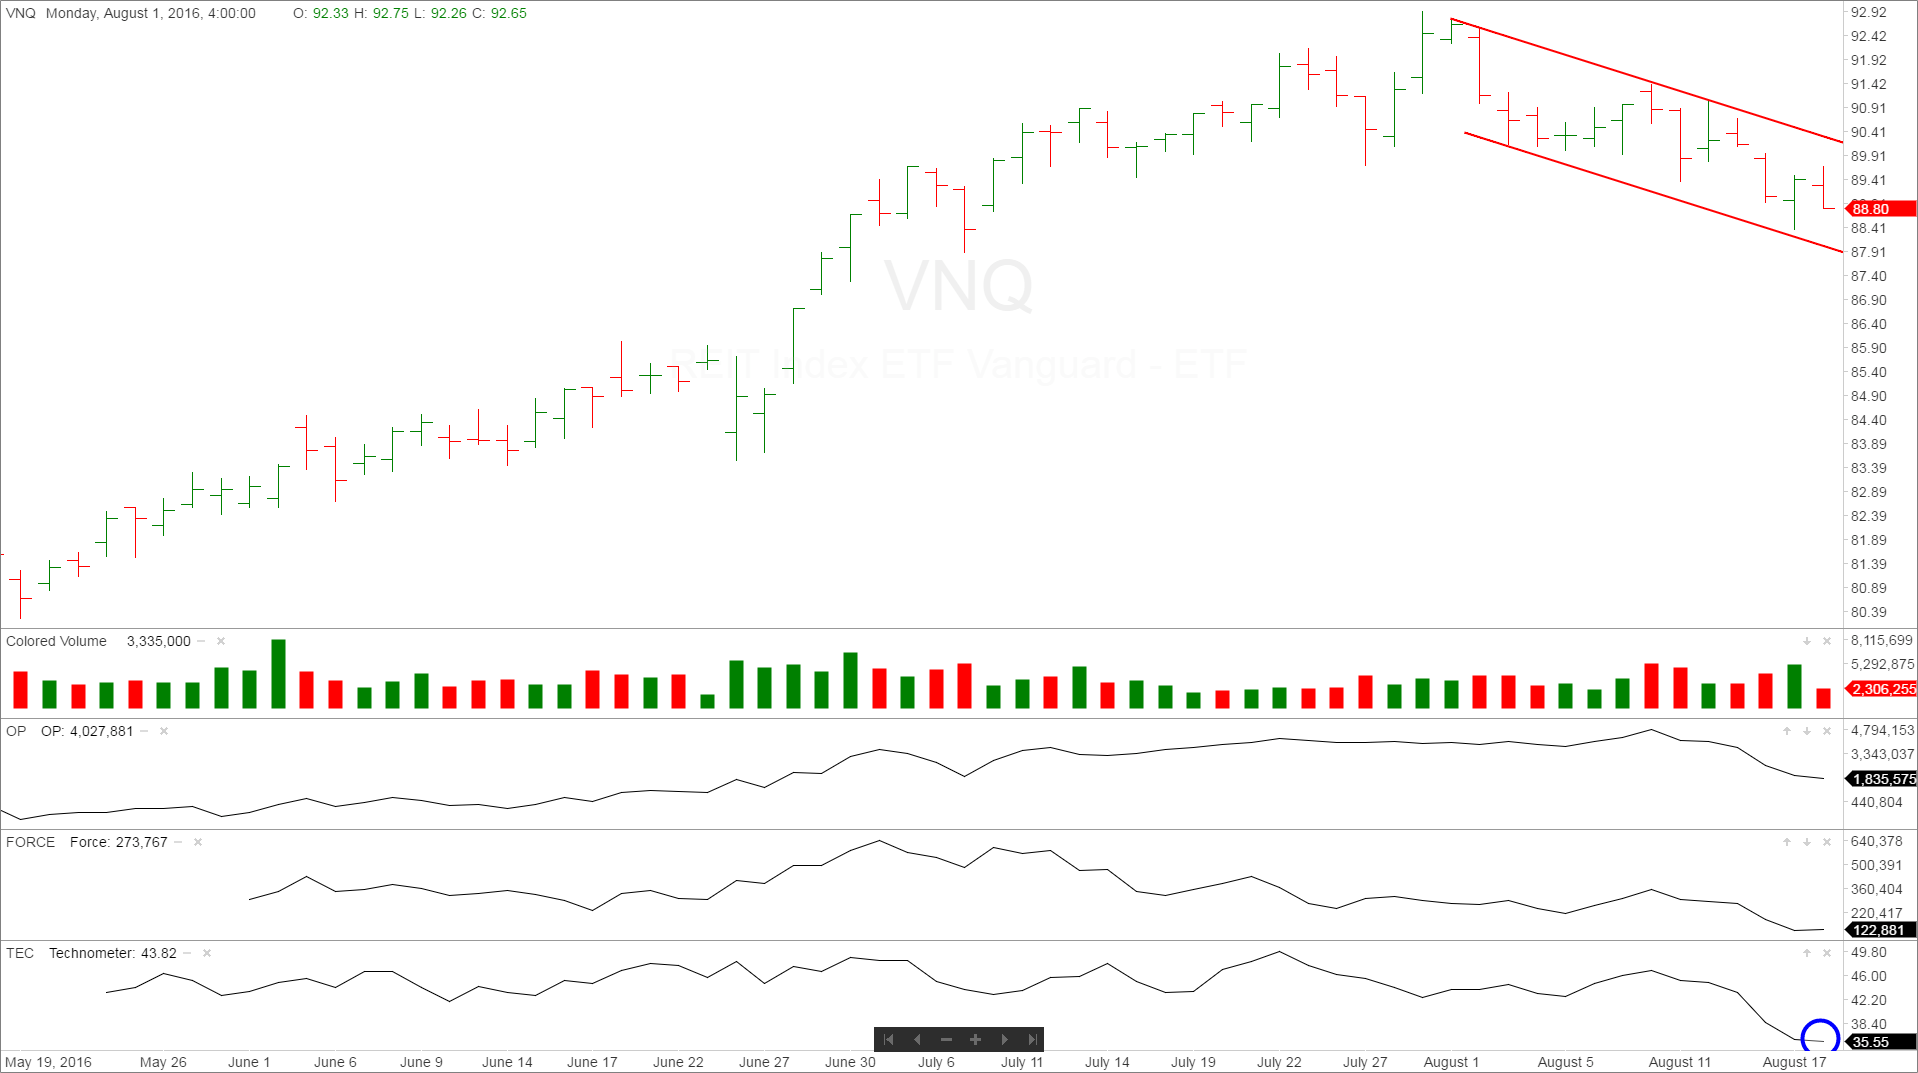
The first chart is the daily chart. As you can see we are in a solid downtrend now for the last three weeks and have broken the recent trading range support. The one issue that could allow for a short term bounce is the extremely oversold Technometer reading. This could allow for a rally back to the ice at the $90-90.25 area.
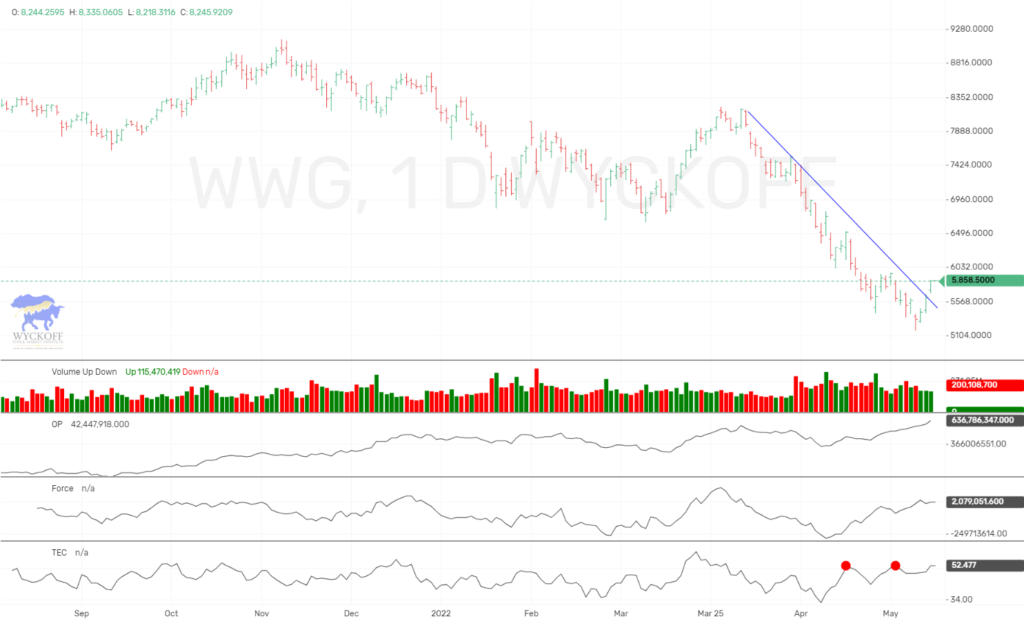
The second chart is the 5 minute intraday chart showing the downtrend as well as the O.P. Index at the bottom.

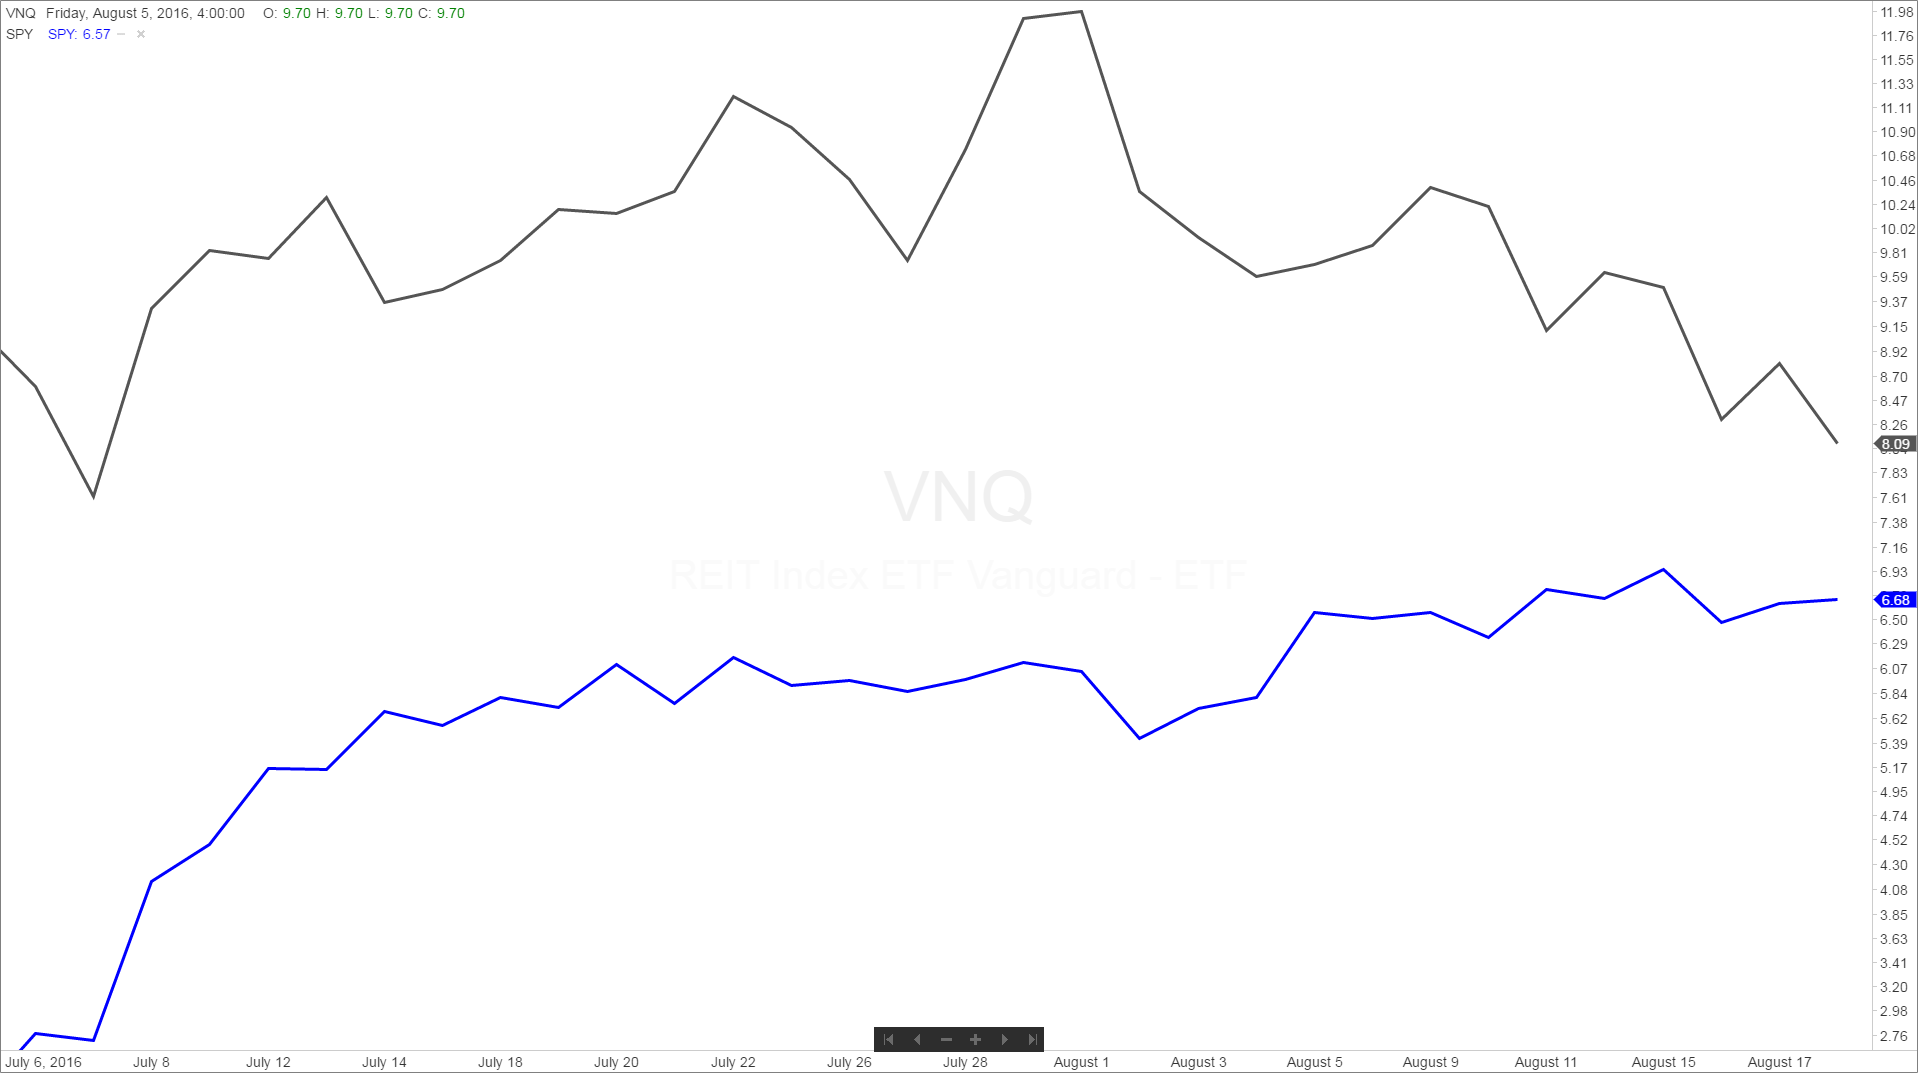
The third chart shows relative weakness of VNQ versus the SPY ETF. You can see that VNQ is lower than it was early July, while the general market as shown by the SPY is still much higher.
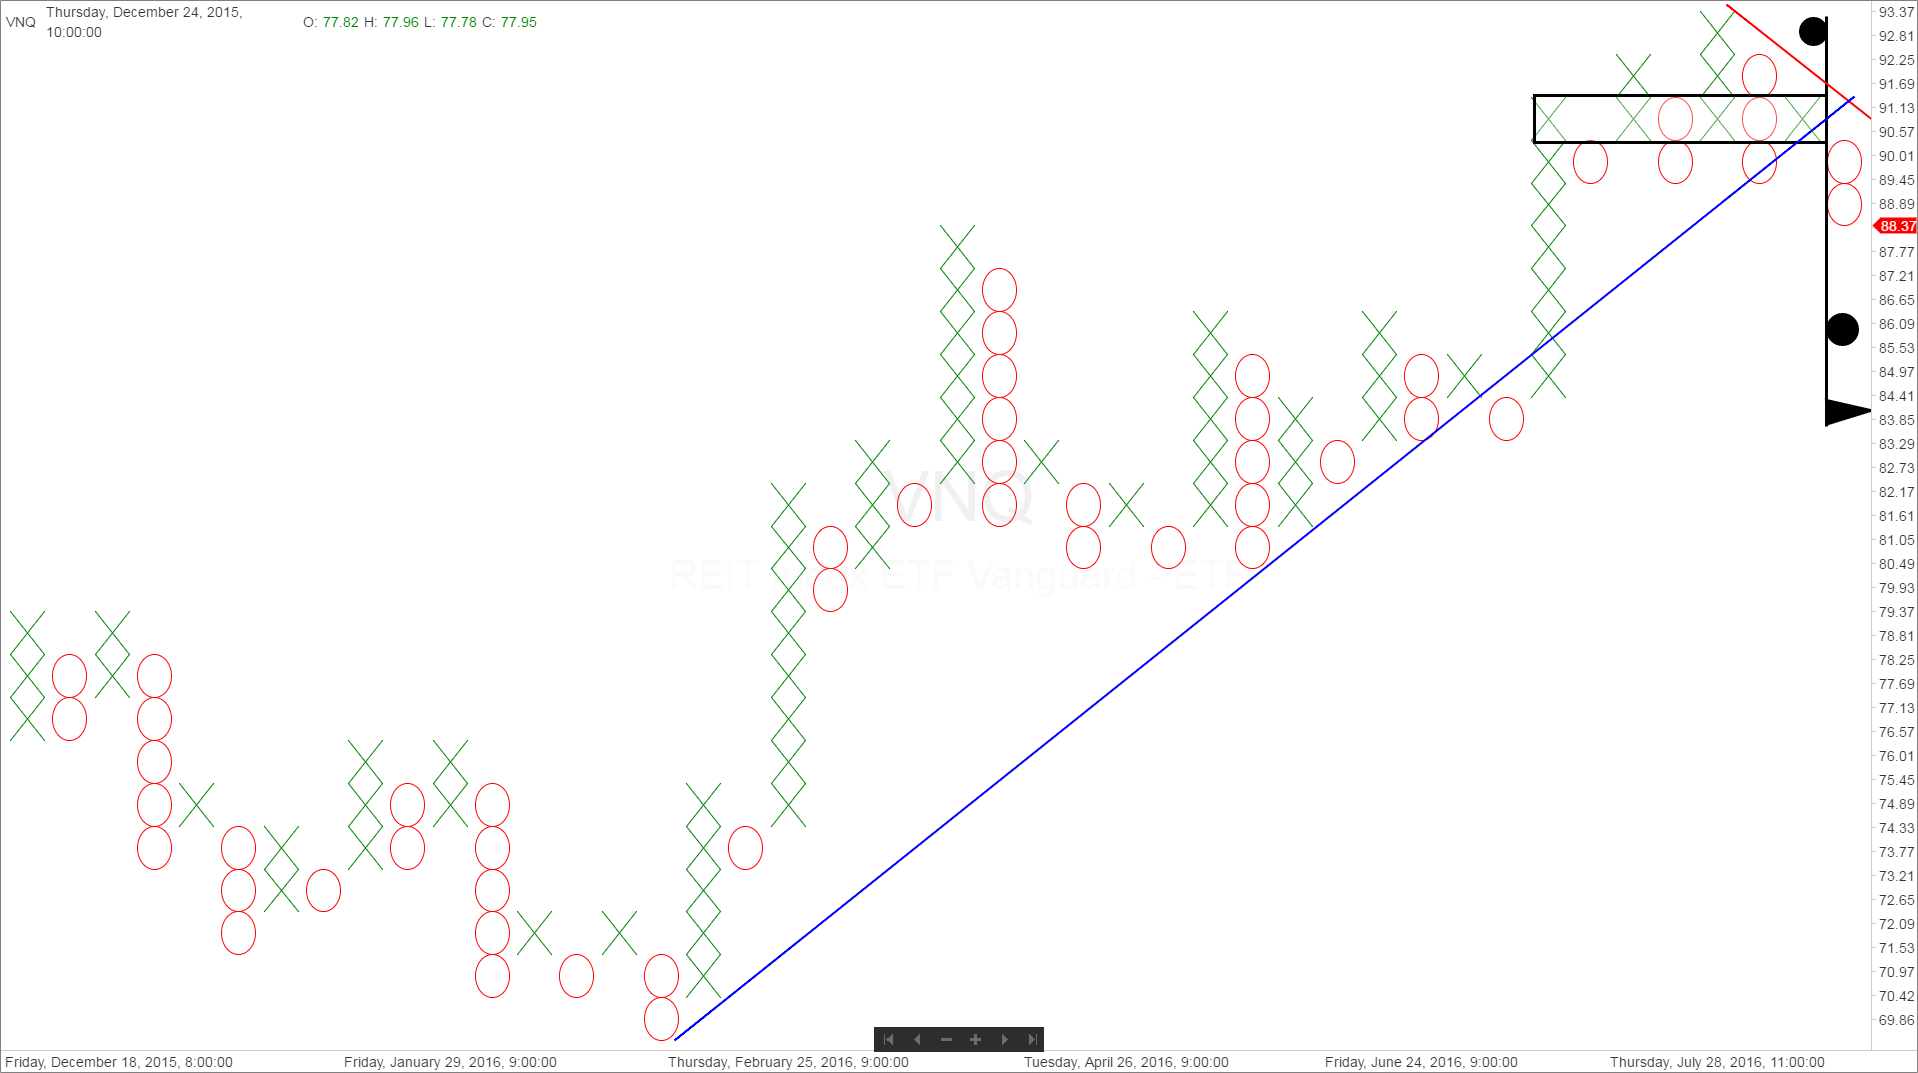
The fourth chart shows the Point & Figure chart. You can see the count from the 91 level gives us a downside target of $84-86.
We feel that VNQ has rolled over and we are expecting a stair step down to the $84-86 level. We could have a bounce short term to try and relieve the extremely oversold position. This is the most oversold that VNQ has been for a very long time, so we think this might be a change of character for this ETF, and this sector. We shall monitor future action…
Please contact us if you are not understanding or getting the full potential from the Pulse of The Market charting service.
We continue to fix minor issues, and adding more exciting features.
Thanks, Todd


Responses