We are entering a short position in Praxair Inc. (PX) for our Model Stock Portfolio at the market.
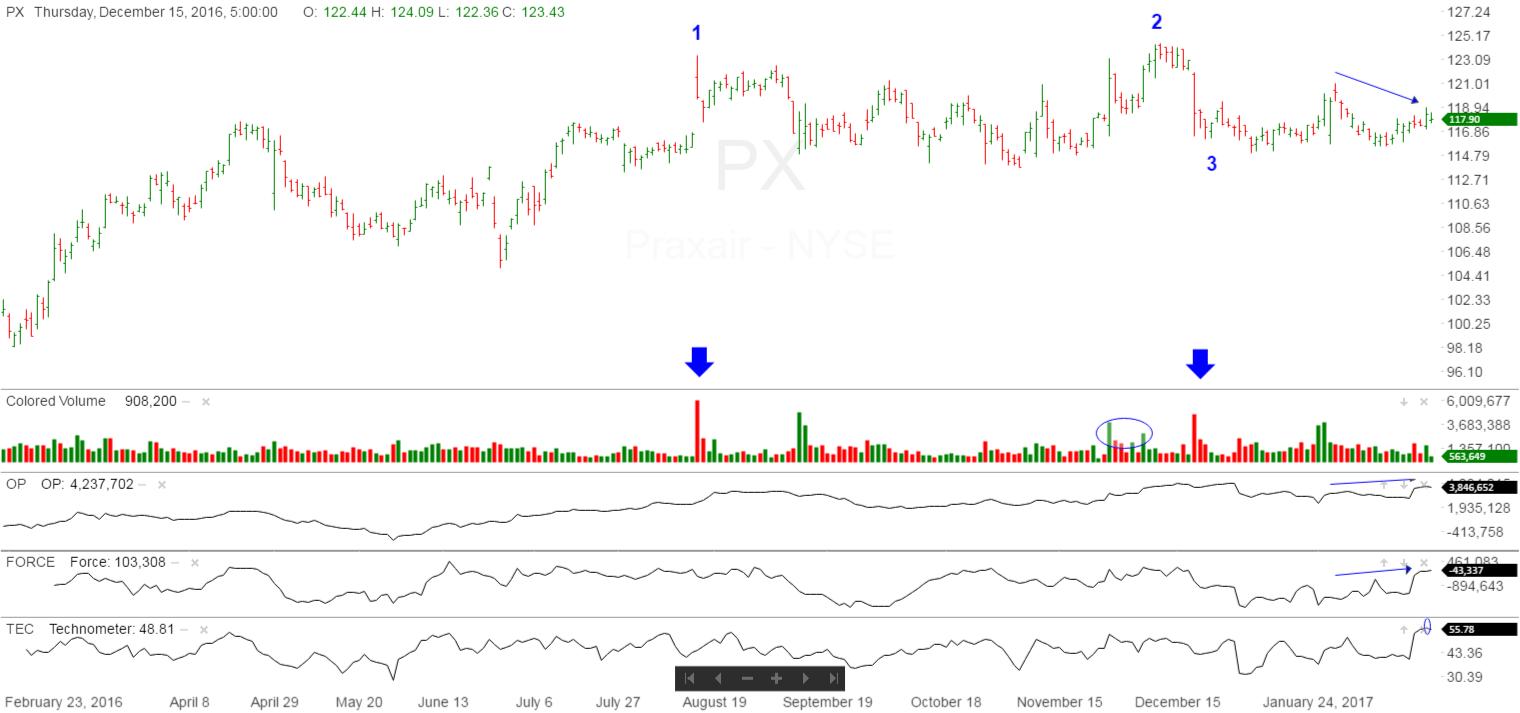
Praxair has shown considerable relative weakness on a short and intermediate term basis. On the following one year chart at point 1, we experience a Buying Climax. You can see the increase in volume stopped the advance. Then we had weeks of sideways movement moving in a narrow formation. Then on the move to point 2, we had an increase in volume and narrowing of price spread, as we reached new highs. We then proceeded back to the average level of closes at point 3. Since point 3, the stock markets have experience further strength, while Praxair has continued sideways. On the next chart we want to go in for a closer view on the arrows on the right side of the chart.
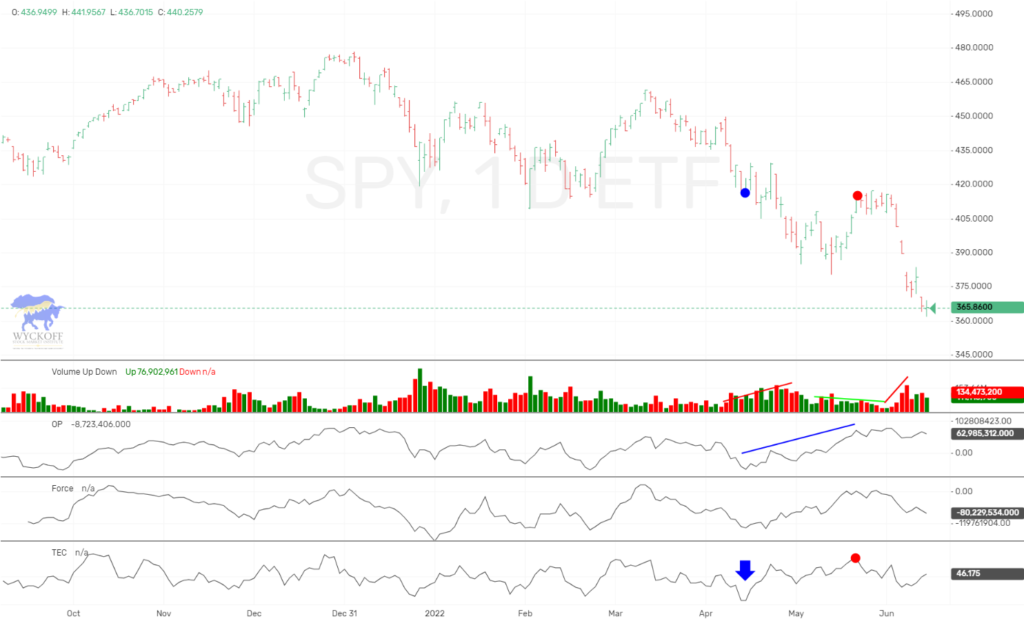
Below is the 3 month chart. As you can see with the blue arrows, the Optimism-Pessimism and Force Index has rallied over the last month, while the price has worked sideways/lower. Also during this time our Technometer has went to a dangerous overbought reading at 56.
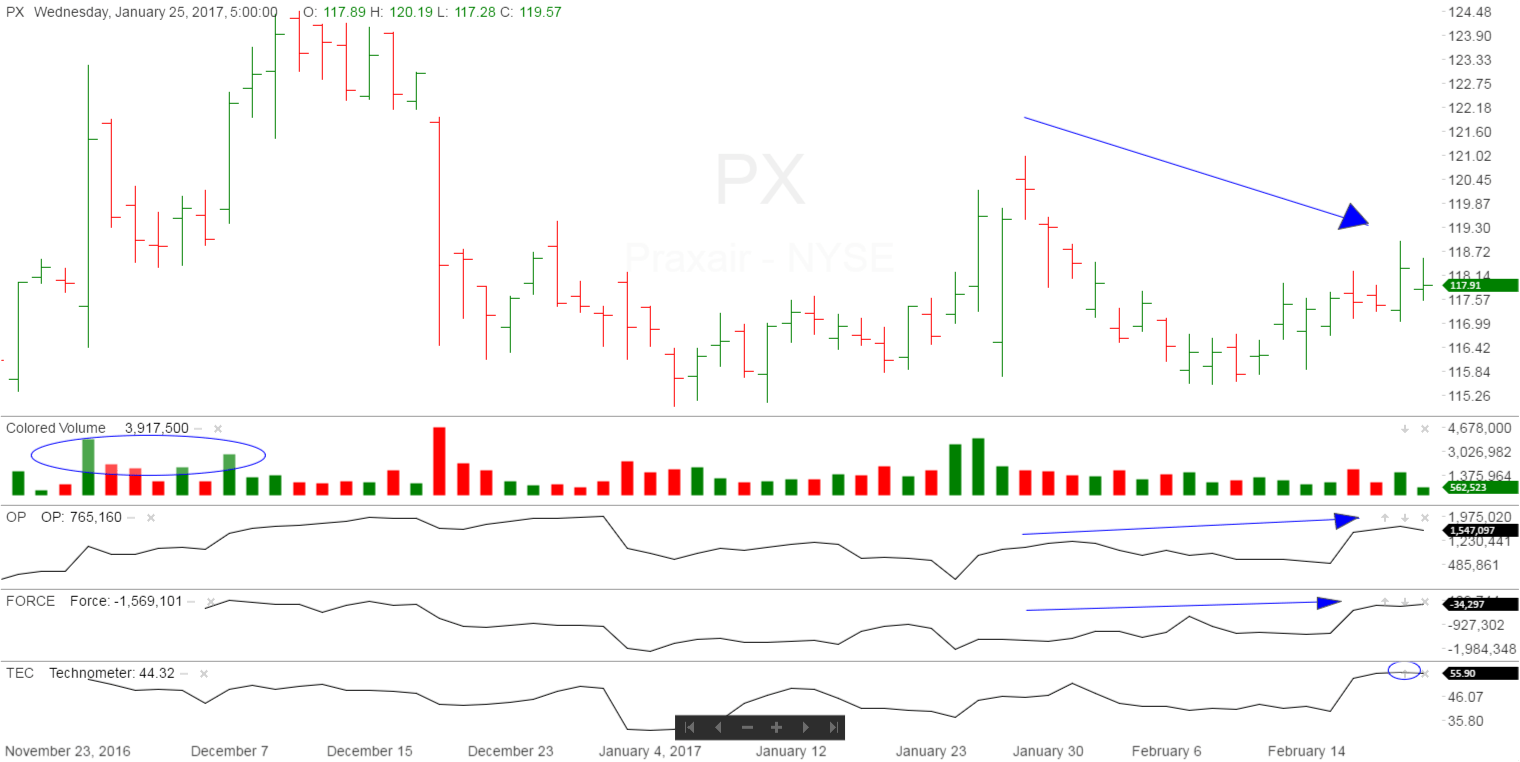
With the above mentioned, we would like to be short Praxair at the market, current price $117.82.
Good Trading,
Todd Butterfield

Responses