GDX Point and Figure Chart Objective
We have attached a 1/2 point & figure chart for GDX. We think we could see an upside objective of $26+ on this rally. This is taking the full count from the BACKUP to the PRELIMINARY SUPPORT.


We have attached a 1/2 point & figure chart for GDX. We think we could see an upside objective of $26+ on this rally. This is taking the full count from the BACKUP to the PRELIMINARY SUPPORT.
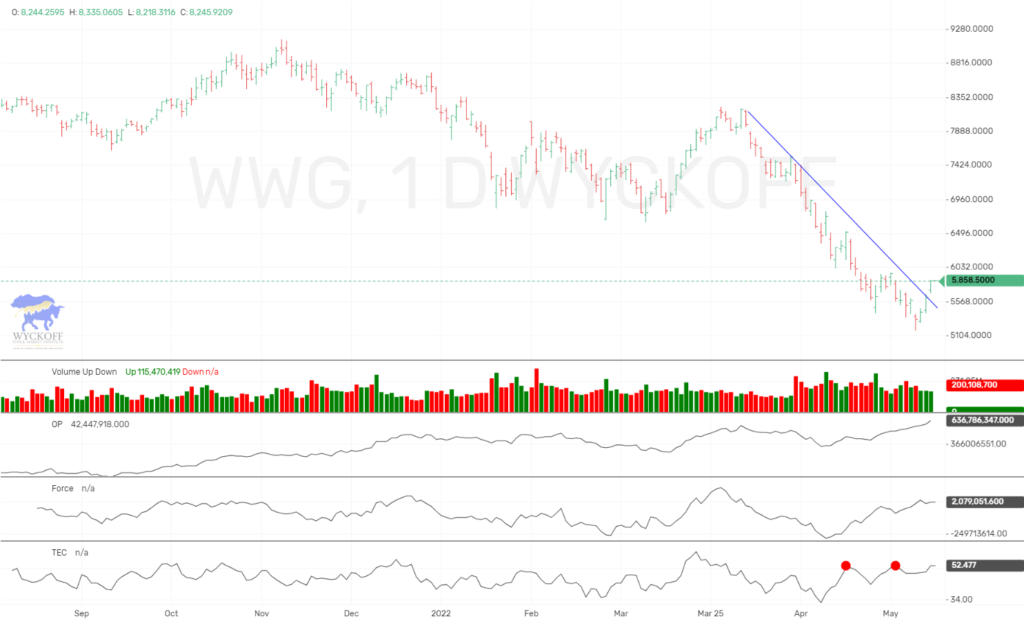
The Wyckoff Wave closed the week sharply higher, on much lower volume. The Technometer is extreme overbought. We closed strongly higher Wednesday/Thursday/Friday to end the…

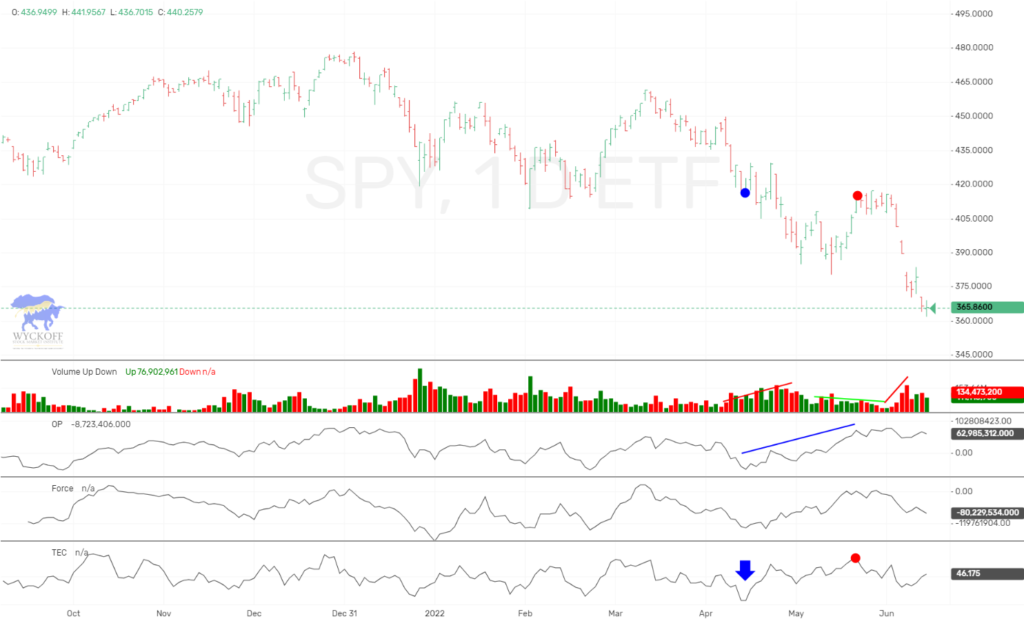
The Wyckoff Wave closed the week down sharply, on low volume. For the last week and a half, the Wave had met resistance at its…
The Wyckoff Wave closed the week down again, on an increase in volume. We was hoping that prices would try to hold early in the…
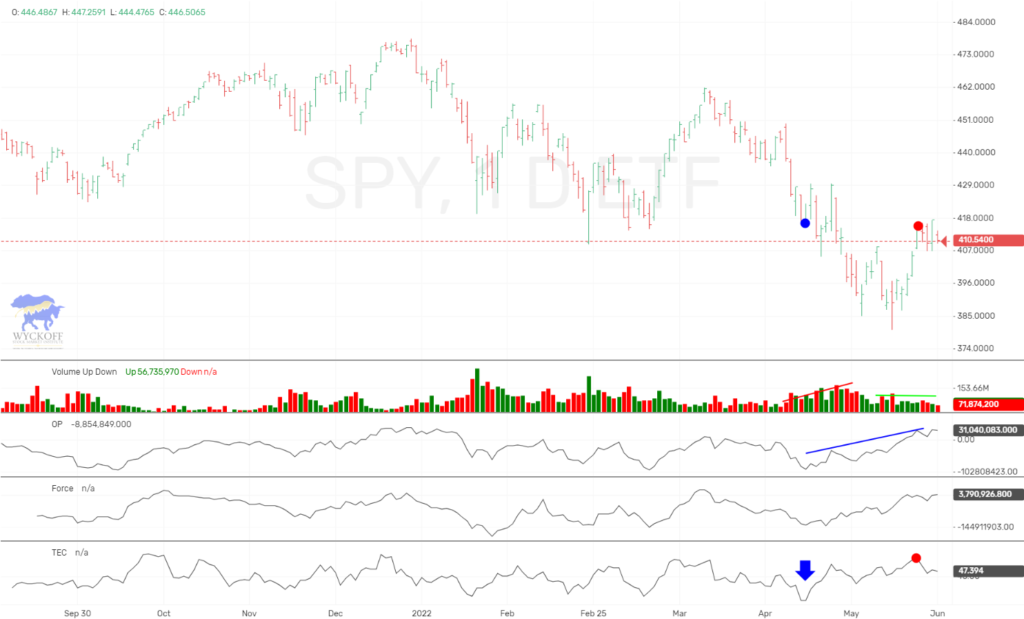
The Wyckoff Wave closed the week only slightly higher, on low volume. We had expected the Wave to meet resistance at the previous support area,…
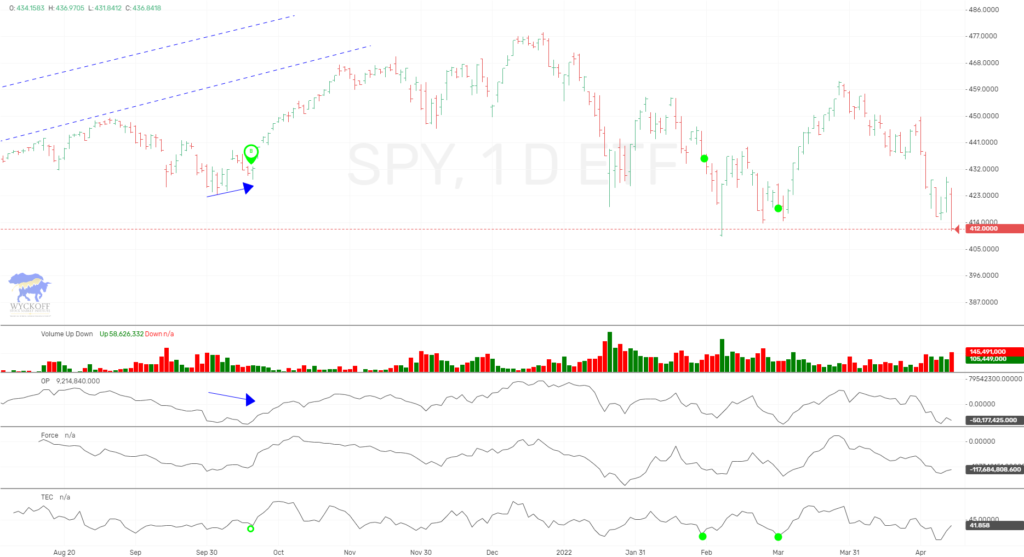
The Wyckoff Wave spent last week continuing to subdivide lower. Volume increased on the selloff. I was wanting a slightly more oversold Technometer before entering…
Please confirm you want to block this member.
You will no longer be able to:
Please note: This action will also remove this member from your connections and send a report to the site admin. Please allow a few minutes for this process to complete.
Responses