We are looking to purchase some of the mining stocks on this pullback.
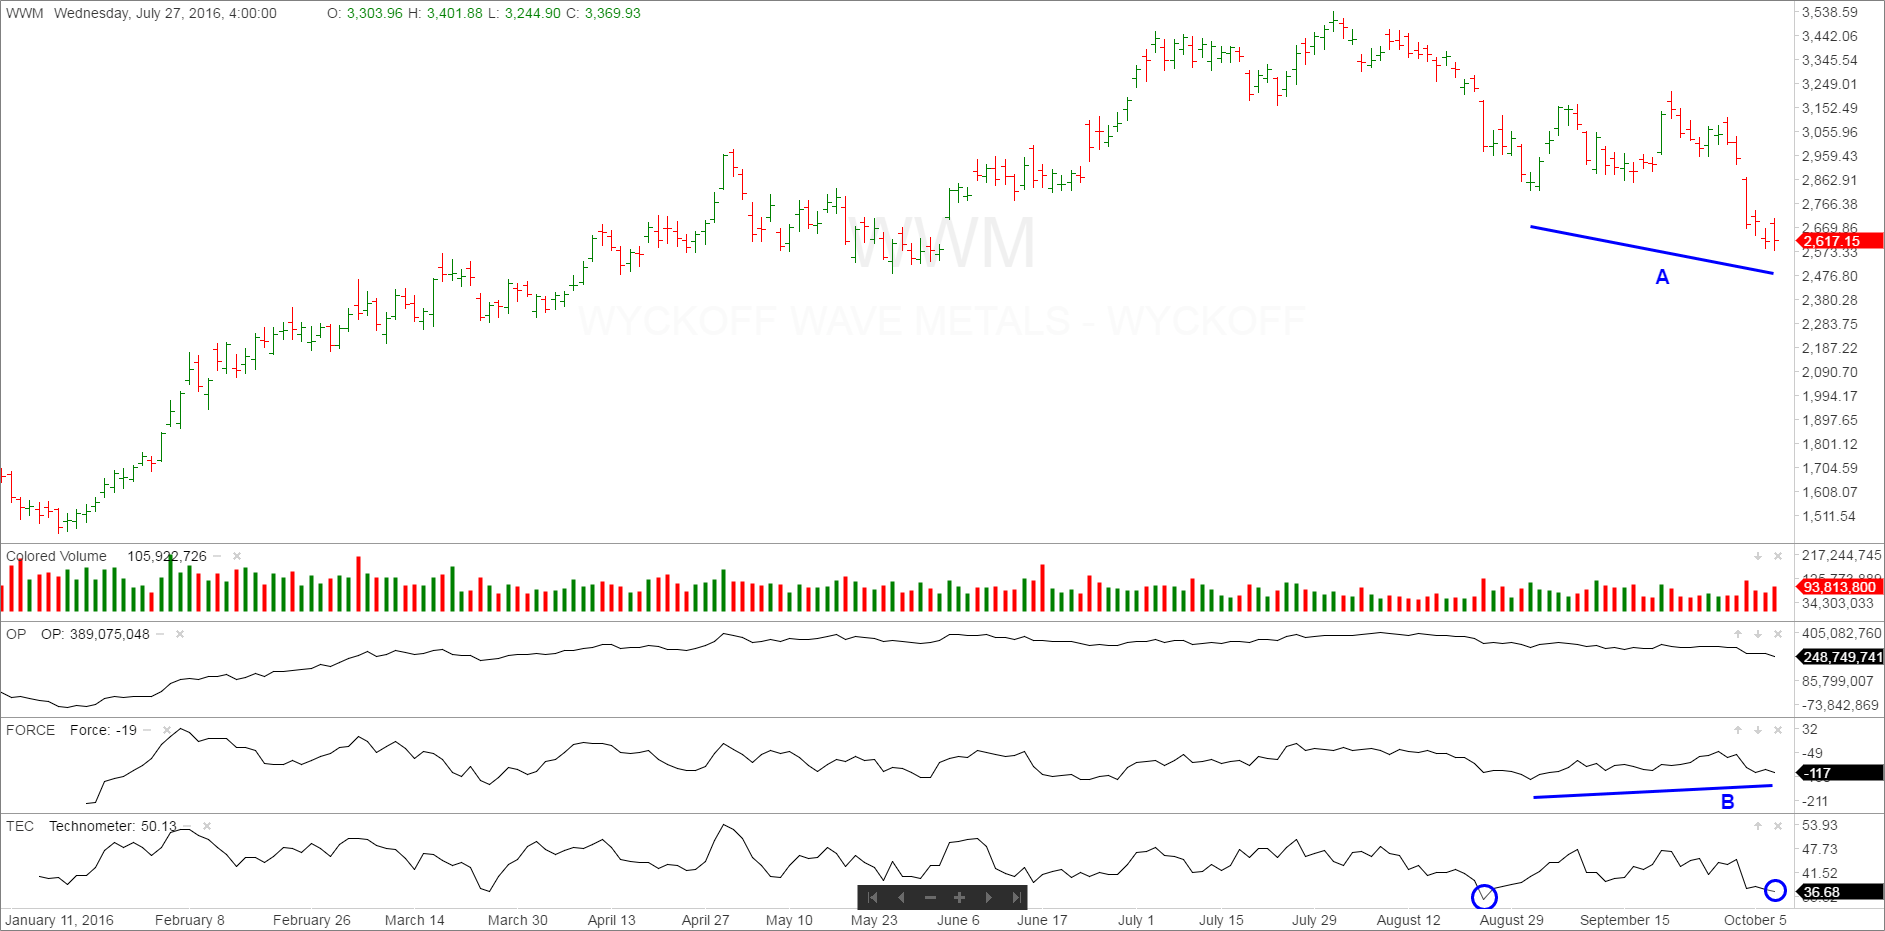
The WWM (Wyckoff Wave Metals) is starting to look interesting at these levels. The Technometer is down into oversold territory, as well as a divergence between the price and the Force Index. This recent pullback of the last 10 weeks has corrected the major advance these stocks had off the major lows. Many of these stocks are nearing 50% retracements of the prior major advance.
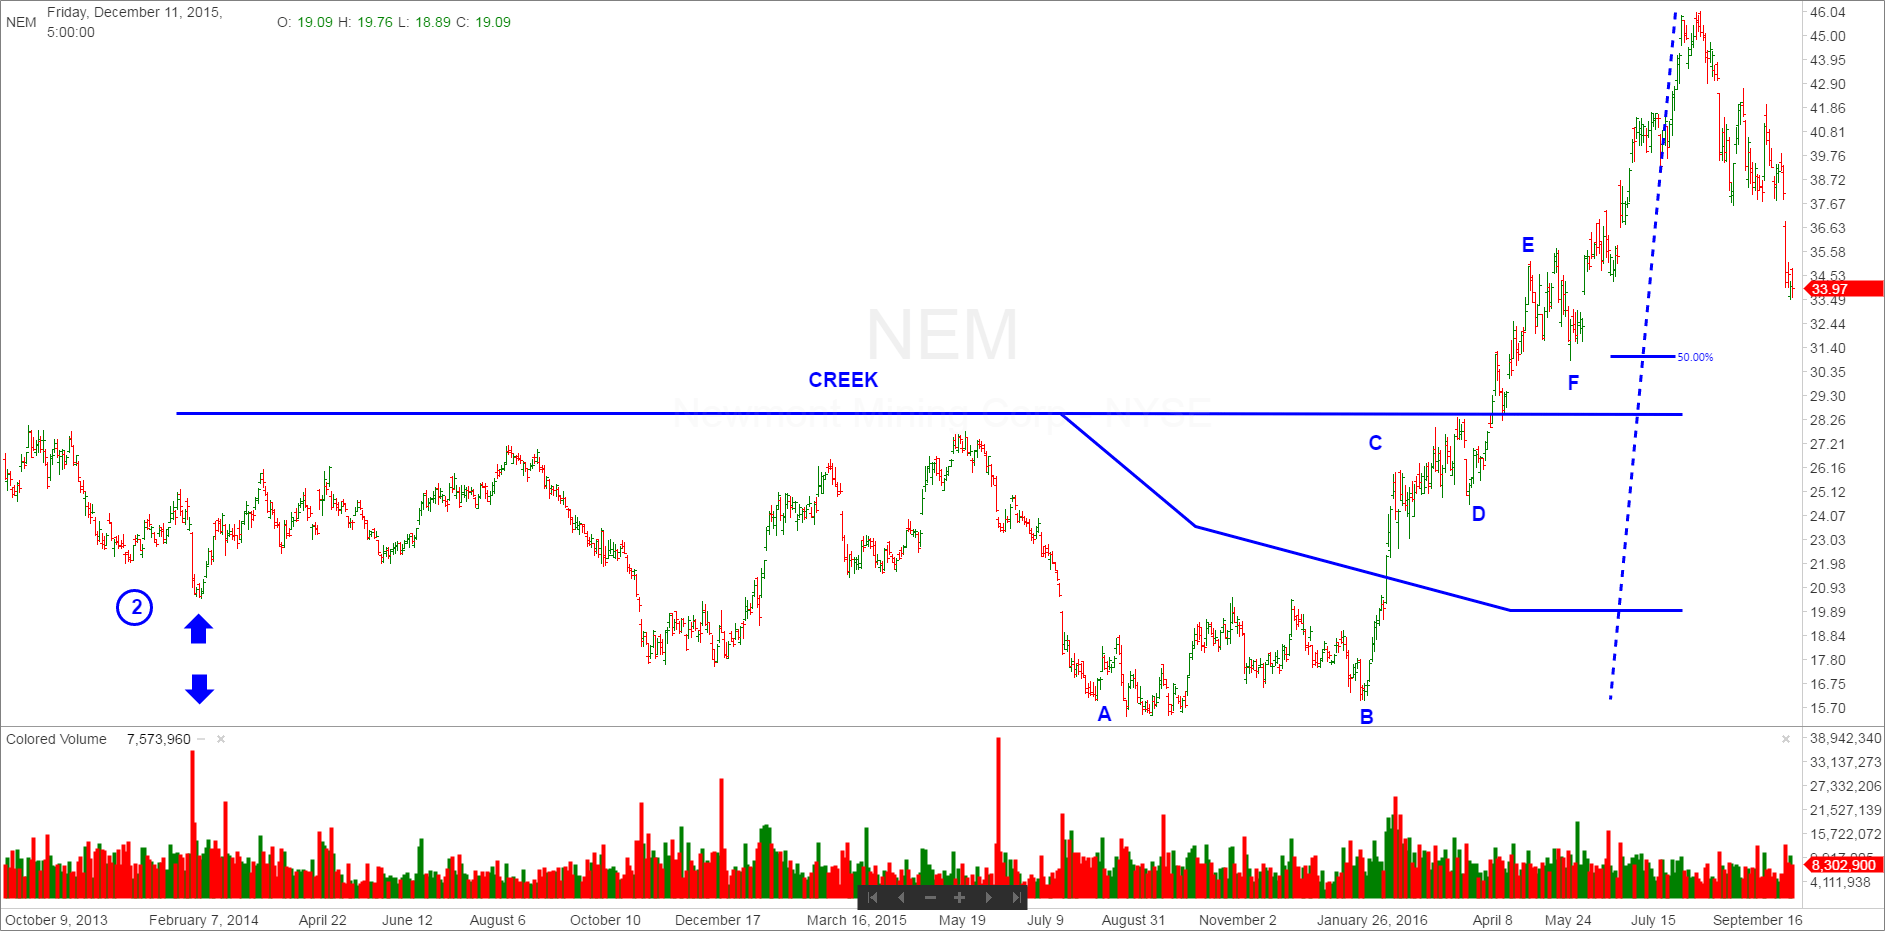
Obviously the majority of mining stocks have the same chart. Newmont Mining (NEM) is a stock that we want to look at more closely. As you can see it jumped a major creek at the $29 level and had a strong advance to $46. It is now in a correction and is nearing the 50% retracement level of the previous advance. We want to closely watch this stock in the coming days/weeks and be prepared to buy.
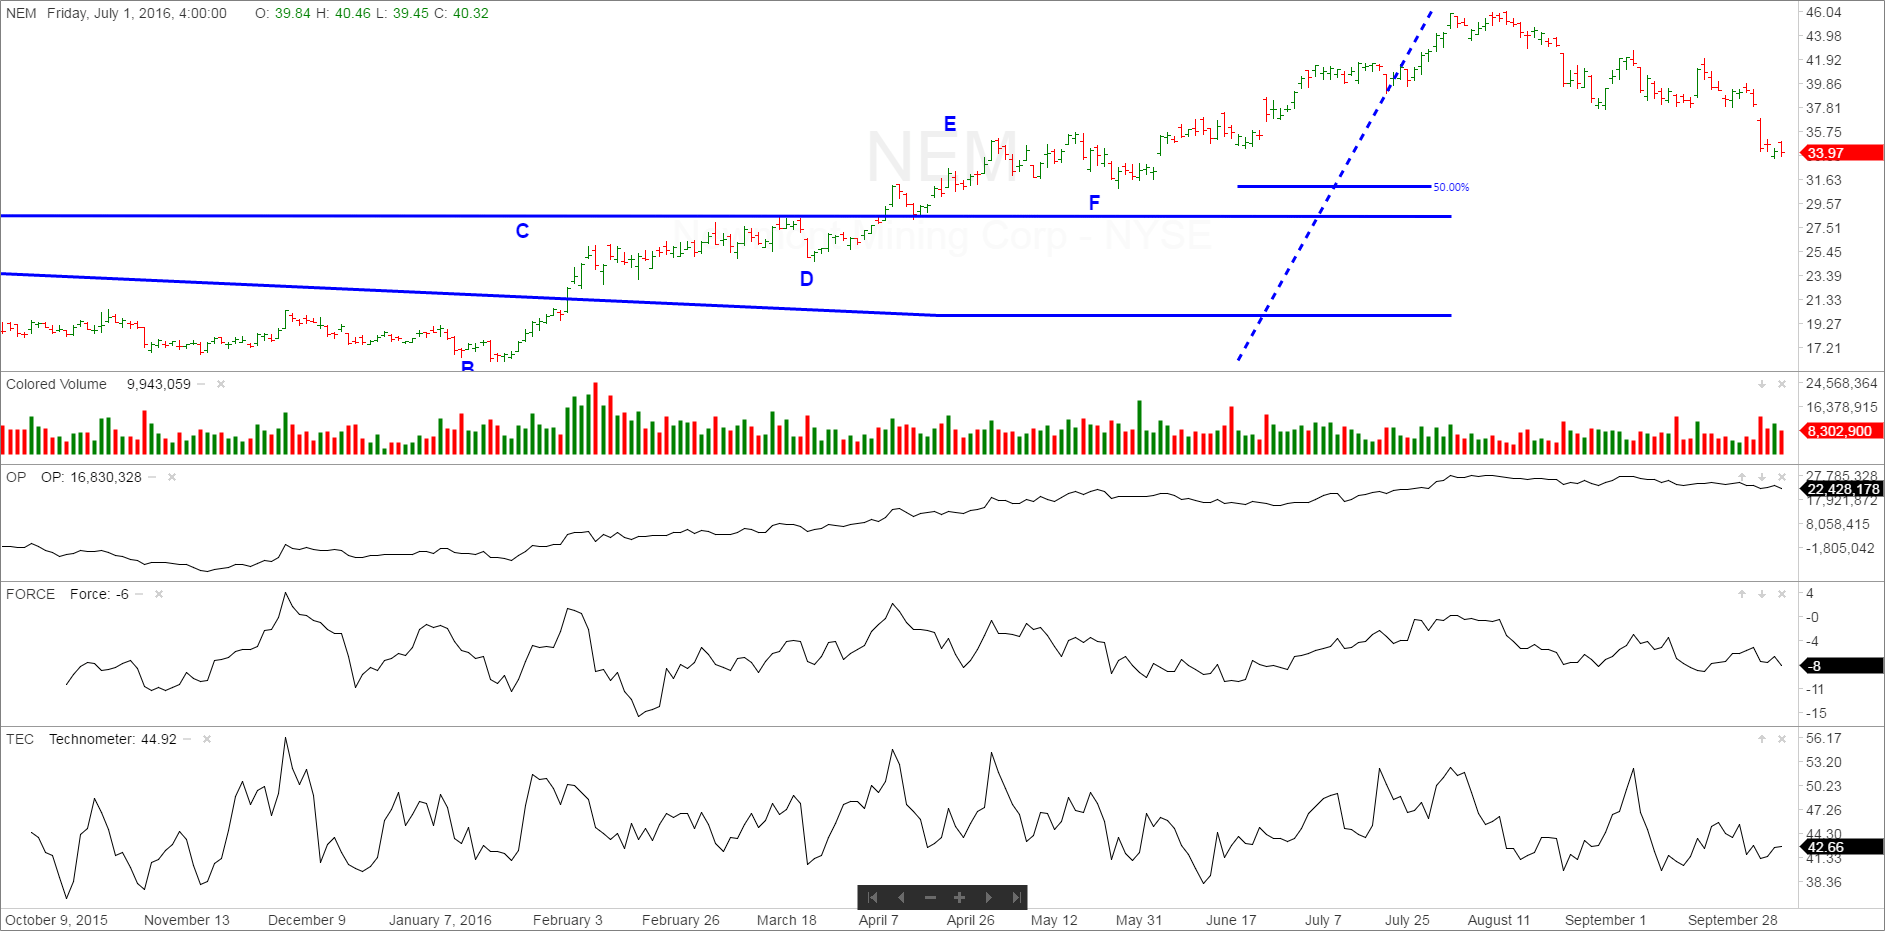
We added our Wyckoff Indictors of OP, Force and Technometer to the Newmont chart. The stock is near oversold on the Technometer, and the Force is holding at higher levels versus the Price on this last couple of week selloff.
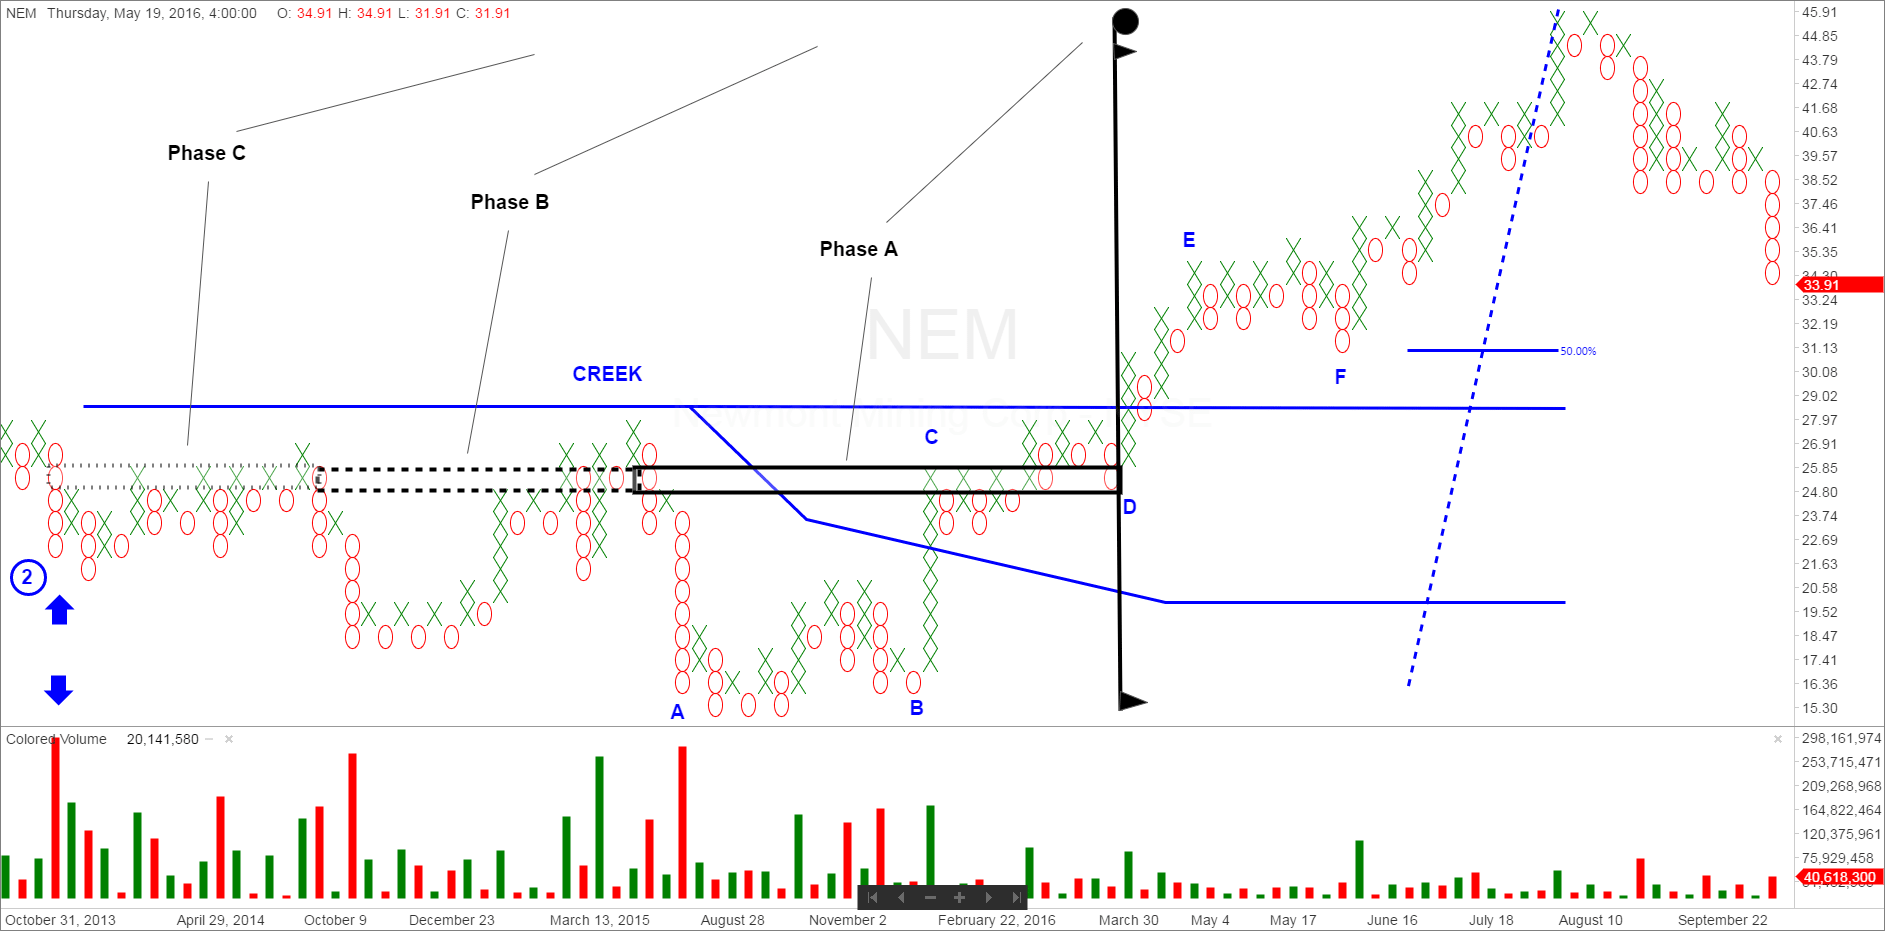
Here is the Point and Figure Chart on NEM. You can see the stock reached the objectives of Phase A on the first advance out of the accumulation base on the rally to $46. But there is much higher objectives if you add Phase B, and Phase C to the major upside count.
Lets watch the mining stocks in the days ahead!!!
Todd


Responses