New short position in USO (US Oil)
**This is a trade we were preparing late Friday, but was not able to put on before the market closed. USO has now opened down today, but we want to put this trade on. Current price $11.06.
All charts are from Fridays close…
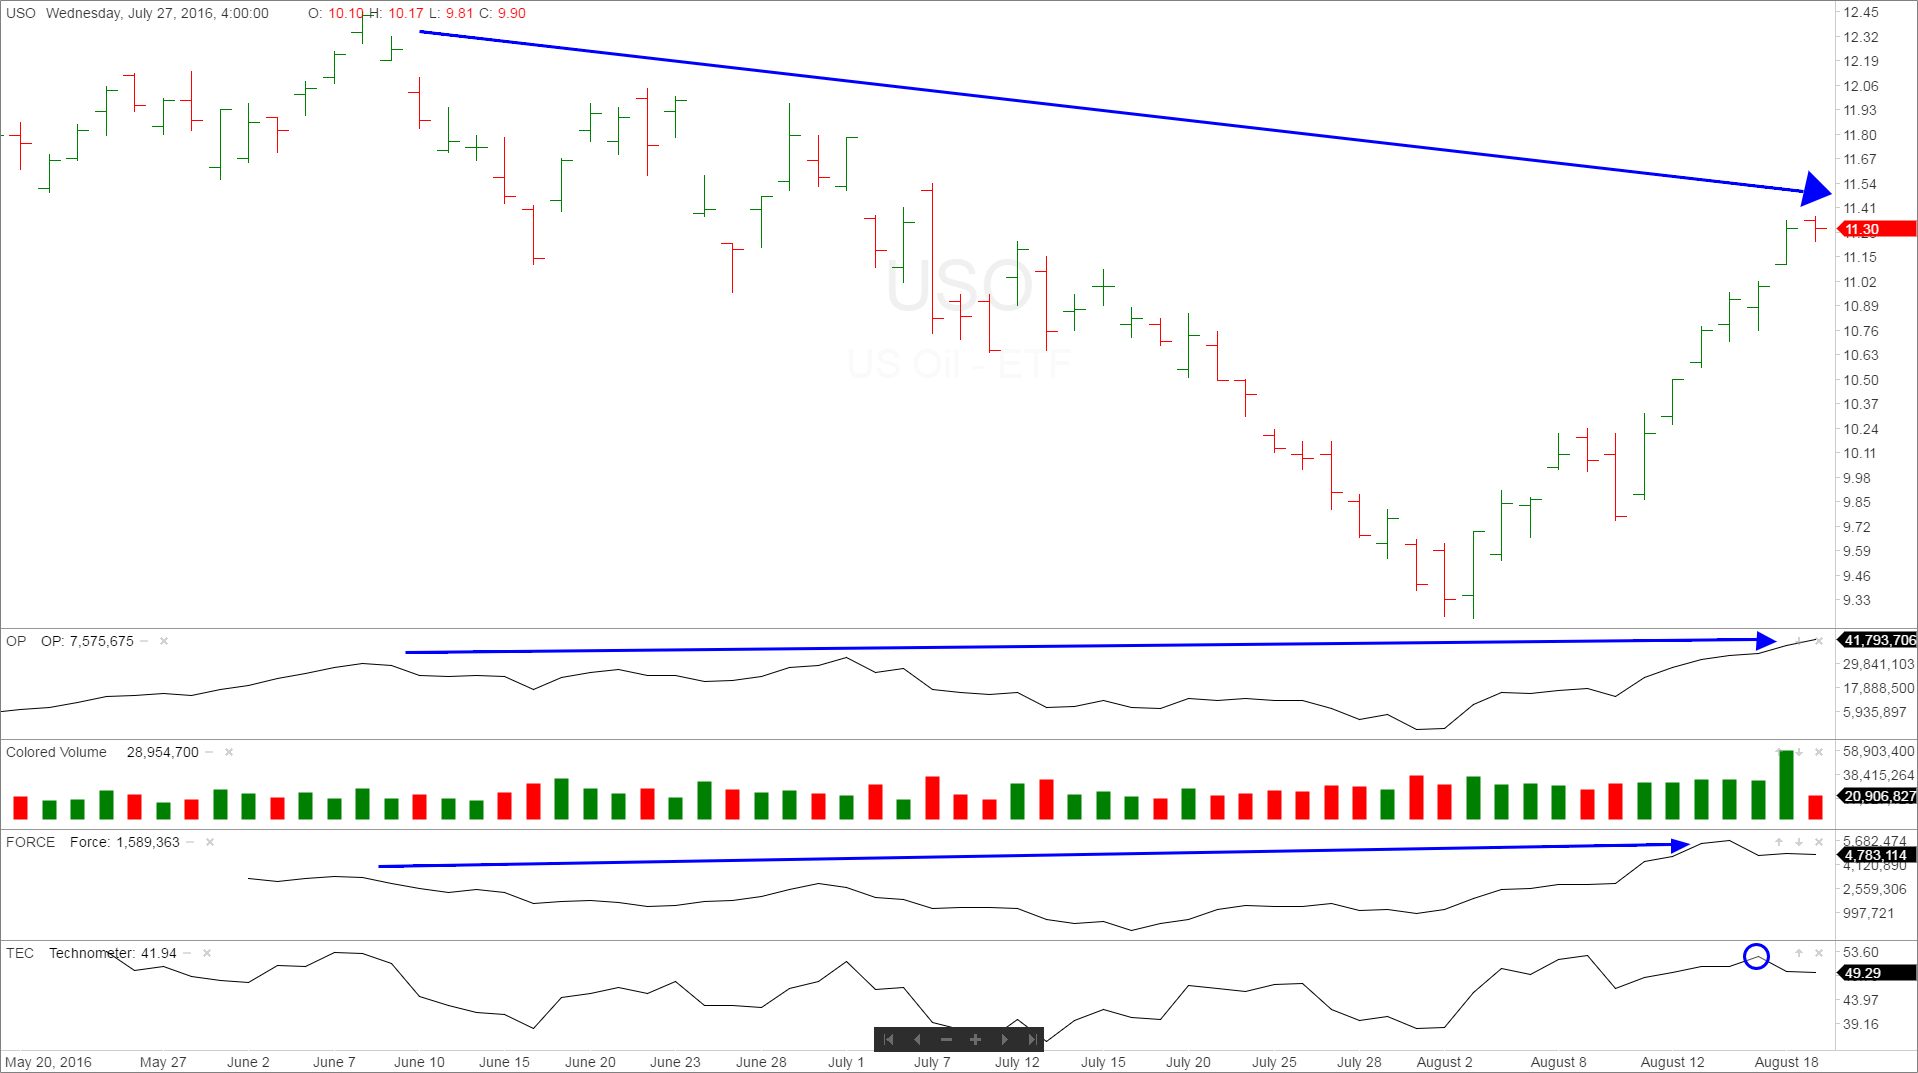
It appears that the general market is still needing more downside action. The oil futures market has had a considerable down move in last few weeks, followed by a strong quick up move. I feel we might be finding ourselves at the end of the most recent rally. I want to implement a short in this sector by going short USO at the market $11.32. Any of the various oil ETF’s are also a good short, as well as XOM (Exxon Mobil, $87.91). The following is the daily chart of USO. You can see the OP and Force have went to new highs compared to the early highs of June, as the price has only corrected some of the previous decline. We see this as a divergence, and also the Technometer is reading an overbought level, as shown with the blue circle at the bottom.
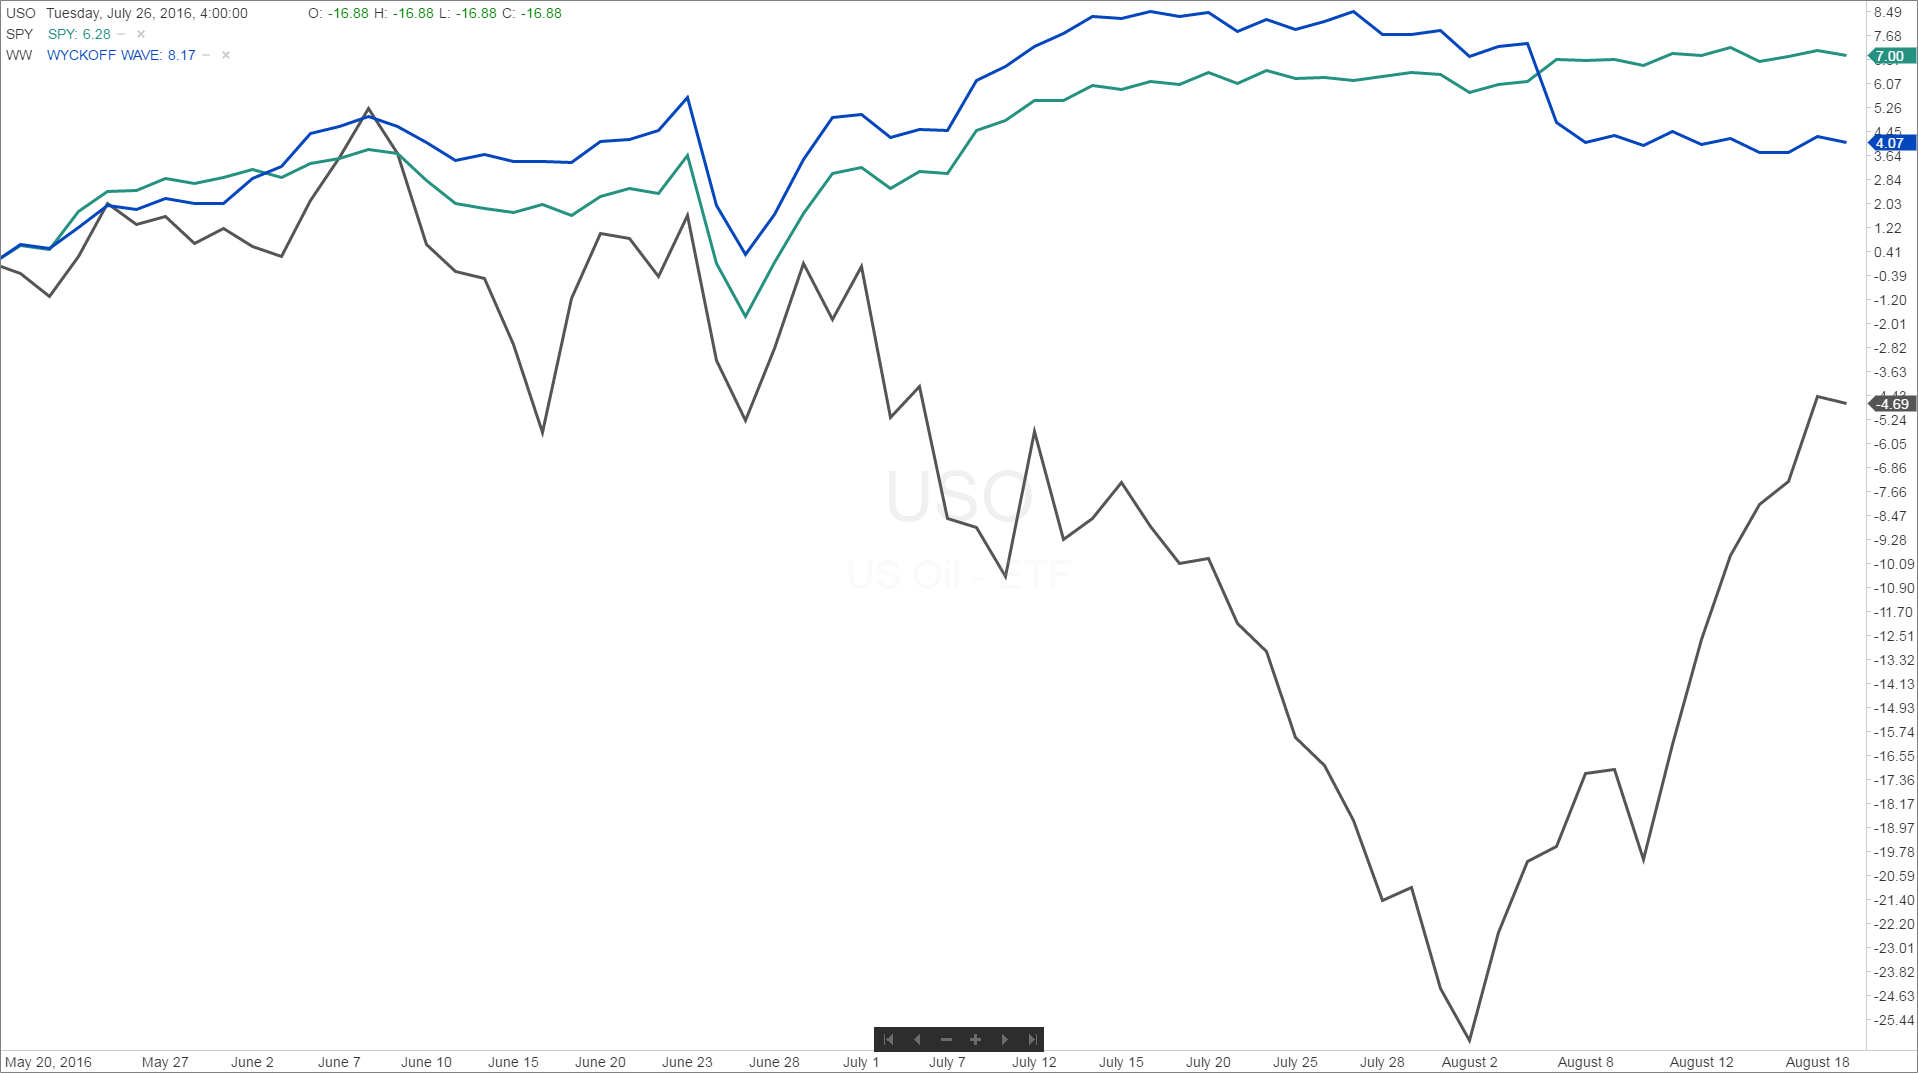
This chart shows USO (black line) versus the SPY and the Wyckoff Wave. You can see its underperformance over the last three months.
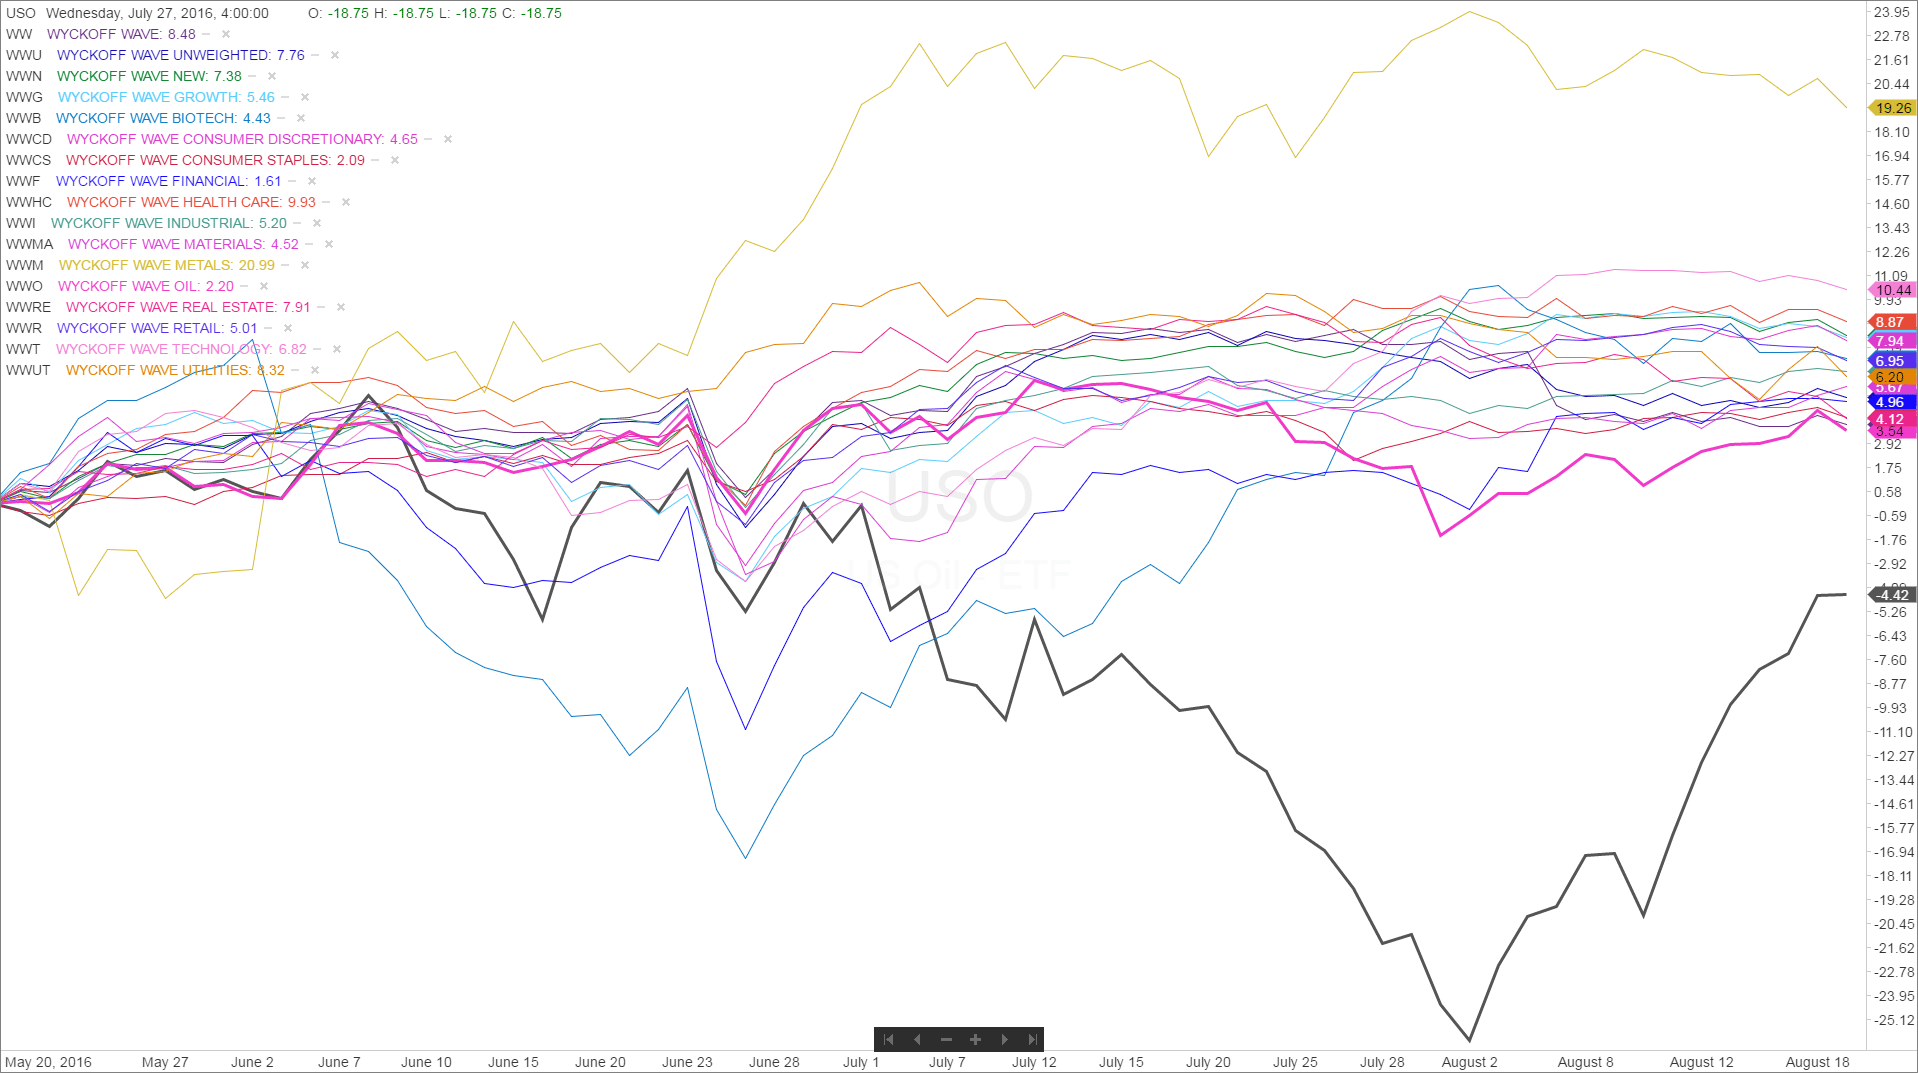
This chart shows USO versus all the sectors that we monitor here at Wyckoff SMI. The Wyckoff Wave Oil Sector is shown by the heavy pink line. So oil has been an underperforming sector, and USO has even underperformed that sector.
With all of the indications above we are entering a short position in USO today.
Todd

Responses